Alexey Ragozin on JVM diagnostic interfaces on jug.msk.ru
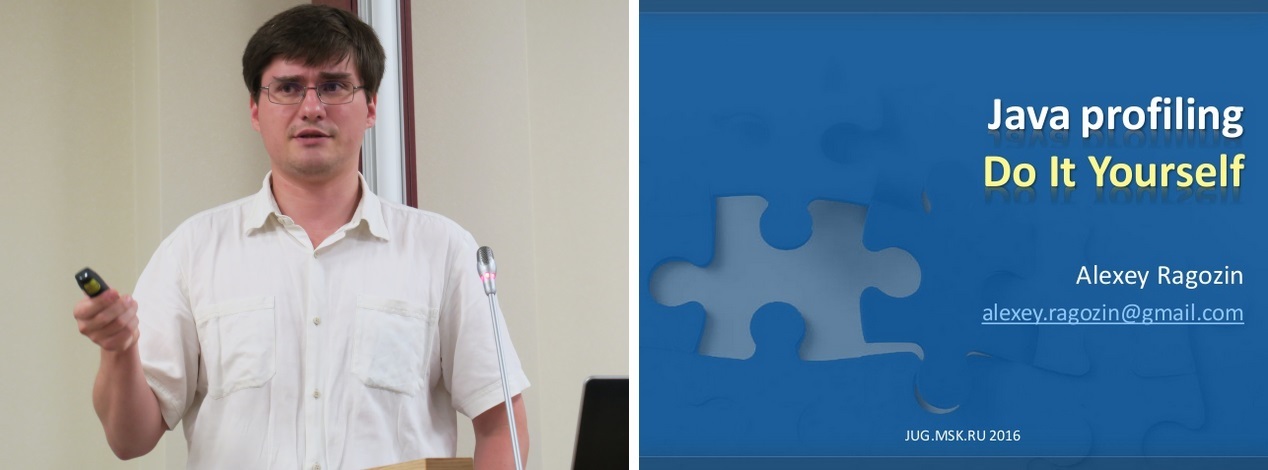
After the break for the summer holidays, meetings of the Moscow community of Java developers jug.msk.ru resumed . On August 30, 2016, in the office of CROC, there was an opportunity to listen to the report by Alexei Ragozin “Diagnostic interfaces of the JVM or how to make a profiler yourself”. Further details of the meeting.
Alexey is a frequent and interesting speaker at conferences ( Java- conferences and not only). On jug.msk.ru this is his third performance (which is currently more than that of anyone). You can read about the previous two speeches here (June 4, 2015) and here (January 20, 2016).
')
A review of Alexey’s previous speech at that time contains a complete list of his reports with links to videos and presentation files. Addition to the above list:
Presentation files for all reports (including this) of Alexey are on SlideShare . A blog with technical articles (for example, the last post is July of this year, about using the Java Native Interface ) here .
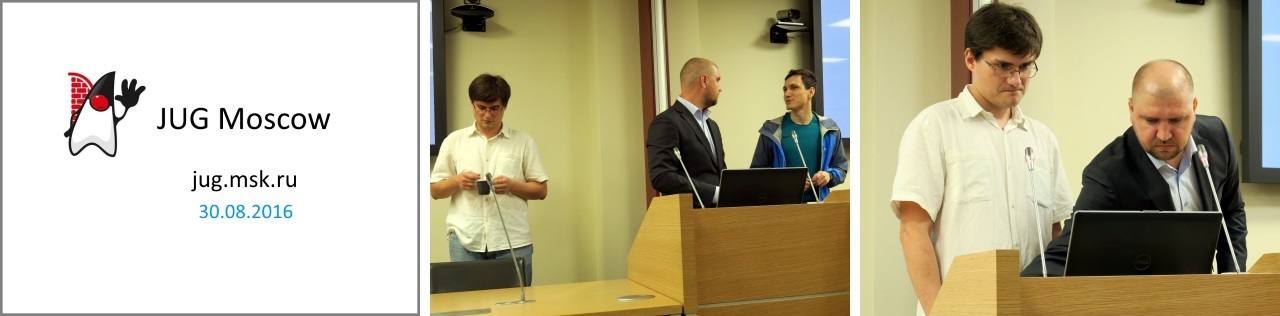
Minutes to report. From left to right in the first picture - Alexey Ragozin, Andrei Kogun and Kirill Tolkachev (Kirill is the hero of the next meeting, see postscript below).
The first part of the report was devoted to a review of the diagnostic JVM interfaces available for use. The possible reasons for writing your own profiler (a specific set of metrics of interest, automation of information gathering, compactness of a large amount of data collected, etc.) were also listed. The diagnostic interfaces with the peculiarities of their use are analyzed in sufficient detail.
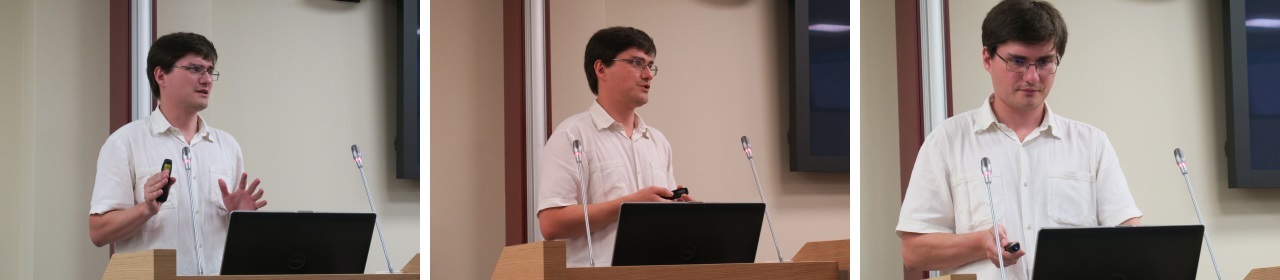
A self-written set of Swiss Java Knife command line utilities ( SJK ) was introduced for using standard diagnostic interfaces with the addition of some additional useful features.
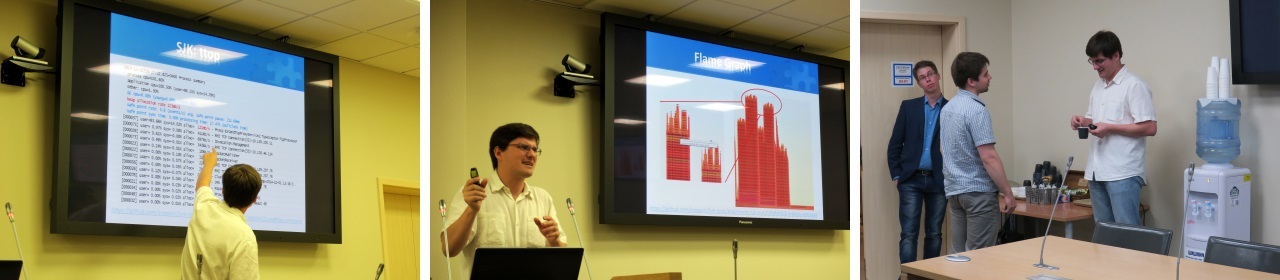
In the second part of the meeting, the demonstration of the SJK capabilities continued . For example, in the first photo below, Aleksey talks about the ttop command . The following snapshot illustrates flame graphs — a very effective way to analyze stack trace dumps. In this case, the frequency of the presence of classes in the stack traces is visualized. It turns out something like this .
In addition to SJK , other similar tools were listed: BTrace , Sigar , Flight Recorder , Honest Profiler , Perf Map Agent .
During the break and after the meeting, there was an opportunity to ask questions and talk with Alexei.
Link to the presentation . Videos and photos will soon be available here and here . It is possible to subscribe to the newsletter with the announcements of the following meetings jug.msk.ru.
PS On the coming Thursday, September 8, 2016, the report of Baruch jbaruch Sadogursky and Kirill tolkkv Tolkachev is expected , you can register here .
About speaker
Alexey is a frequent and interesting speaker at conferences ( Java- conferences and not only). On jug.msk.ru this is his third performance (which is currently more than that of anyone). You can read about the previous two speeches here (June 4, 2015) and here (January 20, 2016).
')
A review of Alexey’s previous speech at that time contains a complete list of his reports with links to videos and presentation files. Addition to the above list:
- “Distributed load testing in Java” ( jug.msk.ru-2016 : video part 1 and part 2 , presentation )
- “What should every Java developer know about networks?” ( JUG.EKB-2016 : video )
Presentation files for all reports (including this) of Alexey are on SlideShare . A blog with technical articles (for example, the last post is July of this year, about using the Java Native Interface ) here .
About the report
Minutes to report. From left to right in the first picture - Alexey Ragozin, Andrei Kogun and Kirill Tolkachev (Kirill is the hero of the next meeting, see postscript below).
The first part of the report was devoted to a review of the diagnostic JVM interfaces available for use. The possible reasons for writing your own profiler (a specific set of metrics of interest, automation of information gathering, compactness of a large amount of data collected, etc.) were also listed. The diagnostic interfaces with the peculiarities of their use are analyzed in sufficient detail.
A self-written set of Swiss Java Knife command line utilities ( SJK ) was introduced for using standard diagnostic interfaces with the addition of some additional useful features.
In the second part of the meeting, the demonstration of the SJK capabilities continued . For example, in the first photo below, Aleksey talks about the ttop command . The following snapshot illustrates flame graphs — a very effective way to analyze stack trace dumps. In this case, the frequency of the presence of classes in the stack traces is visualized. It turns out something like this .
In addition to SJK , other similar tools were listed: BTrace , Sigar , Flight Recorder , Honest Profiler , Perf Map Agent .
During the break and after the meeting, there was an opportunity to ask questions and talk with Alexei.
Link to the presentation . Videos and photos will soon be available here and here . It is possible to subscribe to the newsletter with the announcements of the following meetings jug.msk.ru.
PS On the coming Thursday, September 8, 2016, the report of Baruch jbaruch Sadogursky and Kirill tolkkv Tolkachev is expected , you can register here .
Source: https://habr.com/ru/post/309118/
All Articles