Errors of questionnaires. Error 2: questionnaire wording. 13 cases of misunderstanding and manipulation in the survey (part 1)
I continue to share the experience of mistakes and findings in the case studies. In the first article I told how you can attract relevant respondents and increase the return of completed questionnaires.
Read the first article Questionnaire Errors. 1 error: sample offset. 8 ways to attract the right respondents
In this article I will explain why the problem of clarity of the questionnaire for survey participants is much more important than it seems at first glance. Consider also examples of the manipulation of respondents' opinions, falsification of survey results and the use of surveys for marketing purposes.
')
The advantage of questionnaires - large coverage and fast results - becomes their main disadvantage. Losing the possibility of communication with the final respondent, we are forced to make an expensive assumption: “all respondents understand the meaning of the questionnaire and fill it in correctly” . If you make this assumption, you can exhale and work with the results of the survey, as with relevant facts and opinions. And if such an assumption is not made, the study can turn into a series of rechecks and approvals and eventually become completely paralyzed.
To be honest, having gone through the difficulty of attracting respondents and returning questionnaires, the less that a researcher wants is to doubt that the questionnaires are filled in correctly. But it is even sadder to realize that the questionnaires are corrupted due to the participants' misunderstanding of instructions, or questions. And in order to protect oneself and the customer from these doubts, one can observe a number of preparatory stages, which significantly increase the credibility of the study. We will look at these stages in the next article. First, we will understand where the difficulties of understanding may lie, and what this may lead to.
We can single out at least the following parts of the questionnaire survey, where misunderstanding may arise:
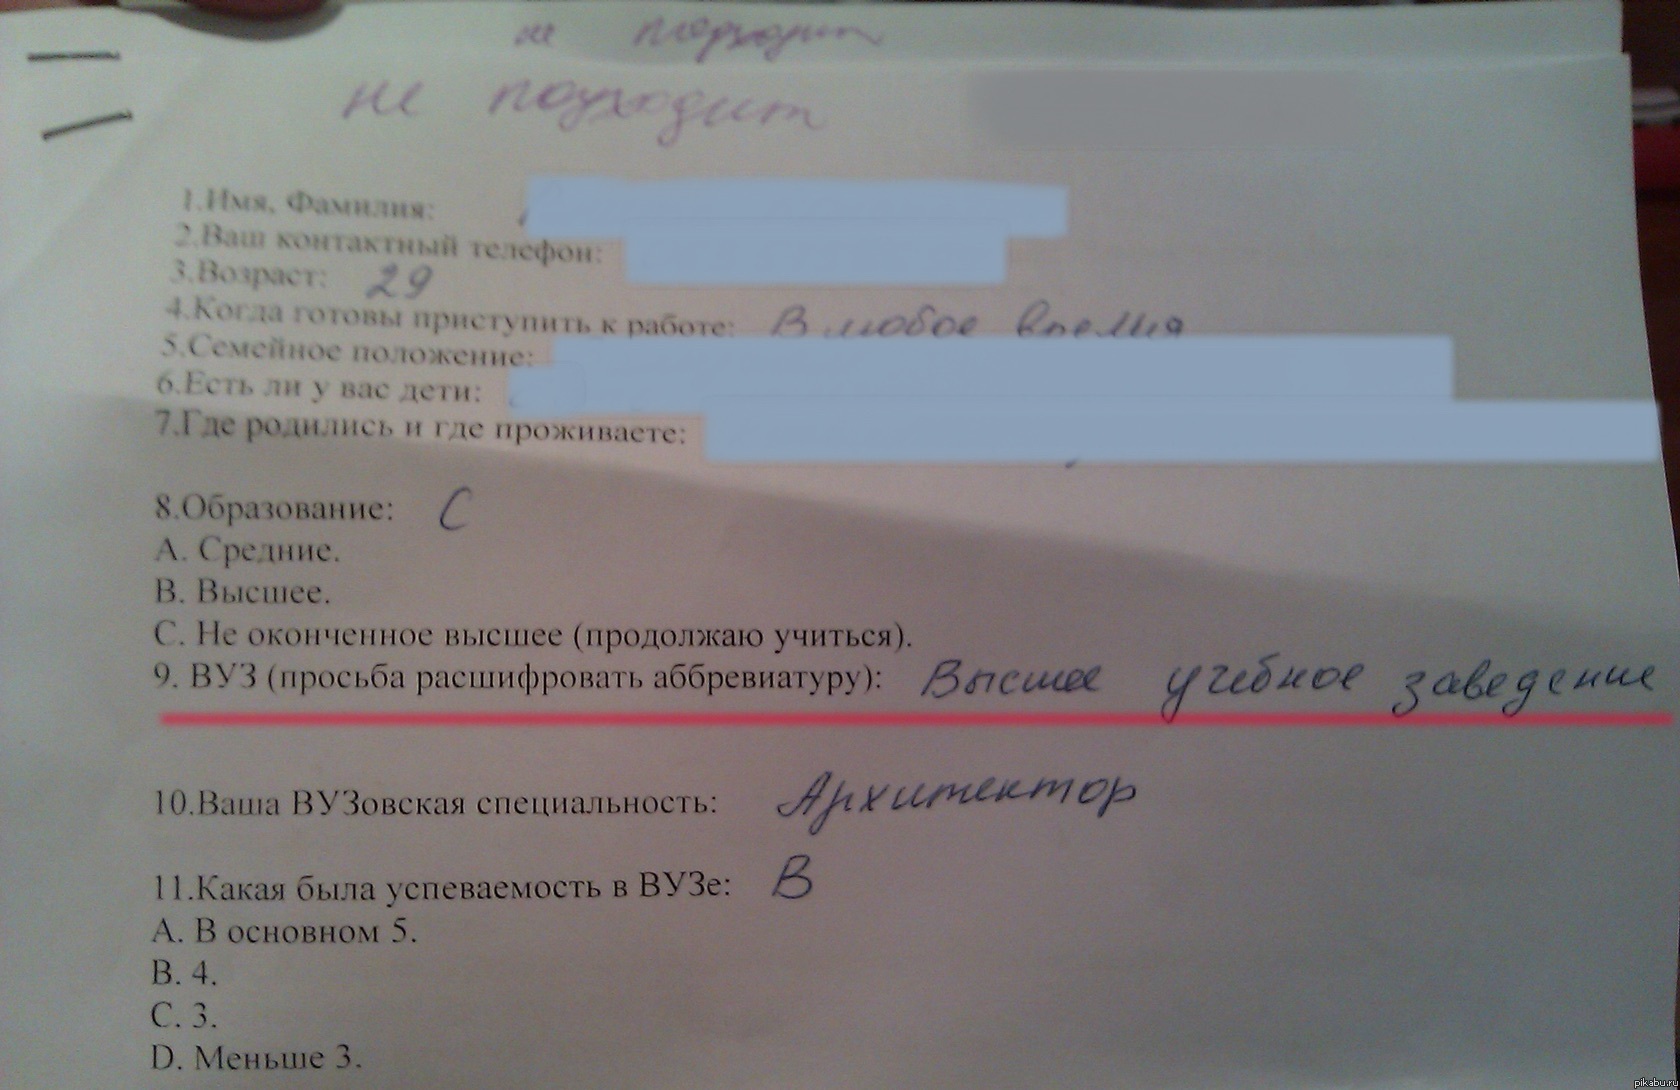
Everything is simple here. Respondents, indeed, often do not understand the meaning of words that seem obvious to the researcher. And this is not always the case with professional slang. Sometimes, it would seem, ordinary Russian words cause difficulties for survey participants, but the experimenter rarely has the opportunity to learn about it.

In the picture: the user's comment to the questionnaire, published on the site (source: pikabu.ru)
The second threat comes from the use of slang in questionnaires, which may either not be understood by the participants or annoy them. This can happen if the researcher tries to flirt with the target audience and uses their slang in the questionnaire, not being a carrier of this culture.
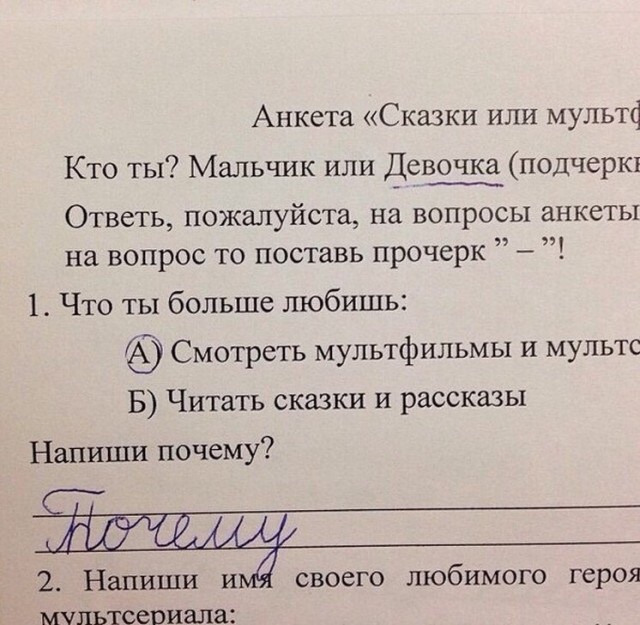
Failure to understand the instructions is the most obvious point in this article and seemingly useless. Almost all researchers clarify in the introduction to the questionnaire, what the research is aimed at, and how to fill in the form. Almost all respondents already have experience of participating in any polls, and now rarely hear the excited questions that we were asked about 8 years ago: “Do you need to put a plus sign in the box, or a tick?” And “You can cross out the answer if I change my mind ?
On the picture: Questionnaire with inaccurate instructions for applicants (source: pikabu.ru).
Despite the experience of the usual respondent, the questionnaire usability question again arises if the researcher tries new forms (for example, on-line surveys and questionnaires on mobile devices with non-obvious instructions or the inability to miss the answer), forgets the “one answer / multiple answer” option , or forgets to give correct instructions to complex questions (for example, questions with ranking, or pairwise comparison). And for the researcher great luck when it turns out to learn about the difficulties of the participant, as in the example in the picture below.

In the picture: the user's comment to the questionnaire, published on the site (source: pikabu.ru)
What seems obvious to the researcher and the majority of respondents may present difficulties for less experienced participants.
On the picture: Questionnaire with inaccurate instructions, not adapted for the survey participant (source: adme.ru).
In creating a questionnaire, or planning an interview, there is one rule: “A question is almost the answer.” An informative answer can be obtained only with a very well thought out question. In order to create such questions, a lot of preparatory work is carried out (in the next part of the article I will talk about the stages of this preparation).
But our experience with researchers shows that almost no one pays attention to such training. Responsibility for the answer is often assigned to the respondent, a substantial assumption is made that the respondents have a stated opinion on our question and very much want to express it. Often this is a completely wrong assumption. Not only the problems of researchers, but the language of their questions are often not perceived by respondents.

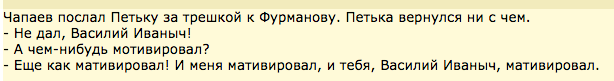
In the picture: A still from the film “The Hitchhiker's Guide to the Galaxy”.
Wikipedia: “The Final Answer to the greatest question of Life, the Universe and All That” (...): “Forty-two”. The reaction was:
- Forty-two! - screamed Lunkkuol. “Is that all you can say after seven and a half million years of work?”
“I checked everything very carefully,” said the computer, “and with all certainty I declare that this is the answer.” It seems to me, if we are absolutely honest with you, the whole thing is that you yourself did not know what the question was.
- But this is a great question! The final question of life, the universe and all that! - almost howled Lunkkuol.
“Yes,” said the computer in the voice of a sufferer who enlightens the fool. “And what is this question?”
On the picture: One of the variants of the Russian-language translation of the questionnaire of staff involvement from the company "Gallup" (Source: antropos.ru).
We were unable to find references to publications with adaptation and validation of the Gallup questionnaire (mandatory steps when using translation techniques). Nevertheless, one can find several options for his free translation, many recommendations for its use in business publications and even more offers from consulting companies that use 12 unvalidated and non-adapted questions as the only tool for measuring staff involvement.
Naturally, when a client sees in a report only generalized indicators of involvement and - even better - the growth of such indicators, he rarely asks about the methods by which they were obtained.
Failure to understand the direction of the question - a much more complicated and common mistake in the case studies. Sometimes it is impossible to assume how a person can interpret a seemingly unambiguously formulated question.
There is an elegant solution for this problem, which we will discuss in the next section. In the meantime, you can talk about cases where researchers deliberately hide the true meaning of the question, or confuse the language to get the desired answer.
The illusion of choice. In the practice of social manipulation there is such a move: providing the interlocutor with the illusion of choice, in which any of his answers will be beneficial to the manipulator. A classic example of the illusion of choosing from the sales of fast food chains: When a customer orders a coffee, the waiter asks: “Will you take a muffin or a cake for coffee?” (The question “Would you like something for coffee?” Is considered far less effective in terms of sales ). Such a move is often used in questionnaires when the study organizer is interested in certain answers.


In the picture: Fragment of the feedback form for participants in the game.
Questions 5, 6 and 9 are questions with the illusion of choice. They look pretty full. But, if you take a closer look, any answer option either reflects a positive assessment, or shifts the responsibility to the person filling out (according to the principle “this was not a bad game - I still do not understand the standards of behavior that have been explained to me for several months already”, or I understand the essence of the standards well ”).
The last question is a sample question with the illusion of choice. All his options are positive. When formulating it, we knew how the results would look in the report: how the charts will look at the positive effects that we set in advance in the questionnaire, and how pleasant it will be for the manager to look at them. When a person views such a report, he rarely has a question about whether negative responses were provided for in the questionnaire.
If the customer of the study is not interested in the source text of the questionnaire and does not specify which options were provided to the participants, the organizers can replace the meaning of the results by placing accents.

In the picture: a fragment of news about the results of the survey (source: www.solidarnost.org ).
In the picture: a screenshot of the news feed - placement of accents in different editions (source: joyreactor.cc)
Substitution of concepts. In fact, the practice of protecting before the customer only the results of the study without first considering the raw data and methods of collecting them, leaves a huge field for falsifying data and manipulating the results without any falsification. In such cases, it is important to pay attention to the logic and direction of the questions in the questionnaire before analyzing its results.
Therefore, it is especially funny to look at the offers of training and consulting companies to independently assess the effect of staff training or implemented implementations, and to provide the customer with a report on the return on investment. In feedback questionnaires, contractors may not ask employees at all, but in the final report to replace concepts. But customers usually readily accept such reports, as they look quite authoritative, and do not require efforts from internal services.
Suggestive wording. The tonality of the question in the questionnaire, or its focus may lead the participant to a specific answer. The benefit of the research organizer from such answers is to confirm their own position (for example, when falsifying theories, or to justify management decisions).
In the picture: The wording of the “programs” of the Asian Disease experiment and the preference of answers by participants.
Another common example from D. Kahneman’s research is to ask one group of subjects: “Did Gandhi live for 114 years? At what age did he die? ”And another:“ Did Gandhi live to 35 years? At what age did he die? ”, Then the first group will evaluate the life of Gandhi as much longer than the second.
Thus, by successfully formulating the questionnaire questions, focusing on positive options, or using suggestive numbers, the researchers create a “linking effect” and can manipulate the participants' responses.
The second option , in which the technique of suggestive language is used, is a gradual change in the beliefs of the research participant using a questionnaire. In this case, an outline is created from question to question, in which the respondent is forced to respond in a certain way, encounters his answers as with new ideas, and gradually changes his point of view. A continuation of this method are questions that create a need (see the next paragraph).
, . – . .
- « ?», « ?», : « N?». .
. – , (. ).
: , . : « , , – , , – , « »?». 10-13 , . (: Ridus.ru, RG.ru).
– , , () . , « ». , , , .
, :
a) the respondent is led to the idea that he does not have something, or something is used ineffectively (cause anxiety),
b) inform about new services (goods, options) that will help solve his problem (which he did not know before the survey begins).
Approximate algorithm of the questionnaire, creating the need:
1. Introductory neutral questions on the topic, “ice-breakers”.
2. Questions about the current status of the respondent, which gradually bring him to the idea that he is missing something or something is outdated.
3. Questions clarifying whether the respondent understands what the consequences of this shortage are and how it may turn back personally for him or his business.
four.Questions about whether the respondent is familiar with some solutions (goods, services, technologies).
5. Questions informing the respondent exactly how these decisions help to cope with his problem.
6. Questions suggesting purchase (informing about price, discount, conditions).
7. Questions confirming that with the purchase of this solution, the respondent’s problems will be resolved and he will receive additional benefits.
In this example, the “white threads” of sales are still clearly visible, but the closer your respondent is to client status (for example, he completes a questionnaire on the product site) and the closer he is to the purchase, the better he will accept such questionnaire and the easier it will be to increase the volume of its purchase due to additional sales.
Third option , , . - « ?» ( ), « ?» ( , ) .. , .
: ( ).
. , , , , , .
Researchers do not always clarify assessment criteria, expecting them to be intuitive to participants.
, (, ), (, « » « », «» « »). . , , , - . , - , (: « » — «…» — « »).

: , (: pikabu.ru)
, , - . « » , , (, « , , , 4 5 – , , »).
Such averages are often found when evaluating employees using the 360 degree method. When evaluating their colleagues, people tend to give positive scores to the “favorite” and neutral, or negative, scores to “unloved”, regardless of what parameter they are graded on (the unloved employee may be a strong leader, or not in conflict with anyone, but “hand will not rise "to give him high points even for these indicators). As a result, such an assessment turns out to be completely useless for the organizers of the study, since it does not make it possible to single out real problem points among the company's employees.
Similarly, the situation with the evaluation of user experience when working with IT products. If the site, or the company, in general, likes the user, he will be inclined to give, in general, high marks in order to “not offend anyone.” And such a survey will not help developers make the product better.
«» , ( – – ). , , , , .

: « » 360 . , , , ( ).
– . , , ( ). , : « , », « , , ». , , , .
I tried to describe examples when the survey stages that are obvious to research organizers are misunderstood by the participants. Respondents may misunderstand words and phrases, the wording of questions, instructions to the questionnaire, evaluation criteria and the focus of questions. These difficulties lead to the collection of irrelevant information, or non-return of questionnaires.
We also considered examples where the confusion of respondents is provoked deliberately in order to manipulate the results of the survey. Among such manipulations:
- providing the illusion of choice;
- placement of accents;
- substitution of concepts;
- suggestive wording;
- use the effect of binding;
- creating a need: 1) through information and curiosity, 2) through provocation of anxiety, 3) through entertainment tests,
- polls with a displaced goal.
To assess whether researchers have manipulated your opinion by providing the results of a questionnaire survey, you can ask them a few questions about the research procedure:
1. Ask to see the source code of the questionnaire and try to fill it in yourself before getting acquainted with the results (even better - before authorizing the study).
2. Imagine how your typical client or the employee fills out this form (will he understand all the terms and wording)?
3. Pay attention to the wording of questions and answer options: are there any negative options, do they occupy an equal place with positive options.
4. Please note if there are no suggestive formulations and “bindings” in the questionnaire.
5. Look at how unequivocally and specifically formulated the evaluation criteria in the questions of the questionnaire (are they provoking “mental savings” - neutral, or only positive answers). The best option is if the evaluation criteria are formulated in behavioral examples.
6. When analyzing the final report, pay attention to the questions on which the questionnaire draws conclusions: do not the researchers substitute for concepts, do they not give the opinions of respondents as facts.
7. If a foreign method is used (for example, from a well-known company), ask for references to publications describing the procedure for its translation, adaptation and validation. Without these procedures, the methodology cannot be considered an authoritative method of research, regardless of the status of its developer.
8. Request an exact distribution of survey participants by groups (gender, age, social status, or: departments, positions) to avoid bias (more on this in the previous article on sampling).
In the following articles:
Error 2. The wording of questions: why did you decide that you understand? (2 part)
Error 3. Types of lies in the polls: why do you believe the answers?
Mistake 4. Opinion is not equal to behavior: do you really ask what you want to know?
Error 5. Types of polls: do you need to know or confirm?
Error 6. Separate and saturate the sample: the average does not help to understand anything.
Error 7. The notorious “Net Promouter Score” is NOT an elegant solution.
Read the first article Questionnaire Errors. 1 error: sample offset. 8 ways to attract the right respondents
In this article I will explain why the problem of clarity of the questionnaire for survey participants is much more important than it seems at first glance. Consider also examples of the manipulation of respondents' opinions, falsification of survey results and the use of surveys for marketing purposes.
')
The advantage of questionnaires - large coverage and fast results - becomes their main disadvantage. Losing the possibility of communication with the final respondent, we are forced to make an expensive assumption: “all respondents understand the meaning of the questionnaire and fill it in correctly” . If you make this assumption, you can exhale and work with the results of the survey, as with relevant facts and opinions. And if such an assumption is not made, the study can turn into a series of rechecks and approvals and eventually become completely paralyzed.
To be honest, having gone through the difficulty of attracting respondents and returning questionnaires, the less that a researcher wants is to doubt that the questionnaires are filled in correctly. But it is even sadder to realize that the questionnaires are corrupted due to the participants' misunderstanding of instructions, or questions. And in order to protect oneself and the customer from these doubts, one can observe a number of preparatory stages, which significantly increase the credibility of the study. We will look at these stages in the next article. First, we will understand where the difficulties of understanding may lie, and what this may lead to.
We can single out at least the following parts of the questionnaire survey, where misunderstanding may arise:
1. Misunderstanding of words and special terms.
2. Misunderstanding of instructions.
3. Misunderstanding of the focus of the survey.
4. Misunderstanding of the wording of questions.
5. Misunderstanding of evaluation criteria.
1. Misunderstanding of words and special terms
Everything is simple here. Respondents, indeed, often do not understand the meaning of words that seem obvious to the researcher. And this is not always the case with professional slang. Sometimes, it would seem, ordinary Russian words cause difficulties for survey participants, but the experimenter rarely has the opportunity to learn about it.
In the picture: the user's comment to the questionnaire, published on the site (source: pikabu.ru)
Example: We conducted a study of people of different social status and different age groups. Among the research methods used test T. Leary - authoritative psychological test, adapted for the Russian-speaking respondents, used for decades to assess personality and relationships. Thousands of studies conducted in Russia using this test. Several hundred people have already taken part in our study when we came to interview students at a prestigious university. Students filled out questionnaires right in the audience. After a few minutes, they began to raise their hands and say that they did not understand the meaning of some words from the test. Here is a list of these words: soft-bodied, self-ignoring, despotic, conceited, docile, easily located, easily impaired, callous. For us, this was a revelation. It turned out that the adaptation of the classic authoritative test is already outdated for some respondents of this age and status. Hundreds of questionnaires from respondents of other ages and statuses collected by that time were also in doubt: people didn’t clarify the meanings of words in us, which means they either understood them or were embarrassed to ask and answered at random.
The second threat comes from the use of slang in questionnaires, which may either not be understood by the participants or annoy them. This can happen if the researcher tries to flirt with the target audience and uses their slang in the questionnaire, not being a carrier of this culture.
Example 2: When we investigated communication between departments in one IT company, several of its developers told the interview that they are very angry when HR managers, conducting internal surveys, or making mailings, copy language features and insert anglicisms. Although the developers themselves often sinned with this, they were annoyed when employees who were not included in the context of their work adopted this slang.
2. Misunderstanding of instructions
Failure to understand the instructions is the most obvious point in this article and seemingly useless. Almost all researchers clarify in the introduction to the questionnaire, what the research is aimed at, and how to fill in the form. Almost all respondents already have experience of participating in any polls, and now rarely hear the excited questions that we were asked about 8 years ago: “Do you need to put a plus sign in the box, or a tick?” And “You can cross out the answer if I change my mind ?
On the picture: Questionnaire with inaccurate instructions for applicants (source: pikabu.ru).
Despite the experience of the usual respondent, the questionnaire usability question again arises if the researcher tries new forms (for example, on-line surveys and questionnaires on mobile devices with non-obvious instructions or the inability to miss the answer), forgets the “one answer / multiple answer” option , or forgets to give correct instructions to complex questions (for example, questions with ranking, or pairwise comparison). And for the researcher great luck when it turns out to learn about the difficulties of the participant, as in the example in the picture below.
In the picture: the user's comment to the questionnaire, published on the site (source: pikabu.ru)
What seems obvious to the researcher and the majority of respondents may present difficulties for less experienced participants.
On the picture: Questionnaire with inaccurate instructions, not adapted for the survey participant (source: adme.ru).
Example 1: We conducted a study of employees of a company that has branches in small cities and towns. Representatives of the branches came to study in the capital, so it seemed like a good idea to interview them all after the training. We spoke to the staff, gave instructions and distributed questionnaires, promising to send the results by e-mail to each participant, or bring the next day. The questionnaire was quite large, people filled it in silence. As soon as the first participant gave the completed questionnaire, a woman rose at the end of the room and headed for the door. When we asked where her profile was, she replied: “I don’t understand what an email is and I don’t understand where you want to send me. I'd rather go. ” It turned out she stayed for more than half an hour, because she did not understand our words, but she was embarrassed to clarify the instructions. For us, this was a blatant case: we learned how large a misunderstanding of instruction could be. And with remote and on-line surveys, the researcher usually does not have an opportunity to understand what went wrong: the questionnaires either do not come back or are filled in incorrectly.
Example 2. Once we organized a large testing of people of different ages using psychological questionnaires, which included a scale of lies. According to the rules of such tests, it is forbidden to interpret the results if the lie indicator exceeds the established threshold. One of the participants received a critical score on the lie scale and, when we refused to analyze the results, was extremely surprised, saying that she always tries to tell the truth and certainly would not lie in the psychological test. We took it to sort out the answers, among which were, for example: “I always turn the road to the green light”, “I always tell the truth” and other obvious questions on social desirability. To all she replied "Yes." Then I asked:
- Well, and if you think about it, in your whole life you have definitely never crossed the road to red?
- It was, of course. But I tried to answer as I consider myself to behave, not how I lead. And so - in life it happens differently.
It turned out that a detailed and clear instruction to the test was nevertheless understood by a woman in her own way.
Example 3: During the study of behavioral styles in service relations among directors of enterprises, as always, we managed to attract much more women, there was a strong bias in the sample, and therefore we were very happy when we learned that several questionnaires from men, directors of large state organizations. We were ready to start processing the next day, but in the evening one of the directors called me. He cheerfully informed that he filled out our questionnaires with several directors and would like to receive explanations on some situations from the test, as they had disputes in the choice of answer options. It turned out that the directors, having come for advanced training, decided to combine communication and filling in an interesting test, and began filling out our application forms together in a hotel room, vigorously discussing each situation, arguing and convincing each other. Individual research of personal behaviors turned into group decision making, all the questionnaires were filled out equally and lost all value for our research.
3. Failure to understand the wording of questions
In creating a questionnaire, or planning an interview, there is one rule: “A question is almost the answer.” An informative answer can be obtained only with a very well thought out question. In order to create such questions, a lot of preparatory work is carried out (in the next part of the article I will talk about the stages of this preparation).
But our experience with researchers shows that almost no one pays attention to such training. Responsibility for the answer is often assigned to the respondent, a substantial assumption is made that the respondents have a stated opinion on our question and very much want to express it. Often this is a completely wrong assumption. Not only the problems of researchers, but the language of their questions are often not perceived by respondents.
In the picture: A still from the film “The Hitchhiker's Guide to the Galaxy”.
Wikipedia: “The Final Answer to the greatest question of Life, the Universe and All That” (...): “Forty-two”. The reaction was:
- Forty-two! - screamed Lunkkuol. “Is that all you can say after seven and a half million years of work?”
“I checked everything very carefully,” said the computer, “and with all certainty I declare that this is the answer.” It seems to me, if we are absolutely honest with you, the whole thing is that you yourself did not know what the question was.
- But this is a great question! The final question of life, the universe and all that! - almost howled Lunkkuol.
“Yes,” said the computer in the voice of a sufferer who enlightens the fool. “And what is this question?”
Example 1: A top manager of a manufacturing company once shared with me the idea of research. At that moment she was finishing her studies at the MBA and became interested in studying the motivation of workers in the workplace. The study of motivation is a difficult topic, we asked what methods it will use. “What methods are needed here? - she was surprised. “I’ll give them papers with the question“ What motivates you? ”And collect the answers.” Sorry, communication with her did not continue, and we did not know how the plant workers accepted her questionnaires and how she used the results of such a study.
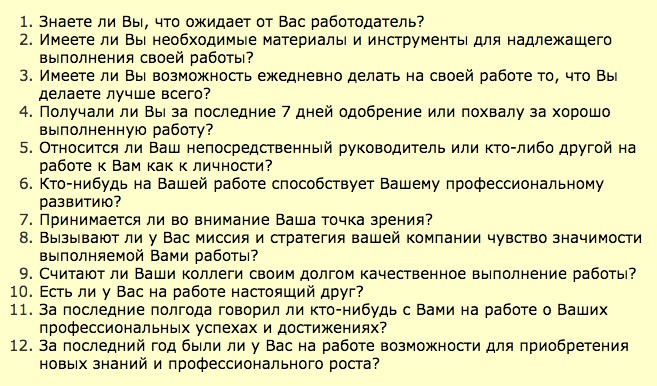
Example 2: The second example of the discrepancy between the language of research questionnaires and the language of the people who filled them out is also from production. The HR director of a large industrial holding company somehow boasted to us in a personal conversation that over several years he managed to increase staff involvement by 12% (!). Workers and middle management of factories are a specific research group. How did he study their involvement? It turned out a questionnaire from the company «Gallup».
Here it is necessary to clarify. The biggest disadvantage of using the questionnaire is not so much vague and unadapted for working-class people question wordings (for example, questions 5, 6, 8), but its use as a test with calculating the integral number indicator of engagement. In other words, even if the participants have a misunderstanding of the formulations of the questionnaire, the researcher will not analyze the answers separately, do not track the emissions, but calculate the total figure. The text of the questionnaire is shown in the picture.
On the picture: One of the variants of the Russian-language translation of the questionnaire of staff involvement from the company "Gallup" (Source: antropos.ru).
We were unable to find references to publications with adaptation and validation of the Gallup questionnaire (mandatory steps when using translation techniques). Nevertheless, one can find several options for his free translation, many recommendations for its use in business publications and even more offers from consulting companies that use 12 unvalidated and non-adapted questions as the only tool for measuring staff involvement.
Naturally, when a client sees in a report only generalized indicators of involvement and - even better - the growth of such indicators, he rarely asks about the methods by which they were obtained.
4. Misunderstanding of the focus of the survey
Failure to understand the direction of the question - a much more complicated and common mistake in the case studies. Sometimes it is impossible to assume how a person can interpret a seemingly unambiguously formulated question.
There is an elegant solution for this problem, which we will discuss in the next section. In the meantime, you can talk about cases where researchers deliberately hide the true meaning of the question, or confuse the language to get the desired answer.
The illusion of choice. In the practice of social manipulation there is such a move: providing the interlocutor with the illusion of choice, in which any of his answers will be beneficial to the manipulator. A classic example of the illusion of choosing from the sales of fast food chains: When a customer orders a coffee, the waiter asks: “Will you take a muffin or a cake for coffee?” (The question “Would you like something for coffee?” Is considered far less effective in terms of sales ). Such a move is often used in questionnaires when the study organizer is interested in certain answers.
Example: Several years ago, our company acted as the organizer of a corporate game for middle and top managers of a famous factory. Shortly before this, a controlling stake in this plant was bought by a German company, which immediately began implementing corporate standards of behavior. These standards in Russian represented a set of rules that were not quite correctly translated and not always clear for the Russian mentality, and we were given the task of organizing the game so that management would learn these standards. Only a few hours were allotted to the game, and we immediately explained that in such a time it was impossible to form behavioral patterns and one could not even develop acceptance and agreement with alien norms. We agreed that the goal of the game would be to reduce the emotional stress that the new standards were causing. So, we developed games and contests, which were based on interaction with each rule, focused on involvement, group work and positive emotions.
The game went well, all the leaders got involved and dispersed contentedly. A few days later, the company's HR department asked us to conduct a satisfaction survey with the game in order to provide a report to the management. We understood that the new rules were not adopted by the staff and, moreover, did not change into habits. But we have fulfilled our goal - to reduce stress. Therefore, our questionnaire was focused exclusively on positive emotions after the game (see figure).
In the picture: Fragment of the feedback form for participants in the game.
Questions 5, 6 and 9 are questions with the illusion of choice. They look pretty full. But, if you take a closer look, any answer option either reflects a positive assessment, or shifts the responsibility to the person filling out (according to the principle “this was not a bad game - I still do not understand the standards of behavior that have been explained to me for several months already”, or I understand the essence of the standards well ”).
The last question is a sample question with the illusion of choice. All his options are positive. When formulating it, we knew how the results would look in the report: how the charts will look at the positive effects that we set in advance in the questionnaire, and how pleasant it will be for the manager to look at them. When a person views such a report, he rarely has a question about whether negative responses were provided for in the questionnaire.
Placement of accents
If the customer of the study is not interested in the source text of the questionnaire and does not specify which options were provided to the participants, the organizers can replace the meaning of the results by placing accents.
Example: The recent publication of the results of a survey of public opinion among Russians provoked a heated discussion on the Internet (see figure). Basically, the discussion revolves around the term "satisfactory." And for our article, it is interesting how the survey results were transformed in the title of the article due to the word-play of the Russian language. The title reads “half of Russians satisfy the country's economy,” while the decoding of the article says that only 6% rated the economy positively. If only “significant” results were presented in the report and the option with a positive assessment was missed, then, thanks to the richness of the meanings of the language, the notion of “satisfying” would be perceived as a very good result of the survey (and not as an assessment of “three things”).
In the picture: a fragment of news about the results of the survey (source: www.solidarnost.org ).
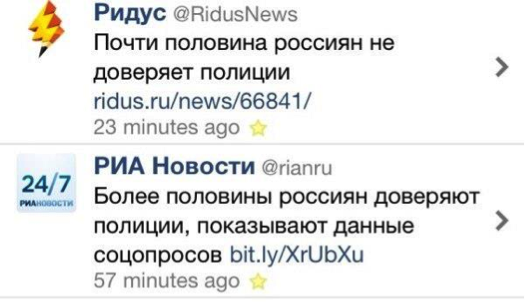
Example 2: Another fun example of accents. If you enter in the search engine the phrase “almost half of Russians do not trust the police,” links to sources vedomosti.ru, rbc.ru, echo.msk.ru, etc. are issued. And if you enter “almost half of Russians trust the police,” links to ria are issued. ru, news.sputnik.ru, www.business-gazeta.ru , ridus.ru (the last source - surprisingly, unlike the screenshot).
In the picture: a screenshot of the news feed - placement of accents in different editions (source: joyreactor.cc)
Substitution of concepts. In fact, the practice of protecting before the customer only the results of the study without first considering the raw data and methods of collecting them, leaves a huge field for falsifying data and manipulating the results without any falsification. In such cases, it is important to pay attention to the logic and direction of the questions in the questionnaire before analyzing its results.
Therefore, it is especially funny to look at the offers of training and consulting companies to independently assess the effect of staff training or implemented implementations, and to provide the customer with a report on the return on investment. In feedback questionnaires, contractors may not ask employees at all, but in the final report to replace concepts. But customers usually readily accept such reports, as they look quite authoritative, and do not require efforts from internal services.
Example: Recently we were presented with a company providing PR services. Presented, proudly explaining that this company is one of the few in the industry, giving a clear report on the KPI (key performance indicators) of its activities as a percentage. Indeed, it is not easy to assess the effectiveness of marketing and PR campaigns, to clear measurements from all the influencing market conditions. We are interested in the methodology. And when we asked how the measurement of the effectiveness of PR activities was carried out and the percentages were calculated, it turned out that a plan is used as a unit of measurement (for example, “write 10 articles in industry publications”), and the report is a calculation of the performance of this fee ( according to the logic of this company, if 9 articles are written, then KPI on PR are 90% complete). Of course, there is a division into process and actual KPIs and there are businesses where it is precisely the precise execution of the process that is important. But this does not apply to those areas where the process does not matter if the result is not achieved. And I have a suspicion that by providing the customer with a report on the effectiveness of the PR campaign in numerical terms, these contractors made a crude substitution of concepts.
Suggestive wording. The tonality of the question in the questionnaire, or its focus may lead the participant to a specific answer. The benefit of the research organizer from such answers is to confirm their own position (for example, when falsifying theories, or to justify management decisions).
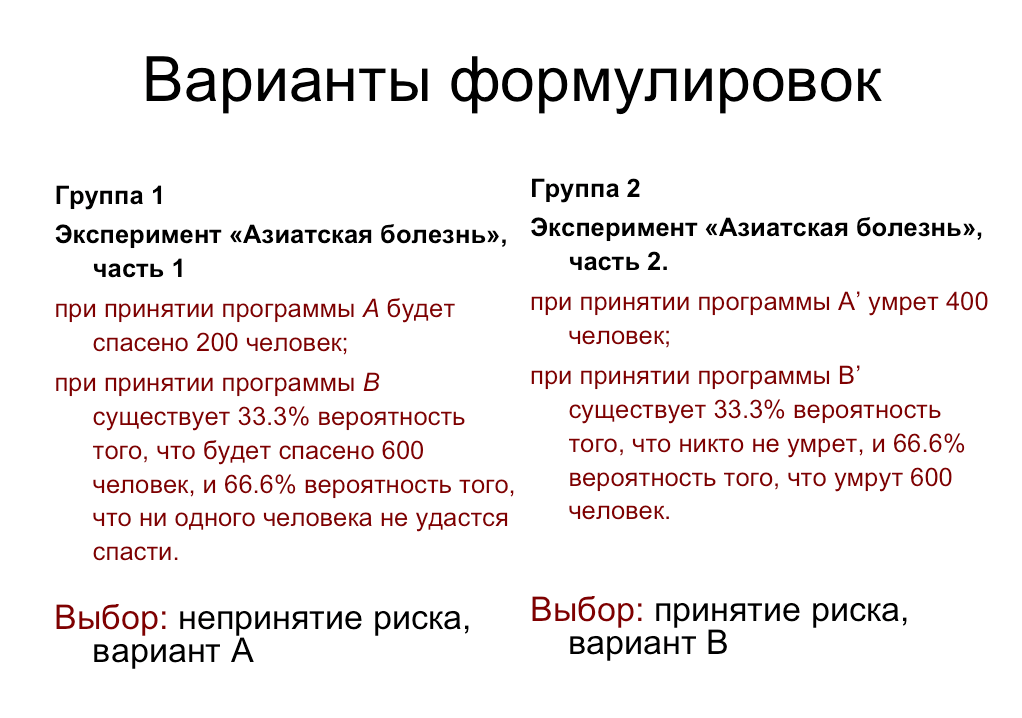
Example: This effect is well illustrated by the “Theory of Perspectives” by A. Tversky and D. Kahneman on saving intellectual costs (they received the Nobel Prize for researching the irrational nature of decisions made by people).
In one of the decision-making experiments, depending on the context of the information supplied, known as “Asian Disease”, participants were asked to solve the problem: “Imagine that the United States of America is preparing for an outbreak of an epidemic of an unknown“ Asian disease ”, due to which, as expected, 600 people will die. Two alternative programs have been proposed to combat this disease. Which one should I choose? ”Then, the same information was communicated to two different groups of participants, but in different formulations (with a positive and negative focus). The authors of the experiment proved that, in an effort to save effort when making decisions, people prefer to rely on intuition, past experience and more simple and optimistic options.
In the picture: The wording of the “programs” of the Asian Disease experiment and the preference of answers by participants.
Another common example from D. Kahneman’s research is to ask one group of subjects: “Did Gandhi live for 114 years? At what age did he die? ”And another:“ Did Gandhi live to 35 years? At what age did he die? ”, Then the first group will evaluate the life of Gandhi as much longer than the second.
Thus, by successfully formulating the questionnaire questions, focusing on positive options, or using suggestive numbers, the researchers create a “linking effect” and can manipulate the participants' responses.
The second option , in which the technique of suggestive language is used, is a gradual change in the beliefs of the research participant using a questionnaire. In this case, an outline is created from question to question, in which the respondent is forced to respond in a certain way, encounters his answers as with new ideas, and gradually changes his point of view. A continuation of this method are questions that create a need (see the next paragraph).
Example: Once I myself was the victim of a hard manipulative survey. It was conducted by a reputable organization, offering to pass on-line questioning to people from all over the world. The study was submitted under the guise of "Assess how well you eat." The beginning of the questionnaire was standard, questions were asked about different products, but gradually the questionnaire began to narrow down to filter questions about meat (do you eat meat, how many times a week, etc.). , , , . : «, , - ?» « , , , ?». : . , , « , ». . , , , - .
, . – . .
- « ?», « ?», : « N?». .
. – , (. ).
: , . : « , , – , , – , « »?». 10-13 , . (: Ridus.ru, RG.ru).
– , , () . , « ». , , , .
, :
a) the respondent is led to the idea that he does not have something, or something is used ineffectively (cause anxiety),
b) inform about new services (goods, options) that will help solve his problem (which he did not know before the survey begins).
Approximate algorithm of the questionnaire, creating the need:
1. Introductory neutral questions on the topic, “ice-breakers”.
2. Questions about the current status of the respondent, which gradually bring him to the idea that he is missing something or something is outdated.
3. Questions clarifying whether the respondent understands what the consequences of this shortage are and how it may turn back personally for him or his business.
four.Questions about whether the respondent is familiar with some solutions (goods, services, technologies).
5. Questions informing the respondent exactly how these decisions help to cope with his problem.
6. Questions suggesting purchase (informing about price, discount, conditions).
7. Questions confirming that with the purchase of this solution, the respondent’s problems will be resolved and he will receive additional benefits.
Example: If I wanted to sell this article using a questionnaire , , ( ). , , , . , - , - , , . , - . , , , , , , . , . , , , , -, , , , .
In this example, the “white threads” of sales are still clearly visible, but the closer your respondent is to client status (for example, he completes a questionnaire on the product site) and the closer he is to the purchase, the better he will accept such questionnaire and the easier it will be to increase the volume of its purchase due to additional sales.
Third option , , . - « ?» ( ), « ?» ( , ) .. , .
: «». « », , . , . , , .
- , , :
– , !
– , , : « , U. , , – . , – ».
, , .
.
: ( ).
. , , , , , .
: , . . ( ) . , , , . , , . , ( ), , . , «, , ». , , , . , , ( – , ).
5. Misunderstanding of evaluation criteria
Researchers do not always clarify assessment criteria, expecting them to be intuitive to participants.
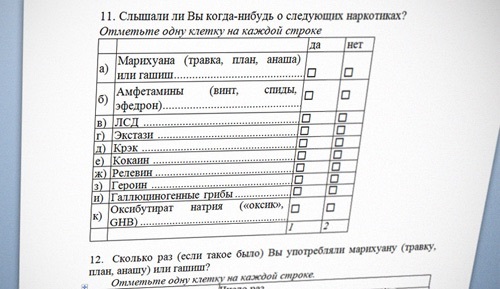
Example: Traditionally, out of dozens of questionnaires sent to me for examination, about 30% contain questions asking them to evaluate some parameter (service, product) from 1 to 5 points, but do not contain a decoding of values, or at least an indication of which pole is positive . Sometimes the whole study disappears if the organizers pay attention to diametric differences in the respondents' estimates and only then realize that some respondents put "1", suggesting that this is "first place" in the ranking, while others put "1" as the lowest score .
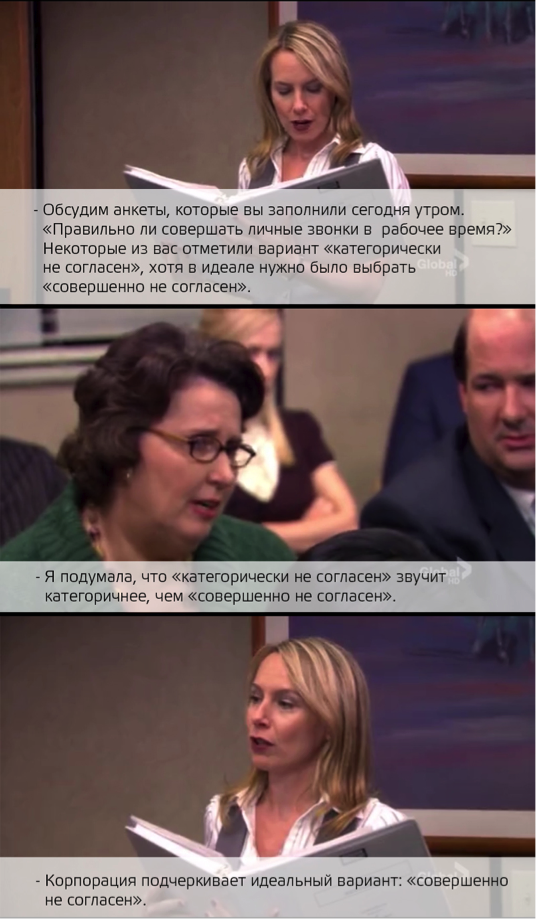
, (, ), (, « » « », «» « »). . , , , - . , - , (: « » — «…» — « »).
: , (: pikabu.ru)
, , - . « » , , (, « , , , 4 5 – , , »).
Such averages are often found when evaluating employees using the 360 degree method. When evaluating their colleagues, people tend to give positive scores to the “favorite” and neutral, or negative, scores to “unloved”, regardless of what parameter they are graded on (the unloved employee may be a strong leader, or not in conflict with anyone, but “hand will not rise "to give him high points even for these indicators). As a result, such an assessment turns out to be completely useless for the organizers of the study, since it does not make it possible to single out real problem points among the company's employees.
Similarly, the situation with the evaluation of user experience when working with IT products. If the site, or the company, in general, likes the user, he will be inclined to give, in general, high marks in order to “not offend anyone.” And such a survey will not help developers make the product better.
Example: , «». , . . , . , ( ) , . « ? !» – . , «», , , , , ., .
«» , ( – – ). , , , , .
: : « » ( ) – « , , ; , » ( ). , .
: « » 360 . , , , ( ).
– . , , ( ). , : « , », « , , ». , , , .
Brief conclusions
I tried to describe examples when the survey stages that are obvious to research organizers are misunderstood by the participants. Respondents may misunderstand words and phrases, the wording of questions, instructions to the questionnaire, evaluation criteria and the focus of questions. These difficulties lead to the collection of irrelevant information, or non-return of questionnaires.
We also considered examples where the confusion of respondents is provoked deliberately in order to manipulate the results of the survey. Among such manipulations:
- providing the illusion of choice;
- placement of accents;
- substitution of concepts;
- suggestive wording;
- use the effect of binding;
- creating a need: 1) through information and curiosity, 2) through provocation of anxiety, 3) through entertainment tests,
- polls with a displaced goal.
To assess whether researchers have manipulated your opinion by providing the results of a questionnaire survey, you can ask them a few questions about the research procedure:
1. Ask to see the source code of the questionnaire and try to fill it in yourself before getting acquainted with the results (even better - before authorizing the study).
2. Imagine how your typical client or the employee fills out this form (will he understand all the terms and wording)?
3. Pay attention to the wording of questions and answer options: are there any negative options, do they occupy an equal place with positive options.
4. Please note if there are no suggestive formulations and “bindings” in the questionnaire.
5. Look at how unequivocally and specifically formulated the evaluation criteria in the questions of the questionnaire (are they provoking “mental savings” - neutral, or only positive answers). The best option is if the evaluation criteria are formulated in behavioral examples.
6. When analyzing the final report, pay attention to the questions on which the questionnaire draws conclusions: do not the researchers substitute for concepts, do they not give the opinions of respondents as facts.
7. If a foreign method is used (for example, from a well-known company), ask for references to publications describing the procedure for its translation, adaptation and validation. Without these procedures, the methodology cannot be considered an authoritative method of research, regardless of the status of its developer.
8. Request an exact distribution of survey participants by groups (gender, age, social status, or: departments, positions) to avoid bias (more on this in the previous article on sampling).
In the following articles:
Error 2. The wording of questions: why did you decide that you understand? (2 part)
Error 3. Types of lies in the polls: why do you believe the answers?
Mistake 4. Opinion is not equal to behavior: do you really ask what you want to know?
Error 5. Types of polls: do you need to know or confirm?
Error 6. Separate and saturate the sample: the average does not help to understand anything.
Error 7. The notorious “Net Promouter Score” is NOT an elegant solution.
Source: https://habr.com/ru/post/308938/
All Articles