PHP function speed analysis tool
Recently, I paid attention to the materials on performance and speed measurements of PHP functions. After analyzing a number of materials, the following conclusion was made. There are quite a few comparisons, but all measurements are carried out with different input conditions, the output of test results is different for each solution, not to mention if there is a desire to test the tests in your environment, you will have to copy and paste pieces of code.
Therefore, the idea arose to write our own simple mechanism for testing the speed of various operations. The idea seemed interesting, so the start was made!
We should start by setting goals for the future tool. I wanted to see the project as a universal tool for testing the speed of anything. But after thinking over the detailsand mistakes of the past , it was decided to start small.
So, it was necessary to get a tool that:
')
To measure the execution time of the function, it was decided to use a similar, method
The principle of operation is simple, if a call occurs without parameters, then we return the current state of time, if the call occurs with the time parameter, then the difference between the current time and the transmitted time is returned.
But where there is the calculation of time, there is also the amount of memory consumed, so later a similar method of measuring consumed memory was added.
The mechanism is similar to the mechanics of time measurement, only in this case the value of the allocated memory is transferred to the script.
As you know, some functions behave differently depending on the input data set, therefore, in each test, an array of input data is defined for the testing functions. To obtain the most accurate results, functions are tested on each set several times. Among other things, testing is carried out in different sequences.
During the experiments, it was noted that the amount of free memory before each test is different, although for most tests it was insignificant, but for the order I would like to have conditions that are the same for all tests or close to those. Therefore, it was decided to store the results in the local SQLite repository, and before starting the tests, do one verification test for filling variables with data.
In order to be able to create your own options for presenting results and your own test options, 2 abstraction models have been created. Model test (Test), contains all the information about the test, including test functions. The DataViwer model contains methods for converting test results to a readable form. For convenient output of views, the Twig template engine was used and the bootstrap style library was connected, and a HighCharts viewer was also created.
As a result, the general mechanism of such work. The functions necessary for comparison are taken and run on execution with different data sets and in different sequences. When this occurs, the time of each execution is measured and the result is recorded in the repository. The test model (Test) is responsible for this stage. After all measurements, the results are transferred to the data view (DataViwer), where information is processed and output.
A simple example of the implementation of the test class, on the example of testing the speed of the operation before the increment and post increment.
The class must inherit the abstract class TestAbstract , which contains the basic mechanics of working with data streams.
$ name - sets the name of the test that can be used when outputting to the DataViewer.
$ valueTest is the sample size of the test, an array of values, with each of which a function will be executed for testing. Thus, each tested function must necessarily take one parameter. It will be a number, string or array is not important, it all depends on the specific case. In our example, there are enough numbers that will indicate the volume of operations performed with an increment.
$ qntTest - tells how many times each sample size will be tested.
$ viewers - an array of data views that will be generated when rendering a report. In fact, this is a set of fully qualified class names that inherit the abstract ViewrAbstract class. Pre-prepared viewers are rendered in TestCore class constants.
$ functions - an array of names of functions that will be used in testing. The keys of the array are the names that will be displayed in the results.
$ strategy is an array of testing strategies; each strategy must be represented by an array with a sequence of function names. In the example, 2 strategies are indicated - direct sequence and in reverse.
The functions themselves, which, as mentioned above, should take one value. In our example, we consider this the number of incremental series operations performed.
As a result, we get a series of tests where each testing strategy will be tested 5 times with each sample size ([100, 1000, 2000, 3000]).
Now let's take a closer look at a simple data presentation class.
The class implements the abstract class ViewerAbstract .
$ view - contains the name of the view, which by default should be in the folder / views / viewers
function generateData ($ data) is a method for processing an array of test results. The result will be transferred to the default data parameter in the specified view.
function run ($ data) is an optional method for the implementation, but if it is necessary to change the path to the data representation, then it should be redefined.
public static function model ($ class = __CLASS__) - method for supporting static method calls
To use the testing functionality, 2 main methods were created.
$ test - the full name of the test being run. They can be used as their test variants or in advance prepared.
$ params - an array of parameters to run the test. With this parameter you can point test parameters.
$ onlyData - the parameter responsible for displaying the result set or a rendered view.
Method of comparing user functions without creating additional classes
$ func is an array of anonymous functions, where the keys of the array are the names of the functions in the test results.
$ params - an array of test parameters, similar to the parameters of the test method.
$ onlyData is also similar to the test method parameter, and is responsible for the output option.
The easiest and fastest use case is to use a prepared test. All prepared tests are rendered into constants of the Speedy class.
To compare user-defined functions, you must create anonymous functions and call the Speedy :: compare method
Test results for the moment can be displayed by 4 views.
Tabular listing of all time measurements taken. In essence, this is the output of all records from the repository, without any transformations. The data set contains information about the name of the function being tested, the elapsed time, the sample size, the used memory size, the batch number in which the test and comment were performed. The comment indicates within which strategy the test of this function was performed.
Presentation in tabular form in the form of grouped data on the test batch (by the pass number of the strategy), i.e. in one line will be the results of testing functions that were carried out in the framework of a single strategy and in one test run.
The columns of the table will display data on the sample size, runtime, percentage of speed from the worst result, memory wasted, comment, and the name of the function that became the winner in time among the current pass. Separately, I would like to clarify the percentage column. This value is calculated as a percentage, by how much time the function outpaced the execution of the slowest function. If the value is not set, then this function is an outsider in the pass according to the execution time.
Presentation in tabular form in the form of averaged indicators for the sample size, i.e. in one line will be the average indicators of testing functions for one sample.
The columns provide information on the number of victories of the function in the sample, the average time percentage of victories, the name of the winning function. Functions winner is determined by the number of wins in the sample.
Representation in graphical form as a set of points, each of which corresponds to a time value and a sample size. This view is implemented using HighCharts charts.
To summarize it would be desirable that the goals have been achieved. But of course there is still work to do. The plans include working on exception handling, adding the ability to change the settings for a set of columns, as well as the ability to set your own column names, an increase in the number of tests. I would also like to add the ability to conveniently test the speed of working with databases.
The source code of the project can be viewed here.
PS : This project is being developed in the framework of personal interest in this topic and does not claim to be the best of its kind. I would be glad if someone likes and will be useful this work. Constructive criticism and advice are welcome.
Therefore, the idea arose to write our own simple mechanism for testing the speed of various operations. The idea seemed interesting, so the start was made!
Goals
We should start by setting goals for the future tool. I wanted to see the project as a universal tool for testing the speed of anything. But after thinking over the details
So, it was necessary to get a tool that:
')
- compares the speed of various functions
- has the ability to use pre-prepared tests
- displays the result in a readable form
- has the ability to create your own tests and options for presenting results
- can be easily used on other platforms
Measurement mechanism
To measure the execution time of the function, it was decided to use a similar, method
protected function getTime($time = false) { return $time === false? microtime(true) : microtime(true) - $time; } The principle of operation is simple, if a call occurs without parameters, then we return the current state of time, if the call occurs with the time parameter, then the difference between the current time and the transmitted time is returned.
But where there is the calculation of time, there is also the amount of memory consumed, so later a similar method of measuring consumed memory was added.
protected function getMemory($memory = false) { return $memory === false? memory_get_usage() : memory_get_usage() - $memory; } The mechanism is similar to the mechanics of time measurement, only in this case the value of the allocated memory is transferred to the script.
As you know, some functions behave differently depending on the input data set, therefore, in each test, an array of input data is defined for the testing functions. To obtain the most accurate results, functions are tested on each set several times. Among other things, testing is carried out in different sequences.
During the experiments, it was noted that the amount of free memory before each test is different, although for most tests it was insignificant, but for the order I would like to have conditions that are the same for all tests or close to those. Therefore, it was decided to store the results in the local SQLite repository, and before starting the tests, do one verification test for filling variables with data.
In order to be able to create your own options for presenting results and your own test options, 2 abstraction models have been created. Model test (Test), contains all the information about the test, including test functions. The DataViwer model contains methods for converting test results to a readable form. For convenient output of views, the Twig template engine was used and the bootstrap style library was connected, and a HighCharts viewer was also created.
As a result, the general mechanism of such work. The functions necessary for comparison are taken and run on execution with different data sets and in different sequences. When this occurs, the time of each execution is measured and the result is recorded in the repository. The test model (Test) is responsible for this stage. After all measurements, the results are transferred to the data view (DataViwer), where information is processed and output.
Implementation of testing
Test class
A simple example of the implementation of the test class, on the example of testing the speed of the operation before the increment and post increment.
Test class example
class IncPrefVsPos extends TestAbstract { public $name = 'Speedy ++i vs i++'; public $valueTest = [100, 1000, 2000, 3000]; public $qntTest = 5; public $viewers = [TestCore::VIEWER_TLIST, TestCore::VIEWER_TGROUP, TestCore::VIEWER_TAVG, TestCore::VIEWER_GBUBLE]; public $functions = ['postIncrement' => 'testPost', 'prefIncrement' => 'testPref']; protected $strategy = [['testPost', 'testPref'], ['testPref', 'testPost']]; public function testPref($size) { $testCounter = 0; for($i=0;$i<$size;$i++) { ++$testCounter; ++$testCounter; ++$testCounter; ++$testCounter; ++$testCounter; ++$testCounter; ++$testCounter; ++$testCounter; ++$testCounter; ++$testCounter; ++$testCounter; ++$testCounter; ++$testCounter; ++$testCounter; ++$testCounter; ++$testCounter; ++$testCounter; ++$testCounter; ++$testCounter; ++$testCounter; ++$testCounter; ++$testCounter; ++$testCounter; ++$testCounter; } } public function testPost($size) { $testCounter = 0; for($i=0;$i<$size;$i++) { $testCounter++; $testCounter++; $testCounter++; $testCounter++; $testCounter++; $testCounter++; $testCounter++; $testCounter++; $testCounter++; $testCounter++; $testCounter++; $testCounter++; $testCounter++; $testCounter++; $testCounter++; $testCounter++; $testCounter++; $testCounter++; $testCounter++; $testCounter++; $testCounter++; $testCounter++; $testCounter++; $testCounter++; } } } The class must inherit the abstract class TestAbstract , which contains the basic mechanics of working with data streams.
$ name - sets the name of the test that can be used when outputting to the DataViewer.
$ valueTest is the sample size of the test, an array of values, with each of which a function will be executed for testing. Thus, each tested function must necessarily take one parameter. It will be a number, string or array is not important, it all depends on the specific case. In our example, there are enough numbers that will indicate the volume of operations performed with an increment.
$ qntTest - tells how many times each sample size will be tested.
$ viewers - an array of data views that will be generated when rendering a report. In fact, this is a set of fully qualified class names that inherit the abstract ViewrAbstract class. Pre-prepared viewers are rendered in TestCore class constants.
$ functions - an array of names of functions that will be used in testing. The keys of the array are the names that will be displayed in the results.
$ strategy is an array of testing strategies; each strategy must be represented by an array with a sequence of function names. In the example, 2 strategies are indicated - direct sequence and in reverse.
The functions themselves, which, as mentioned above, should take one value. In our example, we consider this the number of incremental series operations performed.
As a result, we get a series of tests where each testing strategy will be tested 5 times with each sample size ([100, 1000, 2000, 3000]).
Presentation class
Now let's take a closer look at a simple data presentation class.
View class example
class TableList extends ViewerAbstract { public $view = 'tableList.php'; public function generateData($data){ return $data; } public function run($data) { $data = $this->generateData($data); return App::render('/viewer/'.$this->view, compact('data')); } public static function model($class = __CLASS__) { return parent::model($class); } } The class implements the abstract class ViewerAbstract .
$ view - contains the name of the view, which by default should be in the folder / views / viewers
function generateData ($ data) is a method for processing an array of test results. The result will be transferred to the default data parameter in the specified view.
function run ($ data) is an optional method for the implementation, but if it is necessary to change the path to the data representation, then it should be redefined.
public static function model ($ class = __CLASS__) - method for supporting static method calls
Use cases
To use the testing functionality, 2 main methods were created.
Test run method
function test($test, $params = [], $onlyData = false) $ test - the full name of the test being run. They can be used as their test variants or in advance prepared.
$ params - an array of parameters to run the test. With this parameter you can point test parameters.
$ onlyData - the parameter responsible for displaying the result set or a rendered view.
Function comparison method
Method of comparing user functions without creating additional classes
function compare($func = [], $params = [], $onlyData = false) $ func is an array of anonymous functions, where the keys of the array are the names of the functions in the test results.
$ params - an array of test parameters, similar to the parameters of the test method.
$ onlyData is also similar to the test method parameter, and is responsible for the output option.
Work examples
The easiest and fastest use case is to use a prepared test. All prepared tests are rendered into constants of the Speedy class.
print Speedy::test(Speedy::PHP_SOF_VS_COUNT); To compare user-defined functions, you must create anonymous functions and call the Speedy :: compare method
Function comparison example
$pref = function($size) { $testCounter = 0; for($i=0;$i<$size;$i++) { ++$testCounter; ++$testCounter; ++$testCounter; ++$testCounter; ++$testCounter; ++$testCounter; ++$testCounter; ++$testCounter; ++$testCounter; ++$testCounter; ++$testCounter; ++$testCounter; ++$testCounter; ++$testCounter; ++$testCounter; ++$testCounter; ++$testCounter; ++$testCounter; ++$testCounter; ++$testCounter; ++$testCounter; ++$testCounter; ++$testCounter; ++$testCounter; } }; $post = function($size) { $testCounter = 0; for($i=0;$i<$size;$i++) { $testCounter++; $testCounter++; $testCounter++; $testCounter++; $testCounter++; $testCounter++; $testCounter++; $testCounter++; $testCounter++; $testCounter++; $testCounter++; $testCounter++; $testCounter++; $testCounter++; $testCounter++; $testCounter++; $testCounter++; $testCounter++; $testCounter++; $testCounter++; $testCounter++; $testCounter++; $testCounter++; $testCounter++; } }; print \speedy\Speedy::compare(['pref' => $pref, 'post' => $post]); Test results
Test results for the moment can be displayed by 4 views.
VIEWER_TLIST
Tabular listing of all time measurements taken. In essence, this is the output of all records from the repository, without any transformations. The data set contains information about the name of the function being tested, the elapsed time, the sample size, the used memory size, the batch number in which the test and comment were performed. The comment indicates within which strategy the test of this function was performed.
Example of displaying the results in a list in tabular form
The result of testing increment operators.
| name | time | size | memory | part | comment |
| postInc | 0.000650882720947 | 100 | 48 | 2 | postInc-prefInc |
| prefInc | 0.000411987304688 | 100 | 48 | 2 | postInc-prefInc |
| prefInc | 0.000406980514526 | 100 | 48 | 3 | prefInc-postInc |
| postInc | 0.000549077987671 | 100 | 48 | 3 | prefInc-postInc |
| postInc | 0.000330924987793 | 100 | 48 | five | postInc-prefInc |
| prefInc | 0.000287055969238 | 100 | 48 | five | postInc-prefInc |
| prefInc | 0.00043797492981 | 100 | 48 | 6 | prefInc-postInc |
| postInc | 0.000365018844604 | 100 | 48 | 6 | prefInc-postInc |
| postInc | 0.000295162200928 | 100 | 48 | eight | postInc-prefInc |
| prefInc | 0.000373125076294 | 100 | 48 | eight | postInc-prefInc |
| prefInc | 0.000263929367065 | 100 | 48 | 9 | prefInc-postInc |
| postInc | 0.000449895858765 | 100 | 48 | 9 | prefInc-postInc |
| postInc | 0.00030517578125 | 100 | 48 | eleven | postInc-prefInc |
| prefInc | 0.000247955322266 | 100 | 48 | eleven | postInc-prefInc |
| prefInc | 0.000244140625 | 100 | 48 | 12 | prefInc-postInc |
| postInc | 0.000265121459961 | 100 | 48 | 12 | prefInc-postInc |
| postInc | 0.000267028808594 | 100 | 48 | 14 | postInc-prefInc |
| prefInc | 0.000245094299316 | 100 | 48 | 14 | postInc-prefInc |
| prefInc | 0.000285148620605 | 100 | 48 | 15 | prefInc-postInc |
| postInc | 0.000273942947388 | 100 | 48 | 15 | prefInc-postInc |
| postInc | 0.00273203849792 | 1000 | 48 | 17 | postInc-prefInc |
| prefInc | 0.00240206718445 | 1000 | 48 | 17 | postInc-prefInc |
| prefInc | 0.00274896621704 | 1000 | 48 | 18 | prefInc-postInc |
| postInc | 0.00259804725647 | 1000 | 48 | 18 | prefInc-postInc |
| postInc | 0.00391817092896 | 1000 | 48 | 20 | postInc-prefInc |
| prefInc | 0.00303602218628 | 1000 | 48 | 20 | postInc-prefInc |
| prefInc | 0.00229096412659 | 1000 | 48 | 21 | prefInc-postInc |
| postInc | 0.00281691551208 | 1000 | 48 | 21 | prefInc-postInc |
| postInc | 0.00273108482361 | 1000 | 48 | 23 | postInc-prefInc |
| prefInc | 0.00221014022827 | 1000 | 48 | 23 | postInc-prefInc |
| prefInc | 0.00266814231873 | 1000 | 48 | 24 | prefInc-postInc |
| postInc | 0.00307106971741 | 1000 | 48 | 24 | prefInc-postInc |
| postInc | 0.00283098220825 | 1000 | 48 | 26 | postInc-prefInc |
| prefInc | 0.00239992141724 | 1000 | 48 | 26 | postInc-prefInc |
| prefInc | 0.00246214866638 | 1000 | 48 | 27 | prefInc-postInc |
| postInc | 0.00273704528809 | 1000 | 48 | 27 | prefInc-postInc |
| postInc | 0.00283288955688 | 1000 | 48 | 29 | postInc-prefInc |
| prefInc | 0.00229215621948 | 1000 | 48 | 29 | postInc-prefInc |
| prefInc | 0.00220608711243 | 1000 | 48 | thirty | prefInc-postInc |
| postInc | 0.0028657913208 | 1000 | 48 | thirty | prefInc-postInc |
| postInc | 0.00557017326355 | 2000 | 48 | 32 | postInc-prefInc |
| prefInc | 0.0048840045929 | 2000 | 48 | 32 | postInc-prefInc |
| prefInc | 0.00449013710022 | 2000 | 48 | 33 | prefInc-postInc |
| postInc | 0.0064799785614 | 2000 | 48 | 33 | prefInc-postInc |
| postInc | 0.00543594360352 | 2000 | 48 | 35 | postInc-prefInc |
| prefInc | 0.00509881973267 | 2000 | 48 | 35 | postInc-prefInc |
| prefInc | 0.00483298301697 | 2000 | 48 | 36 | prefInc-postInc |
| postInc | 0.00555992126465 | 2000 | 48 | 36 | prefInc-postInc |
| postInc | 0.00516104698181 | 2000 | 48 | 38 | postInc-prefInc |
| prefInc | 0.00512599945068 | 2000 | 48 | 38 | postInc-prefInc |
| prefInc | 0.00484395027161 | 2000 | 48 | 39 | prefInc-postInc |
| postInc | 0.00530505180359 | 2000 | 48 | 39 | prefInc-postInc |
| postInc | 0.00509691238403 | 2000 | 48 | 41 | postInc-prefInc |
| prefInc | 0.00525093078613 | 2000 | 48 | 41 | postInc-prefInc |
| prefInc | 0.00447416305542 | 2000 | 48 | 42 | prefInc-postInc |
| postInc | 0.00536584854126 | 2000 | 48 | 42 | prefInc-postInc |
| postInc | 0.0054669380188 | 2000 | 48 | 44 | postInc-prefInc |
| prefInc | 0.00468182563782 | 2000 | 48 | 44 | postInc-prefInc |
| prefInc | 0.00512504577637 | 2000 | 48 | 45 | prefInc-postInc |
| postInc | 0.00545692443848 | 2000 | 48 | 45 | prefInc-postInc |
| postInc | 0.00782418251038 | 3000 | 48 | 47 | postInc-prefInc |
| prefInc | 0.00726389884949 | 3000 | 48 | 47 | postInc-prefInc |
| prefInc | 0.00674796104431 | 3000 | 48 | 48 | prefInc-postInc |
| postInc | 0.007483959198 | 3000 | 48 | 48 | prefInc-postInc |
| postInc | 0.00781297683716 | 3000 | 48 | 50 | postInc-prefInc |
| prefInc | 0.0069580078125 | 3000 | 48 | 50 | postInc-prefInc |
| prefInc | 0.00711393356323 | 3000 | 48 | 51 | prefInc-postInc |
| postInc | 0.0072808265686 | 3000 | 48 | 51 | prefInc-postInc |
| postInc | 0.00790119171143 | 3000 | 48 | 53 | postInc-prefInc |
| prefInc | 0.00662994384766 | 3000 | 48 | 53 | postInc-prefInc |
| prefInc | 0.00825595855713 | 3000 | 48 | 54 | prefInc-postInc |
| postInc | 0.00739097595215 | 3000 | 48 | 54 | prefInc-postInc |
| postInc | 0.00811100006104 | 3000 | 48 | 56 | postInc-prefInc |
| prefInc | 0.00712990760803 | 3000 | 48 | 56 | postInc-prefInc |
| prefInc | 0.00698399543762 | 3000 | 48 | 57 | prefInc-postInc |
| postInc | 0.00758218765259 | 3000 | 48 | 57 | prefInc-postInc |
| postInc | 0.00795316696167 | 3000 | 48 | 59 | postInc-prefInc |
| prefInc | 0.00725698471069 | 3000 | 48 | 59 | postInc-prefInc |
| prefInc | 0.00684094429016 | 3000 | 48 | 60 | prefInc-postInc |
| postInc | 0.00778198242188 | 3000 | 48 | 60 | prefInc-postInc |
VIEWER_TGROUP
Presentation in tabular form in the form of grouped data on the test batch (by the pass number of the strategy), i.e. in one line will be the results of testing functions that were carried out in the framework of a single strategy and in one test run.
The columns of the table will display data on the sample size, runtime, percentage of speed from the worst result, memory wasted, comment, and the name of the function that became the winner in time among the current pass. Separately, I would like to clarify the percentage column. This value is calculated as a percentage, by how much time the function outpaced the execution of the slowest function. If the value is not set, then this function is an outsider in the pass according to the execution time.
Example of output of grouped results in tabular form
The result of testing increment operators.
| size | postInc | prefInc | comment | time win | ||||
| time | % | memory | time | % | memory | |||
| 100 | 0.000650882720947 | 48 | 0.000411987304688 | 36.7 | 48 | postInc-prefInc | prefInc | |
| 100 | 0.000549077987671 | 48 | 0.000406980514526 | 25.88 | 48 | prefInc-postInc | prefInc | |
| 100 | 0.000330924987793 | 48 | 0.000287055969238 | 13.26 | 48 | postInc-prefInc | prefInc | |
| 100 | 0.000365018844604 | 16.66 | 48 | 0.00043797492981 | 48 | prefInc-postInc | postInc | |
| 100 | 0.000295162200928 | 20.89 | 48 | 0.000373125076294 | 48 | postInc-prefInc | postInc | |
| 100 | 0.000449895858765 | 48 | 0.000263929367065 | 41.34 | 48 | prefInc-postInc | prefInc | |
| 100 | 0.00030517578125 | 48 | 0.000247955322266 | 18.75 | 48 | postInc-prefInc | prefInc | |
| 100 | 0.000265121459961 | 48 | 0.000244140625 | 7.91 | 48 | prefInc-postInc | prefInc | |
| 100 | 0.000267028808594 | 48 | 0.000245094299316 | 8.21 | 48 | postInc-prefInc | prefInc | |
| 100 | 0.000273942947388 | 3.93 | 48 | 0.000285148620605 | 48 | prefInc-postInc | postInc | |
| 1000 | 0.00273203849792 | 48 | 0.00240206718445 | 12.08 | 48 | postInc-prefInc | prefInc | |
| 1000 | 0.00259804725647 | 5.49 | 48 | 0.00274896621704 | 48 | prefInc-postInc | postInc | |
| 1000 | 0.00391817092896 | 48 | 0.00303602218628 | 22.51 | 48 | postInc-prefInc | prefInc | |
| 1000 | 0.00281691551208 | 48 | 0.00229096412659 | 18.67 | 48 | prefInc-postInc | prefInc | |
| 1000 | 0.00273108482361 | 48 | 0.00221014022827 | 19.07 | 48 | postInc-prefInc | prefInc | |
| 1000 | 0.00307106971741 | 48 | 0.00266814231873 | 13.12 | 48 | prefInc-postInc | prefInc | |
| 1000 | 0.00283098220825 | 48 | 0.00239992141724 | 15.23 | 48 | postInc-prefInc | prefInc | |
| 1000 | 0.00273704528809 | 48 | 0.00246214866638 | 10.04 | 48 | prefInc-postInc | prefInc | |
| 1000 | 0.00283288955688 | 48 | 0.00229215621948 | 19.09 | 48 | postInc-prefInc | prefInc | |
| 1000 | 0.0028657913208 | 48 | 0.00220608711243 | 23.02 | 48 | prefInc-postInc | prefInc | |
| 2000 | 0.00557017326355 | 48 | 0.0048840045929 | 12.32 | 48 | postInc-prefInc | prefInc | |
| 2000 | 0.0064799785614 | 48 | 0.00449013710022 | 30.71 | 48 | prefInc-postInc | prefInc | |
| 2000 | 0.00543594360352 | 48 | 0.00509881973267 | 6.2 | 48 | postInc-prefInc | prefInc | |
| 2000 | 0.00555992126465 | 48 | 0.00483298301697 | 13.07 | 48 | prefInc-postInc | prefInc | |
| 2000 | 0.00516104698181 | 48 | 0.00512599945068 | 0.68 | 48 | postInc-prefInc | prefInc | |
| 2000 | 0.00530505180359 | 48 | 0.00484395027161 | 8.69 | 48 | prefInc-postInc | prefInc | |
| 2000 | 0.00509691238403 | 2.93 | 48 | 0.00525093078613 | 48 | postInc-prefInc | postInc | |
| 2000 | 0.00536584854126 | 48 | 0.00447416305542 | 16.62 | 48 | prefInc-postInc | prefInc | |
| 2000 | 0.0054669380188 | 48 | 0.00468182563782 | 14.36 | 48 | postInc-prefInc | prefInc | |
| 2000 | 0.00545692443848 | 48 | 0.00512504577637 | 6.08 | 48 | prefInc-postInc | prefInc | |
| 3000 | 0.00782418251038 | 48 | 0.00726389884949 | 7.16 | 48 | postInc-prefInc | prefInc | |
| 3000 | 0.007483959198 | 48 | 0.00674796104431 | 9.83 | 48 | prefInc-postInc | prefInc | |
| 3000 | 0.00781297683716 | 48 | 0.0069580078125 | 10.94 | 48 | postInc-prefInc | prefInc | |
| 3000 | 0.0072808265686 | 48 | 0.00711393356323 | 2.29 | 48 | prefInc-postInc | prefInc | |
| 3000 | 0.00790119171143 | 48 | 0.00662994384766 | 16.09 | 48 | postInc-prefInc | prefInc | |
| 3000 | 0.00739097595215 | 10.48 | 48 | 0.00825595855713 | 48 | prefInc-postInc | postInc | |
| 3000 | 0.00811100006104 | 48 | 0.00712990760803 | 12.1 | 48 | postInc-prefInc | prefInc | |
| 3000 | 0.00758218765259 | 48 | 0.00698399543762 | 7.89 | 48 | prefInc-postInc | prefInc | |
| 3000 | 0.00795316696167 | 48 | 0.00725698471069 | 8.75 | 48 | postInc-prefInc | prefInc | |
| 3000 | 0.00778198242188 | 48 | 0.00684094429016 | 12.09 | 48 | prefInc-postInc | prefInc | |
VIEWER_TAVG
Presentation in tabular form in the form of averaged indicators for the sample size, i.e. in one line will be the average indicators of testing functions for one sample.
The columns provide information on the number of victories of the function in the sample, the average time percentage of victories, the name of the winning function. Functions winner is determined by the number of wins in the sample.
An example of the output of averaged results in tabular form
The result of testing increment operators.
| size | postInc | prefInc | winner | ||
| winns | % | winns | % | ||
| 100 | 3 | 13.83 | 7 | 21.72 | prefInc |
| 1000 | one | 5.49 | 9 | 16.98 | prefInc |
| 2000 | one | 2.93 | 9 | 12.08 | prefInc |
| 3000 | one | 10.48 | 9 | 9.68 | prefInc |
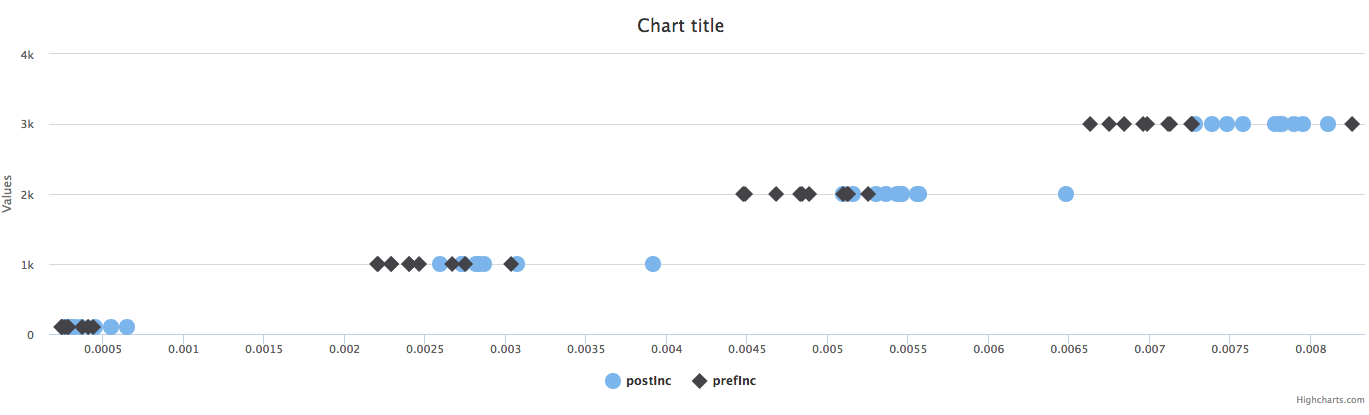
VIEWER_GBUBLE
Representation in graphical form as a set of points, each of which corresponds to a time value and a sample size. This view is implemented using HighCharts charts.
An example of displaying the results in graphical form
The result of testing increment operators.
Results
To summarize it would be desirable that the goals have been achieved. But of course there is still work to do. The plans include working on exception handling, adding the ability to change the settings for a set of columns, as well as the ability to set your own column names, an increase in the number of tests. I would also like to add the ability to conveniently test the speed of working with databases.
The source code of the project can be viewed here.
PS : This project is being developed in the framework of personal interest in this topic and does not claim to be the best of its kind. I would be glad if someone likes and will be useful this work. Constructive criticism and advice are welcome.
Source: https://habr.com/ru/post/308654/
All Articles