Math on the fingers: let's count at least one row of Fourier in the mind
Do you need to read this text?
Let's check. Read the following:
Trigonometric Fourier Series Functions called the functional series of the form
')
Where


Terrible, but still want to understand what it means?
Means, to you under kat. I will try not to use formulas.
Motivation
It is my deep conviction that mathematics can be approached on two levels: most people see it (they are taught that way) as a set of icons and rules for operations with icons, which leads to the masses of people who are traumatized by mathematics. And you can try to convey the meaning and ideas, not really focusing on the icons. Personally, I am incapable of a syntactic approach; I will surely lose some minus in a chain of two formulas, which does not prevent me from being quite successfully considered a mathematician. Just in my head graphic accelerator.
I have already cited Feynman's quotation about how exactly he read all the equations, what he had to do:
Actually, there was a certain amount. I had a scheme, which I am today
something that i'm trying to understand: i keep making up examples. For instance, the mathematicians would come in with a terrific theorem, and they're all excited. I construct something which fits all the conditions. You know, you have a set (one ball) - disjoint (two balls). There are more conditions on. Finally, I’m saying, “False!”
And while preparing this text, I came across a remarkable report by Henri Poincaré, who, perhaps, was the greatest mathematician of the late nineteenth and early twentieth century. He pointed out that even in such an abstract science as mathematics, it is necessary to cultivate intuitive concepts, for example, the concept of straightness, although intuition should be verified by formal proofs.
His report is entitled “Du rôle de l'intuition et de la logique en mathématiques”, in French you can read here , an English translation is available here . I highly recommend interested in mathematics, read in one breath.
Update: Here lies the Russian translation.
Unfortunately, it is very difficult to transmit intuition, but I will try, since the benefit from the transmitted intuition is incomparably higher from the benefit of transmitting just icons.
What I rely on in this text
First of all, you need to know what a vector is, at least at the “arrow” level. Well, imagine that the arrows can be drawn in a significantly larger number of dimensions than 2 or 3. So what can be stored in a vector std :: vector.
Then the central concept is scalar product.
On the fingers, the scalar product can be represented as a measure of how much one vector looks like another. That is, it is an operation that takes two vectors as input, gives a number to the output. Data normalization is details that are not very necessary yet. Therefore, if I have two arrows of unit length, then the scalar product is equal to one, if the arrows are the same, zero if they are orthogonal and minus one if they are oppositely directed.
Lyrical digression
This is not just a lyric, this is an example that at first glance is not related to the topic of the conversation, but in fact is its essence. Want to understand further - understand the example. What is unclear, ask questions.
Let's take a moment to consider an extremely practical task: I have a leisurely robot, and he should know where he is. The navigation system must be passive. I love extremely oak solutions, so I put two microphones on my robot (like human ears). Then I have a beacon (actually several, but let's about one), which loses some (mono) sound in the loop. For example, like this:

These are just dry clicks; let us set one click per second for simplicity.
The “ears” of the robot are at different distances from the lighthouse, and the sound propagates slowly, so each of the two microphones will record the same signal, plus or minus, but with a slight delay one relative to the other. I am not looking for easy ways, so I do not have laboratory conditions. Here, for example, what a record looks like in a few seconds:
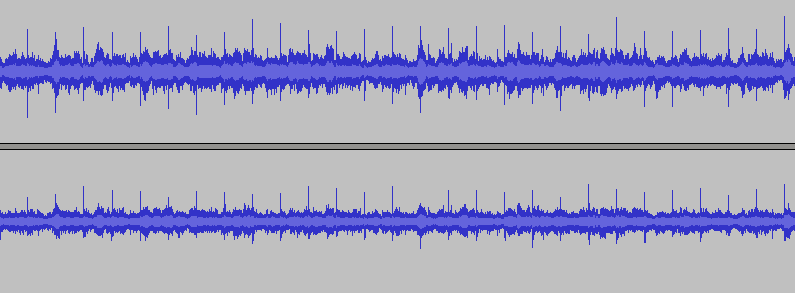
Two channels by the number of ears, high noise (music plays). The recording shows regular bursts of dry clicks, but it’s extremely difficult to directly search for them in the signal, sometimes the music is even louder than clicks.
How do I remove background noise? I remind you that my robot is completely unhurried. The most oaky way is to record an hour of sound, then cut it into 3,600 pieces per second (I have one click per second), and take the average between all these pieces of recording.
It turns out something like this:
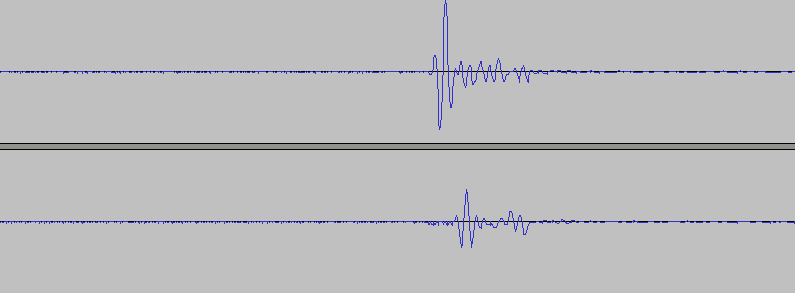
The peaks of clicks occur in each of the 3,600 pieces at the same place, and the rest of the noise is smeared more or less evenly along the entire length, as a result the noise goes away. By the way, I have several lighthouses, no synchronization between them, and only two ears. And this is how I divide the signals from the beacons: one beacon clicks three times a second, another five, the third seven. (Very important) By cutting the same signal into 1/3, 1/5, or 1/7 second pieces, I get the signal from the right beacon!
So, now I need to understand how one signal is shifted relative to another. I don’t really care at exactly where I’m recording at the peak, I need to shift one channel relative to another.
First, let's understand how I can even imagine this signal in the memory of the machine. I write the usual wav with a sampling frequency of 44100Hz. The record length is one second, so I have just two arrays (vectors!) Of real numbers with 44,100 elements.
We fix one vector, and the second 44100 times cyclically shift to the right. (Very important) Let's calculate 44100 scalar products and take the shift at which this scalar product is maximal. That is, it is this shift that maximizes the similarity of the two signals. Congratulations, you have just considered the cross-correlation function!
Update: nice comment with illustration.
And now let's count the Fourier series in the mind.
The previous section is very important, but for now let's put it aside and try to count on the fingers a simple Fourier series.
As an example, let's take a simple square signal, so beloved in electronics. The graphics I draw in sage .
def square_wave(t): return (sgn(sin(t))+1)/2 t = var('t') plot(square_wave(t), (t, -10*pi, 10*pi),figsize=(10,2)) 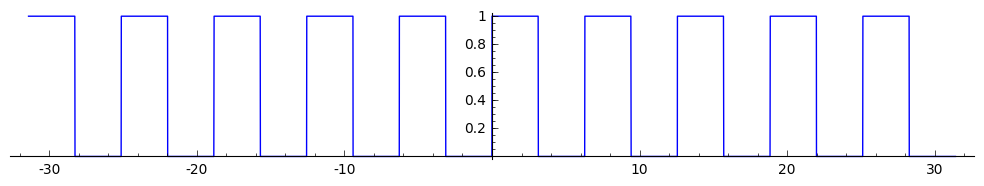
This is a simple periodic signal with a period of 2 pi. Half the time it is zero, half the time is one. Let's take the coefficients of the Fourier series (see the beginning of the article).
Zero frequency
The coefficient a0 is just the average of the signal, it is obvious that it is equal to half. How to count a1 and b1?
First frequency
And here I propose to draw one period of our signal, but this time not in the usual Cartesian coordinate system, but in the polar one. In total, our angle goes from zero to two pi, and we get the following picture:
parametric_plot((cos(t)*square_wave(t), sin(t)*square_wave(t)), (t, 0, 2*pi)) 
Why in the polar system? Very simple. How are the polar coordinates of a point (r, alpha) converted to Cartesian?
x = r cos (alpha)
y = r sin (alpha).
And what we have under the sign of the integral in the formula for a1 and b1? That's right, f sin (t) and f cos (t). It remains to integrate. How to do it in the mind? Imagine that you have this is not a mathematical graph, and a piece of wire. Let's find its center of gravity. Obviously, it will lie on the ordinate axis approximately at the center of our arc (in fact, at a distance of 2 / pi from the center, well, yes, this is not the essence, let's call this distance A):
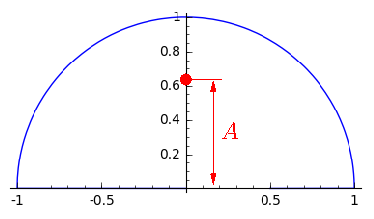
The coordinates of the red point (the center of gravity of the graph) are the integrals we need (up to multiplication by a constant, but that’s not the point). By the way, can you say why?
Total a1 = 0, b1 = A.
Second frequency
What up to a2 and b2? Let's do the polar graph again, winding up our usual graph around zero. The only thing that now we will wind, making two turns.
First turn:
parametric_plot((cos(2*t)*square_wave(t), sin(2*t)*square_wave(t)), (t, 0, pi)) 
parametric_plot((cos(2*t)*square_wave(t), sin(2*t)*square_wave(t)), (t, pi, 2*pi)) The second turn will obviously be empty, our square signal at this moment is zero:

The center of mass of the first + second graphs obviously lies at zero. Thus, a2 = 0, b2 = 0.
Third frequency
Now we wind around one zero period of our function three times, for clarity, I show three turns on separate graphs:
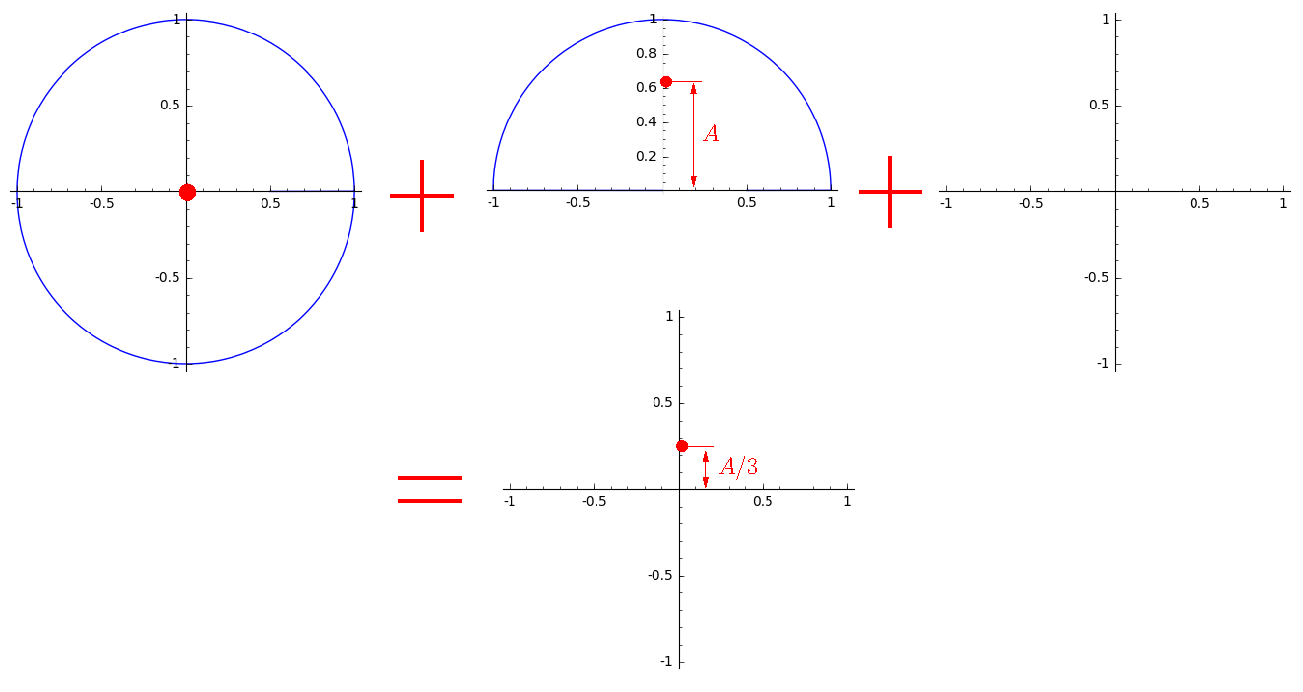
The first coil fills the circle completely, the second half, and the third is empty. If one full revolution weighs one kilogram, then we have one kilogram at zero and half a kilo at distance A from zero. Total, the center of gravity will be at distance A / 3 from zero.
a3 = 0
b3 = A / 3
Higher frequencies
What will happen to the fourth frequency? Two filled coils and two empty, the center at zero. And so for all the even ones.
What will happen to the fifth frequency? Two filled, two empty and one half turn. Total center of gravity on the y-axis at a distance of A / 5 from zero.
Summarize
If we look again at how we consider integrals, it becomes clear that between our signal (square wave) and the functions cos (nx), sin (nx) we are looking for scalar products. That is, we see how much our signal is like cos (nx) and how much it looks like sin (nx). Winding a certain number of times the graph of the (periodic!) Function around zero, we suppress all frequencies except the current one.
The polar angle of our center of gravity tells us how much the signal looks like the corresponding sine or how much it looks like the corresponding cosine. And the distance at which the center of gravity is located indicates the strength of their contribution to the formation of our signal.
Total our series is equal f (x) = 1/2 + 2 / pi sin (x) + 2 / (3 pi) sin (3x) + 2 / (5 pi) sin (5x) + ...
Homework
1) Did you understand the connection between the example of a robot and a square wave?
2) How is the Fourier series related to the Fourier transform?
Source: https://habr.com/ru/post/308526/
All Articles