CsvLogWriter plugin for JMeter

Introduction
Surely everyone who used standard listeners in JMeter, faced the following restrictions:
- standard listeners do not allow getting detailed information on all subqueries specified in the test plan;
- Standard listeners output information in XML format, which complicates the further analysis of logs using Excel and Pandas.
To circumvent these restrictions, it was decided to rework the formation of log files using the new CsvLogWriter plugin.
Assigned tasks
It was necessary to develop a plugin for JMeter, which would have the following functionality:
- displaying the full text of the error in string format;
- data capture by child subqueries.
In standard listeners for JMeter, fixing the full content of the error is possible in XML format, which causes inconvenience for analysis. There was a need to save the text of the error in a string format followed by recording, for example, in the CSV format to ensure the possibility of plotting in Excel and Pandas. Usually, the resulting log files do not display data on child subqueries. That is extremely inconvenient when using the complex structure of the test plan. An example of the structure is shown in Figure 1.
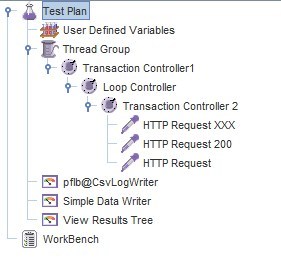
Figure 1. The structure of the test plan
When using standard listeners we will not be able to get the data of subqueries (embedded resources), CSVLogWriter gives us this opportunity.
')
Description of plugin functionality pflb @ CsvLogWriter
A plugin pflb @ CsvLogWriter for JMeter was written during the work. The key features of this plugin include the fact that it can record the results of the work of the child subqueries and record the full text of the error, when it occurs, in plain text, and not in the XML format.
Log fields description
The data recorded in the log file are presented in Table 1.
Table 1. Log Format
Log format
The data recorded in the log file are presented in Table 1.
Table 1. Log Format
| No | Name | Type of | Description | Examples of values for the log column | unit of measurement |
|---|---|---|---|---|---|
| one | timeStamp | long | Start or end time of request | ms | |
| 2 | elapsed | long | Request processing time: endTime - startTime - idleTime | 49, 434 | ms |
| 3 | label | String | JMeter component name | ||
| four | responseCode | String | Request response code | "200", "Non HTTP response code: java.net.UnknownHostException" | |
| five | responseMessage | String | Deciphering the response code | "OK", "Internal Server Error" | |
| 6 | threadName | String | Stream name | "Thread Group 1-1" | |
| 7 | dataType | String | The data type in the response, in practice, takes two values - "bin" or "text" | "Bin", "text" | |
| eight | success | boolean | Request Success Status | true or false | |
| 9 | failureMessage | String | Error message in the case of the Assertion component, added to the sampler. In CsvLogWriter messages are written in the field. from all Assertion components, which generated an error. Only the first message is recorded in the base logger. | ||
| ten | bytes | int | The size of the answer. The value and calculation algorithm depend on the settings. sampler The value may be affected by responseData.length, headersSize, bodySize. | Byte | |
| eleven | grpThreads | int | Number of active threads in the current group | ||
| 12 | allThreads | int | The number of active virtual users of all groups | ||
| 13 | URL | String | Link | ||
| 14 | Filename | String | Names of the file to which the responses are recorded. The field is filled in using Save Response to File Listener. This Listener is rarely used, usually the value of a column - empty line | ||
| 15 | Latency | int | The time to get the first server response. This time delay includes the time spent on connecting to the server delays due to the establishment of a secure connection and JMeter internal delays to receive first bytes of server response. If for some reason Sampler's work was suspended, and then resumed, then the Latency value will be adjusted for the duration of the suspension Sampler. | ms | |
| sixteen | Encoding | String | Encoding. The response encoding is returned, if the response encoding is not set, This returns the default encoding value. The default encoding value is set to "Sampleresult.default.encoding". For HTTP Request, the default value is “ISO-8859-1”. | "ISO-8859-1", "UTF-8" | |
| 17 | SampleCount | int | The number of samples. For HTTP Request, the value is 1. For JMS Sampler, subscribing to events and reading several messages at once, value equals the number of polling cycles or the number of read messages. The value is always greater than or equal to one. | 12 | PC |
| 18 | ErrorCount | int | Number of mistakes. For HTTP Request, the value is 0 if success and equals 1 if the request is not successful. For other samplers that process several messages at a time, value may be greater than 1. | 0, 1 | PC |
| nineteen | Hostname | String | Machine name | ||
| 20 | Idletime | int | Downtime | ms | |
| 21 | Connect | int | Time spent on setting up a connection | ms | |
| 22 | headersSize | int | Header size | Byte | |
| 23 | bodySize | int | Body size | Byte | |
| 24 | contentType | String | Content type from response header | ||
| 25 | endTime | long | Request End Time | ms | |
| 26 | isMonitor | boolean | Sign whether the checkmark is Use As Monitor | true false | |
| 27 | threadName_label | String | Name of thread and JMeter component | ||
| 28 | parent_threadName_label | String | Name of the thread and the parent JMeter component | ||
| 29 | startTime | long | Request start time | ms | |
| thirty | stopTest | boolean | A sign of whether the test is stopped - the Stop button. Also in the settings of the Thread Group there is an option “Stop Test” on error. If in the column "stopTest" it is true, then this is exactly what happened. The script was interrupted by the current request. | true false | |
| 31 | stopTestNow | boolean | The symptom stopped the test abruptly - the Shutdown button. Also in the settings of the Thread Group there is an option “Stop Test Now” on error. If in the column "stopTestNow" it is true, then this is exactly what happened. The script was interrupted by the current request. | true false | |
| 32 | stopThread | boolean | A sign of whether the current thread has stopped. In the settings of the Thread Group there is an option “Stop Thread” on error. If the “stopThread” column is true, it means exactly this situation occurred. The script was interrupted by the current request. | true false | |
| 33 | startNextThreadLoop | boolean | Does the replay start? In the settings of the Thread Group is the option "Start Next Thread Loop" on error. If the “startNextThreadLoop” column is true, it means exactly this situation occurred. The script was interrupted by the current request. | true false | |
| 34 | isTransactionSampleEvent | boolean | A sign that the current event is a transaction (TransactionController). That is, it is only a grouping element. | true false | |
| 35 | transactionLevel | int | Request nesting level If Transaction Controller hierarchy is used or subqueries have subqueries, then in this column there will be an nesting level. | 0 for root query or root transaction controller. 1 for a subquery whose parent is the root. | |
| 36 | responseDataAsString | String | Full error content in string format if it occurs, if success == false, then responseData will contain the complete response body | ||
| 37 | requestHeaders | String | Request headers | ||
| 38 | responseData | String | The full content of the error, if any, if success == false, then responseData will contain base64 full response body | ||
| 39 | responseHeaders | String | Response headers | ||
| 40 | <Variable name> | String | JMeter Variables |
The log structure extends the basic CSV log format. The basic set of parameters can be found at the link jmeter.apache.org/usermanual/listeners.html#csvlogformat
The resulting CSV-log can be downloaded with any basic JMeter Listener that supports downloading of a CSV-log.
Also, additional columns appeared in the log, which can be useful in the analysis (pp. 22-35 of the Log format table).
The bodies and headers of responses and requests are recorded only in case of errors (pp. 36-39 of the Log Format table).
Also, the logs for the variables will be written to the log: jmeter.apache.org/usermanual/listeners.html#sample_variables - description of the ability to log the values of variables.
Interface
To run the plugin you must fill in the Filename field. The Filename field contains the path to the file where the work results will be recorded. You can set the directory manually, or select a file using the Browse button. If the specified file exists, a new file is created. The name of the new log file is formed by adding a postfix with the log file number to the original name.
Also on the form are flags. Using the checkboxes, you can manipulate the data recorded in the log. The Additional parameters checkbox is responsible for fixing additional parameters (22-35 lines in the Log Format table), Response data is responsible for fixing error text (36-39 lines in the Log Format table), User variables are responsible for fixing user variables.
The plug-in interface is shown in Figure 2.
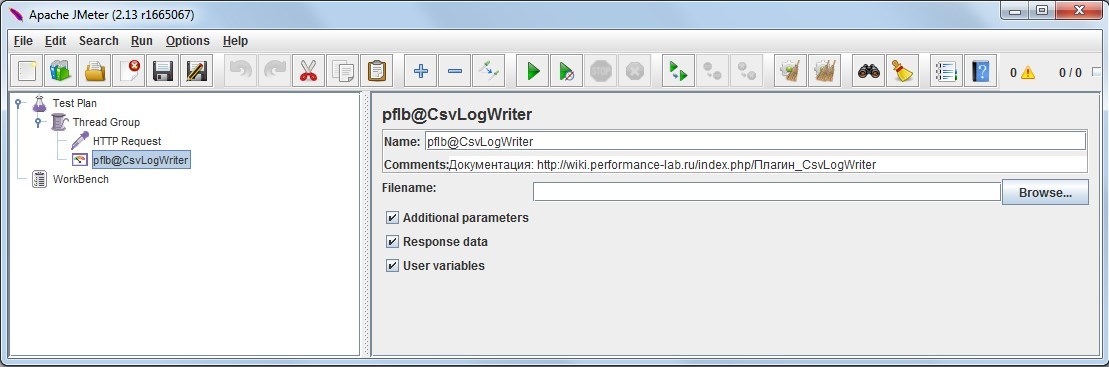
Figure 2. Interface plug-in CSVLogWriter
Compare CSVLogWriter and Simple Data Writer plugin
In this section, we will try to compare the CsvLogWriter plugin and the standard Simple Data Writer.
The composition of the logged data
The Simple Data Writer listener gives the user the ability to customize the list of captured data. Figure 3 shows the output settings window.
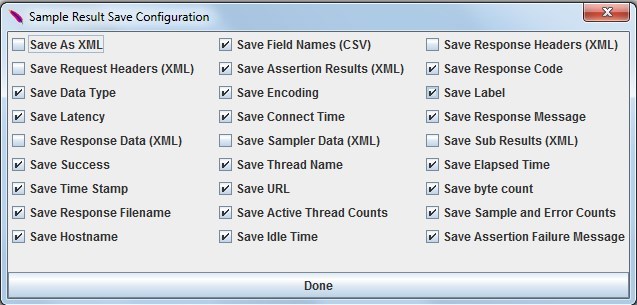
Figure 3. Simple Data Writer fixer data settings window
The CsvLogWriter plugin always displays a basic list of parameters (similar to Simple Data Writer) and allows you to customize the display of a list of additional data using 3 checkboxes on the form:
- Additional parameters - additional parameters (22-35 lines in the Log Format table);
- Response data - error texts (36-39 lines in the Log format table);
- User variables - user variables (for output, you need to run JMeter with the -Jsample_variables key).
A detailed list of fixed data is fixed in the code. But, as seen in Figure 3, Simple Data Writer cannot display error text in string format. The full text of the error is recorded only in XML format. For this reason, in the case when we need the text of errors, we have to keep 2 logs - 1 in CSV format (if further processing of the log with charting in Excel or Pandas is needed) and 1 in XML format.
Subquery Logging
Also, the Simple Data Writer listener does not record the results of the work of the child subqueries; accordingly, such a log file cannot be called exhaustive. To visually compare the amount of output data, run the test corresponding to the test plan in Figure 1, and look at the log files. The SimpleDataWriter log file is presented in Figure 4.
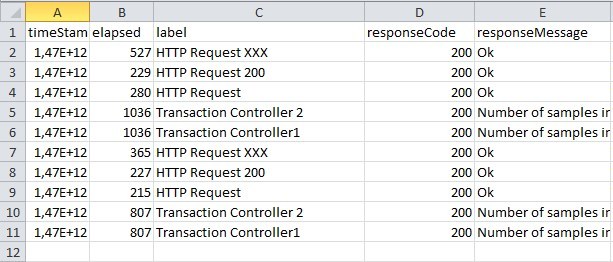
Figure 4. Simple Data Writer log file
As you can see in Figure 4, SimpleDataWriter does not display information on embedded resources. In turn, the CsvLogWriter plugin, by processing child subqueries, displays more information. The content of the log file of the CsvLogWriter plugin is presented in Figure 5.
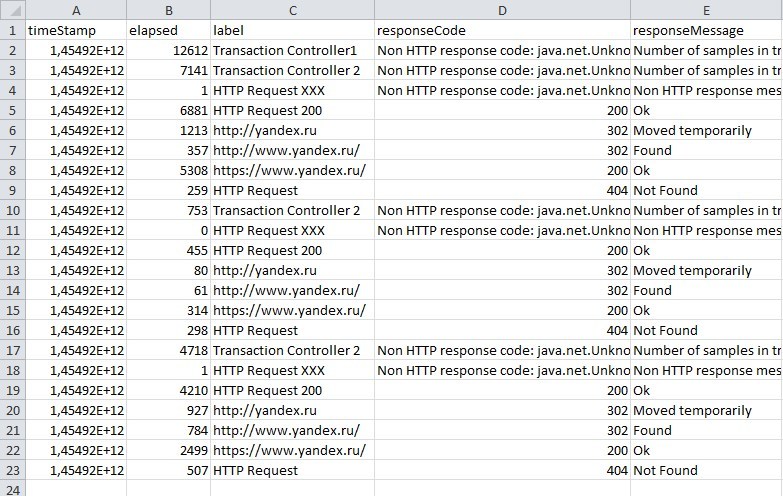
Figure 5. CsvLogWriter log file
Performance comparison
We also analyzed the performance of the SimpleOccured method, which is responsible for event handling. Profiling was done in Java VisualVM. No subqueries were used in the test plan. For SimpleDataWriter, testing was started with recording to 1 CSV file and recording to 2 files - CSV and XML. The number of virtual users was 10, the number of repetitions is 100. The results of the comparison are shown in Table 2.
Table 2. Comparison of the performance of SimpleDataWriter and CsvLogWriter plugin
| CsvLogWriter | SimpleDataWriter (CSV + XML) | SimpleDataWriter (CSV) |
| Duration (ms), number of calls | Duration (ms), number of calls | Duration (ms), number of calls |
| 215, 2000 | 23076, 4000 | 101, 2000 |
Findings:
- CsvLogWriter 10 times faster SimpleDataWriter (XML with maximum detail);
- CsvLogWriter 2 times slower than SimpleDataWriter (CSV with maximum detail);
- SimpleDataWriter (XML with maximum detail) is 20 times slower than SimpleDataWriter (CSV with maximum detail).
Link to plugin
github.com/pflb/Jmeter.Plugin.CsvLogWriter
Source: https://habr.com/ru/post/308098/
All Articles