Cyclic causality diagram as a tool for modeling complex systems

Anton Antipin
General Director of the Business Set Company
“If you want to understand the system and be able to predict its behavior, you need to study it as a whole. When it is divided into parts, the connections may collapse and, therefore, the system itself. ”Denis Sherwood
It seems to be an extremely simple and infinitely wise idea from the author of the best seller, “See the Forest for the Trees”! But, as is often the case with simple and wise thoughts, for practical reasons (either too simple, or too wise) they do not find practical use. A huge number of managers, starting to explore something, sabit the interlocutor with a glassy look and mantra with a memorized pernicious syllable: “Cut the elephant into pieces, cut the elephant into pieces, cut…”! However, it does not take into account the fact that, losing integrity, the elephant becomes either a cripple or a corpse.
It is not necessary to think, however, that we call for the rejection of the division of the whole into parts. Opposite! We are talking only about the fact that the study of complex systems should include not only the division into elements, but also the analysis of the links connecting these elements into a single whole. In general, the idea of the need for a comprehensive study of the activities of any system (including business) is actively advocated by system analysts. And one of the tools that are used for this is the process diagram. This is nothing but the modeling of the system through the study of its elements (processes) and their relationships (relationships between themselves and the elements of the environment). Process modeling is an excellent tool, but often perceived by managers as something complex, long and expensive. Today requires managers to instantly respond to management decisions. The requirement for the highest speed of management decision making is half the problem. Management decisions must be of high quality, that is, be based on a deep understanding of the system. Will this understanding give a process approach? Certainly yes, it will. Will the process approach give such an understanding quickly? No, it will not. Thus, there is a need for additional tools, namely, additional, and not alternative, in relation to the process diagrams, which would allow to quickly understand the functioning of any system. Such a tool and offers Denis Sherwood. The name of this tool is cyclic causality diagrams. Let's see how this tool works.
')
A visual representation of this tool will be demonstrated in the Business Studio business modeling environment. All diagrams presented in this article are built in this environment.
So, the cyclic causality diagram has only three components. The first component is an element of the system (variable). In the diagram, it is simply denoted by words, an inscription. In my practice, I denote a variable by a text enclosed in an oval. The second component is the connection between the elements. Links are described using arrows:

The third component is the type of communication. There are only two types of connection: reinforcing (positive) and balancing (negative).
Reinforcing coupling is used when changing one variable changes the variable associated with it in the same direction. For example, increasing the number of customers increases sales. The variables "Number of customers" and "Sales" are interconnected by an amplifying link. The reinforcement link is identified on the diagram by either a text label (“+” or “n”) or color coding (the color of the arrow is “green”).

Balancing connection, respectively, is used when changes of variables are directed in different directions. For example, by reducing the response time to a client request, his satisfaction increases.

Next, we propose to make out the application of this tool in practice. Often, within the framework of training and consulting projects, we are faced with the task of explaining to the audience the importance of customer focus. It would seem, what is there to explain. However, the depressing statistics speak for themselves: “99% of companies state that they are customer-oriented and that only customers are customer-centric.” A true understanding of customer orientation can only come after a deep study of the key relationships of customer orientation with other elements that make up the business. And here cyclical causality diagrams can be very, very useful. Let's make this diagram together.
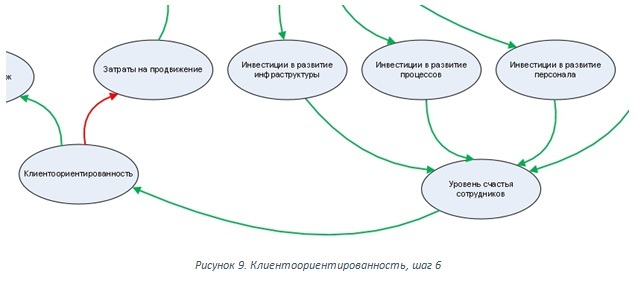
The growth of customer focus stimulates an increase in the number of transactions. This includes repeat business from existing customers, who are becoming more and more comfortable with you, and transactions made for the first time by new customers who come to you on the recommendation. Accordingly, we associate these two factors with an amplifying bond. Also, the growth of customer focus stimulates a fall in promotion costs: word of mouth works!

The growth in the number of transactions (while maintaining the average check of course) increases business income (reinforcing communication). Promotional costs are reduced, and costs are reduced (reinforcing communication). Reducing costs leads to higher profits (balancing communication). Earnings increase - profits increase (reinforcing communication).

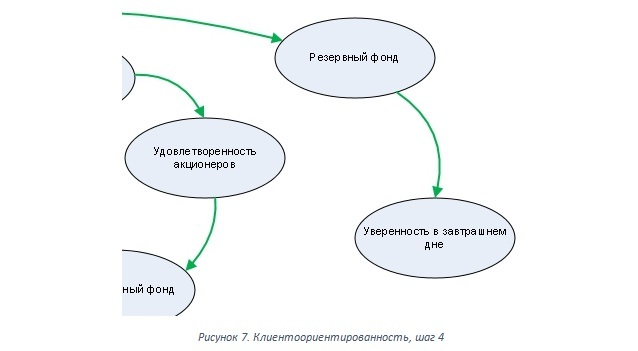
Profit growth in turn stimulates an increase in the reserve fund (reinforcing communication), an investment fund necessary to finance enterprise development programs (enhancing communication). Profit grows - dividends grow (reinforcing bond). Dividends are growing - the satisfaction of shareholders from the business they have created (enhancing communication) increases. Increased business satisfaction, in turn, has a positive effect on the investment attractiveness of the business (enhancing communication).

Increasing the reserve fund stimulates confidence in the future (reinforcing communication).
Increasing the investment fund provides opportunities for the development of personnel, processes and infrastructure (reinforcing communication). Comfortable, well-equipped workplace (investment in infrastructure), clear, understandable work rules (investment in business processes), opportunity to develop (investment in personnel), confidence in the future, all this makes employees happy!

What is described here is the results of several modeling sessions conducted during several trainings and in different companies. Pay attention - the factor "salary" has not sounded even once! He is not here! I want to be happy! And for this, I will be customer-oriented! Continuing the study of relations further, we will come to the conclusion that only a happy employee can be truly customer-oriented. The employee's happiness level is growing - the company's customer focus is growing (reinforcing communication). The cycle is closed!
Usually, at the trainings, we and participants break customer focus into two factors: internal customer focus and external customer focus. In this form, customer focus becomes complete.

Thus, using the cyclical causality diagram, we were able to consider the customer focus in the unified “business” system, find out what it affects and how to manage it, make it closer and more expensive for each employee of the company. This is how a client-oriented approach ceases to be a declaration and turns into a culture.
The given example is only a special case of using such a tool as cyclic causality diagrams. As you understand, its use is effective for solving quite a wide range of tasks. We hope that cyclical causality diagrams will occupy a worthy place in your arsenal of business development tools.
And the best conclusion of this article, in our opinion, will be the parting words of the author of the method considered in the article. With sincere respect, we pass the floor to Denis Sherwood.
- If you want to understand the problem, study it as a whole. This is the foundation of systems thinking - “to see the forest behind the trees”.
- If you want to influence the behavior of the system and control it, then you should influence the system as a whole. Attempts to set it up in one place in the hope that nothing happens in another are doomed to failure.
- The main tool of systems thinking is a cyclic causality diagram, which allows you to simulate complex systems.
- Managing a business is like managing a complex mechanism that is coordinated with leverage. Deciding in which position to install the "levers" of the company is just what the manager should do.
- The best way to understand systems thinking is to use it in real life.
Note: the article used free images provided by the author of the resource https://pixabay.com/ru/ , as well as photos from the personal archive of the author.
Source: https://habr.com/ru/post/307908/
All Articles