How to plan and evaluate projects in Agile?
A few years ago, Luxoft Agile Practice Trainer - Vyacheslav Moskalenko was faced with the problem that many Scrum teams do not evaluate all the stories in the Backlog of the Product. And in vain, because the evaluation gives us a transparent picture of real progress and the ability to manage the expectations of our customers, without waiting for the finish line of our project, when it is too late to change something.
 “This is how my thought was born to create a game through which I could interest the team to start evaluating all the stories in relative parrots. And then I got the idea of painting the empty figures on the flip chart paper.
When I first held a coloring game at one of the master classes of the local PM crowd, I didn’t even expect that quite conservative managers would have so much fun and get an explanation of “What is a relative story point? What is its value? “. Since then, I have held this game at many trainings and several conferences, including SECR-2015 and Agile Days Russia 2016 ”.
')
To show how the use of an iterative-incremental approach in combination with a relative estimate gives more transparency in project timing predictions.
Usually the game takes about one hour, including discussions.
Training:
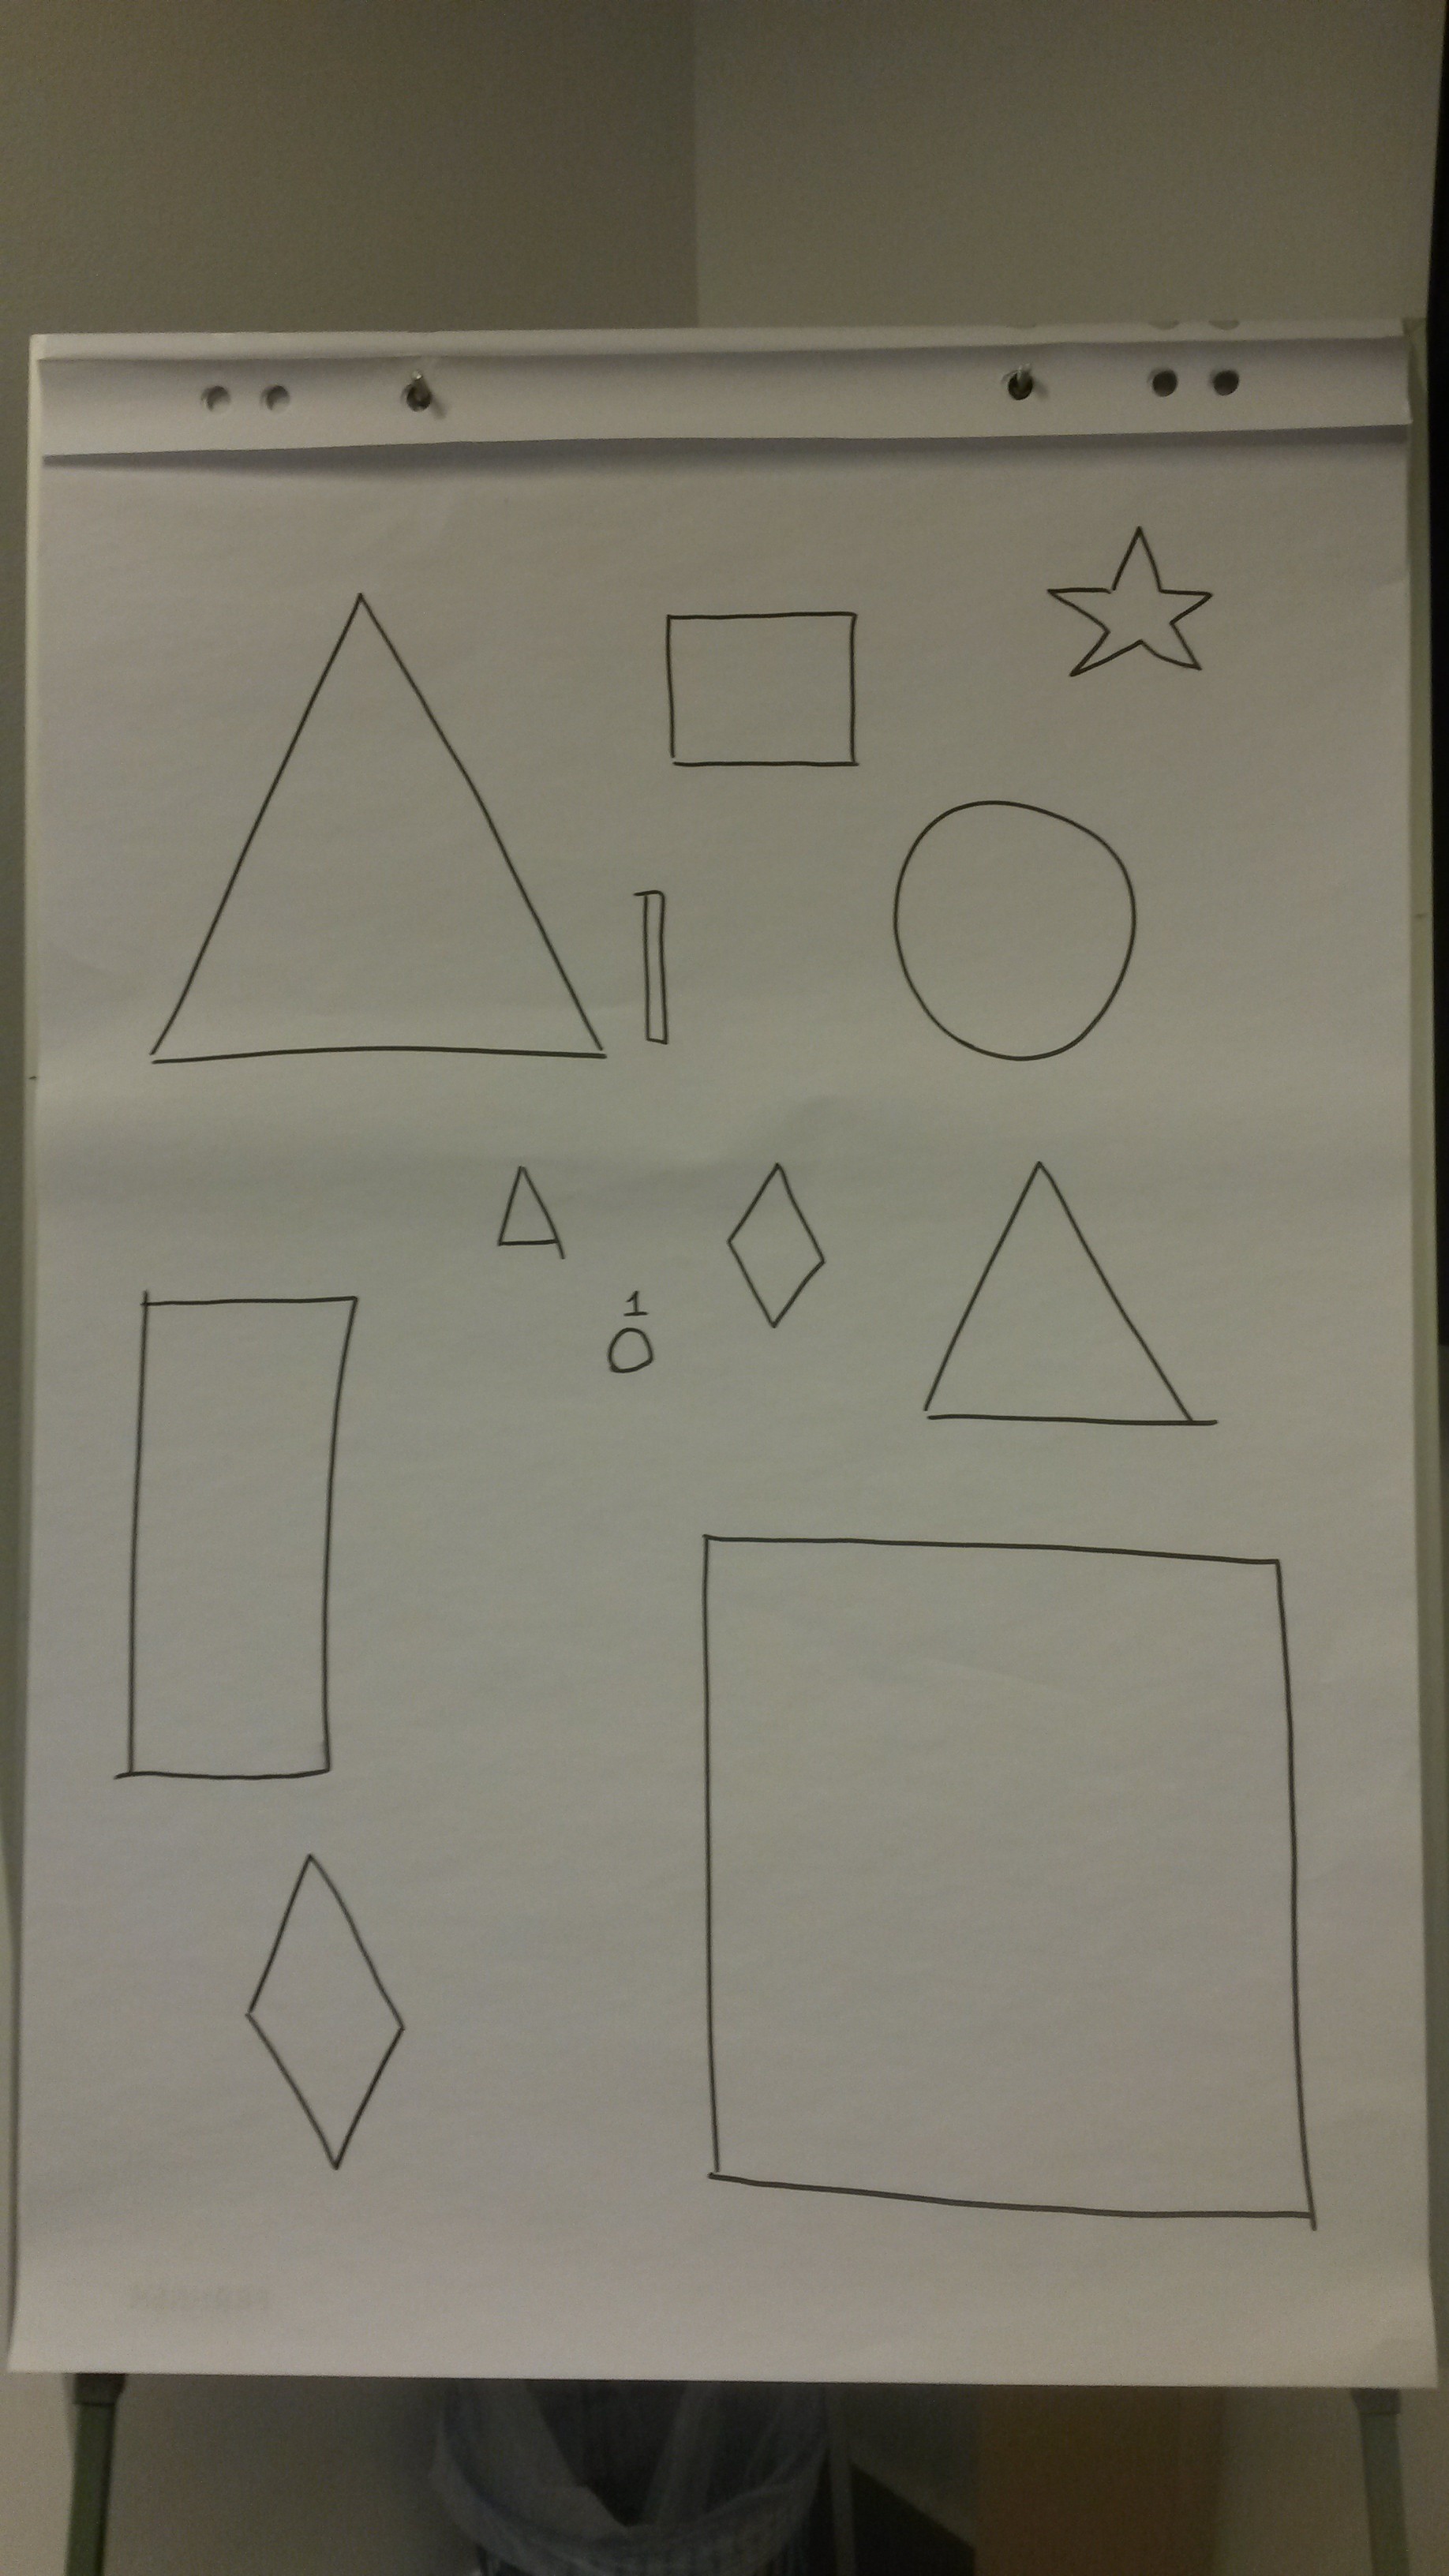
1. For each group prepare the same flip charts with empty figures. See example below.
2. The host of the game prepares a table on the flip chart in which he will record the metrics of all the teams:
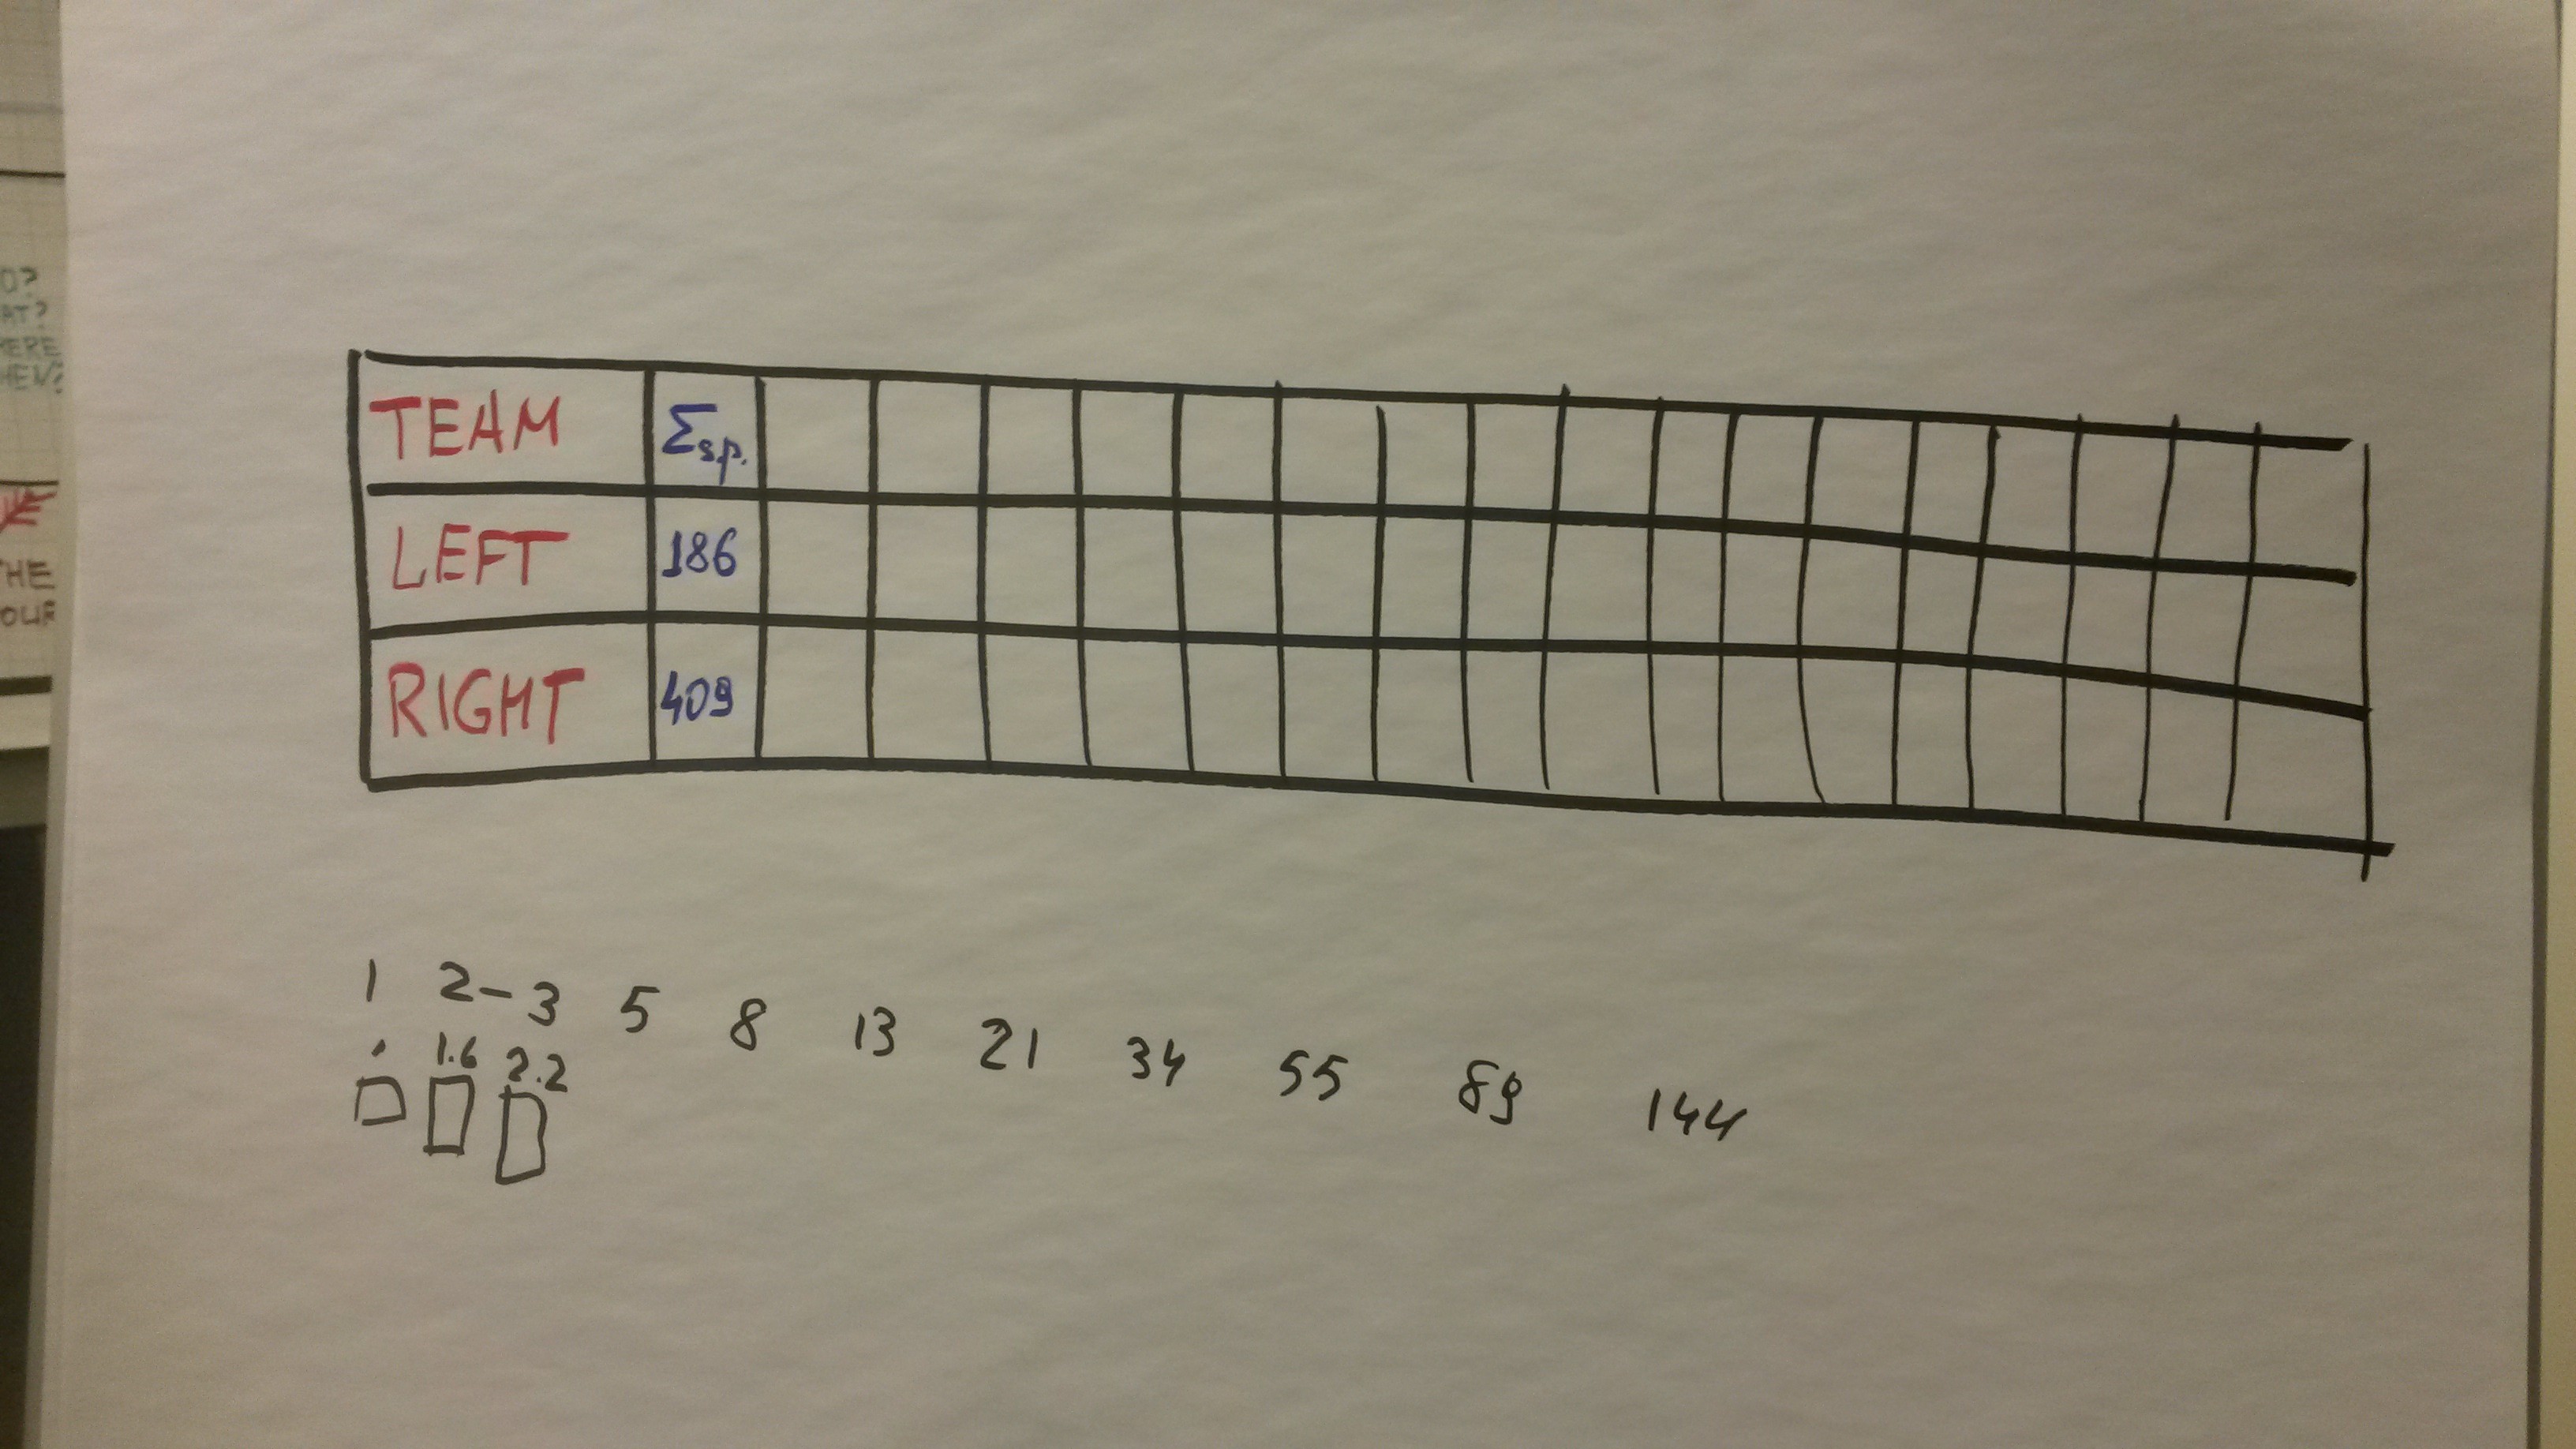
3. Teams evaluate all figures in relative stori-points, using Fibonacci numbers and count the sum of all story-points. The master enters this value in the table. See above
4. The teams also estimate the time for completing the task (fill in all the figures) in minutes (absolute estimate), taking into account that only high-quality filling is accepted, i.e. does not contain white spaces and does not climbs over the outlines of the figures.
1. The length of one iteration is not more than a minute.
2. Before the first iteration, the presenter may give a minute to discuss the team paint strategy. Priorities - starting with the smallest, ending with the big ones. When teams reach the largest fill, the lead can increase the planning, so that the teams break the pieces into segments and evaluate the segments separately.
3. Run the first iteration:
4. The host accepts the work. We count only perfectly painted shapes, or segments (only if there was a preliminary breakdown). The team considers Velocity.
5. Partially done work is revalued in the story points in the direction of reduction, but the difference is not added to the total speed (i.e., speed only shows the accepted work). People often ask me why? I understand that it is a shame to lose points when the story at the end of the sprint is 90% completed (the points will pass, as it were, past the team). The only question is what the team wants, show high speed or overstate the expectations of the customer? Perhaps in this unfinished story really left 10% of the work. But suddenly, completing these 10%, you find a defect, which you will spend + 50% of your time to solve. And the customers have already shown high speed? That is why the community of scrum practitioners does not recommend including any unfinished stories in Velocity.
6. The team recalculates the amount of remaining story points on the flip chart and predicts the project implementation period using the formula.
Most likely the deadline will be different from the originally planned
7. Repeat steps 1-6 before completing the paint project:
8. The team celebrates the completion of the project.
1. If even before the first iteration, the teams had different evaluations, discuss how the customer can understand who is right? As a result, it may turn out (and this is the most likely outcome) that everyone is wrong, because it is a thankless task to promise exact dates in the complex system. Discuss how not to fall into the trap of your own wrong assessments?
2. If the teams did not earn points after the first iteration. Discuss why it’s important to have a finished increment at the end of the iteration? Why does the half-finished increment show no progress? Why half-increment can give large errors in the calculation of the forecast of the project?
3. Demonstrate how to draw the Release Burn-Down Chart using the data from the table.
4. Discuss why it is important to accustom the customer to the fact that the speed of the team can constantly change under the influence of unforeseen circumstances?
5. Collect and record feedback from participants. What did they learn new? What have you learned? What exercises can you try in real life?
6. The moderator makes sure that the participants understood how the relative parrots helped to count the real time of the project.
7. Explore the value of sharing large tasks / stories (figures) and how teams improved between iterations.
Thanks for attention!
PS August 29-31 Vyacheslav conducts certified Professional Scrum Master training in Moscow.
“This is how my thought was born to create a game through which I could interest the team to start evaluating all the stories in relative parrots. And then I got the idea of painting the empty figures on the flip chart paper. When I first held a coloring game at one of the master classes of the local PM crowd, I didn’t even expect that quite conservative managers would have so much fun and get an explanation of “What is a relative story point? What is its value? “. Since then, I have held this game at many trainings and several conferences, including SECR-2015 and Agile Days Russia 2016 ”.
')
purpose
To show how the use of an iterative-incremental approach in combination with a relative estimate gives more transparency in project timing predictions.
Time
Usually the game takes about one hour, including discussions.
- 15 minutes - assessment
- 35 minutes - complete the fill (iteration time = 1 minute)
- 10 minutes - discussion
- Split the group into teams of 3-5 people
- Teams must sit at the table
- One blank sheet of flip chart paper per team
- One flip chart marker per participant
Instructions
Evaluation
1. For each group prepare the same flip charts with empty figures. See example below.
2. The host of the game prepares a table on the flip chart in which he will record the metrics of all the teams:
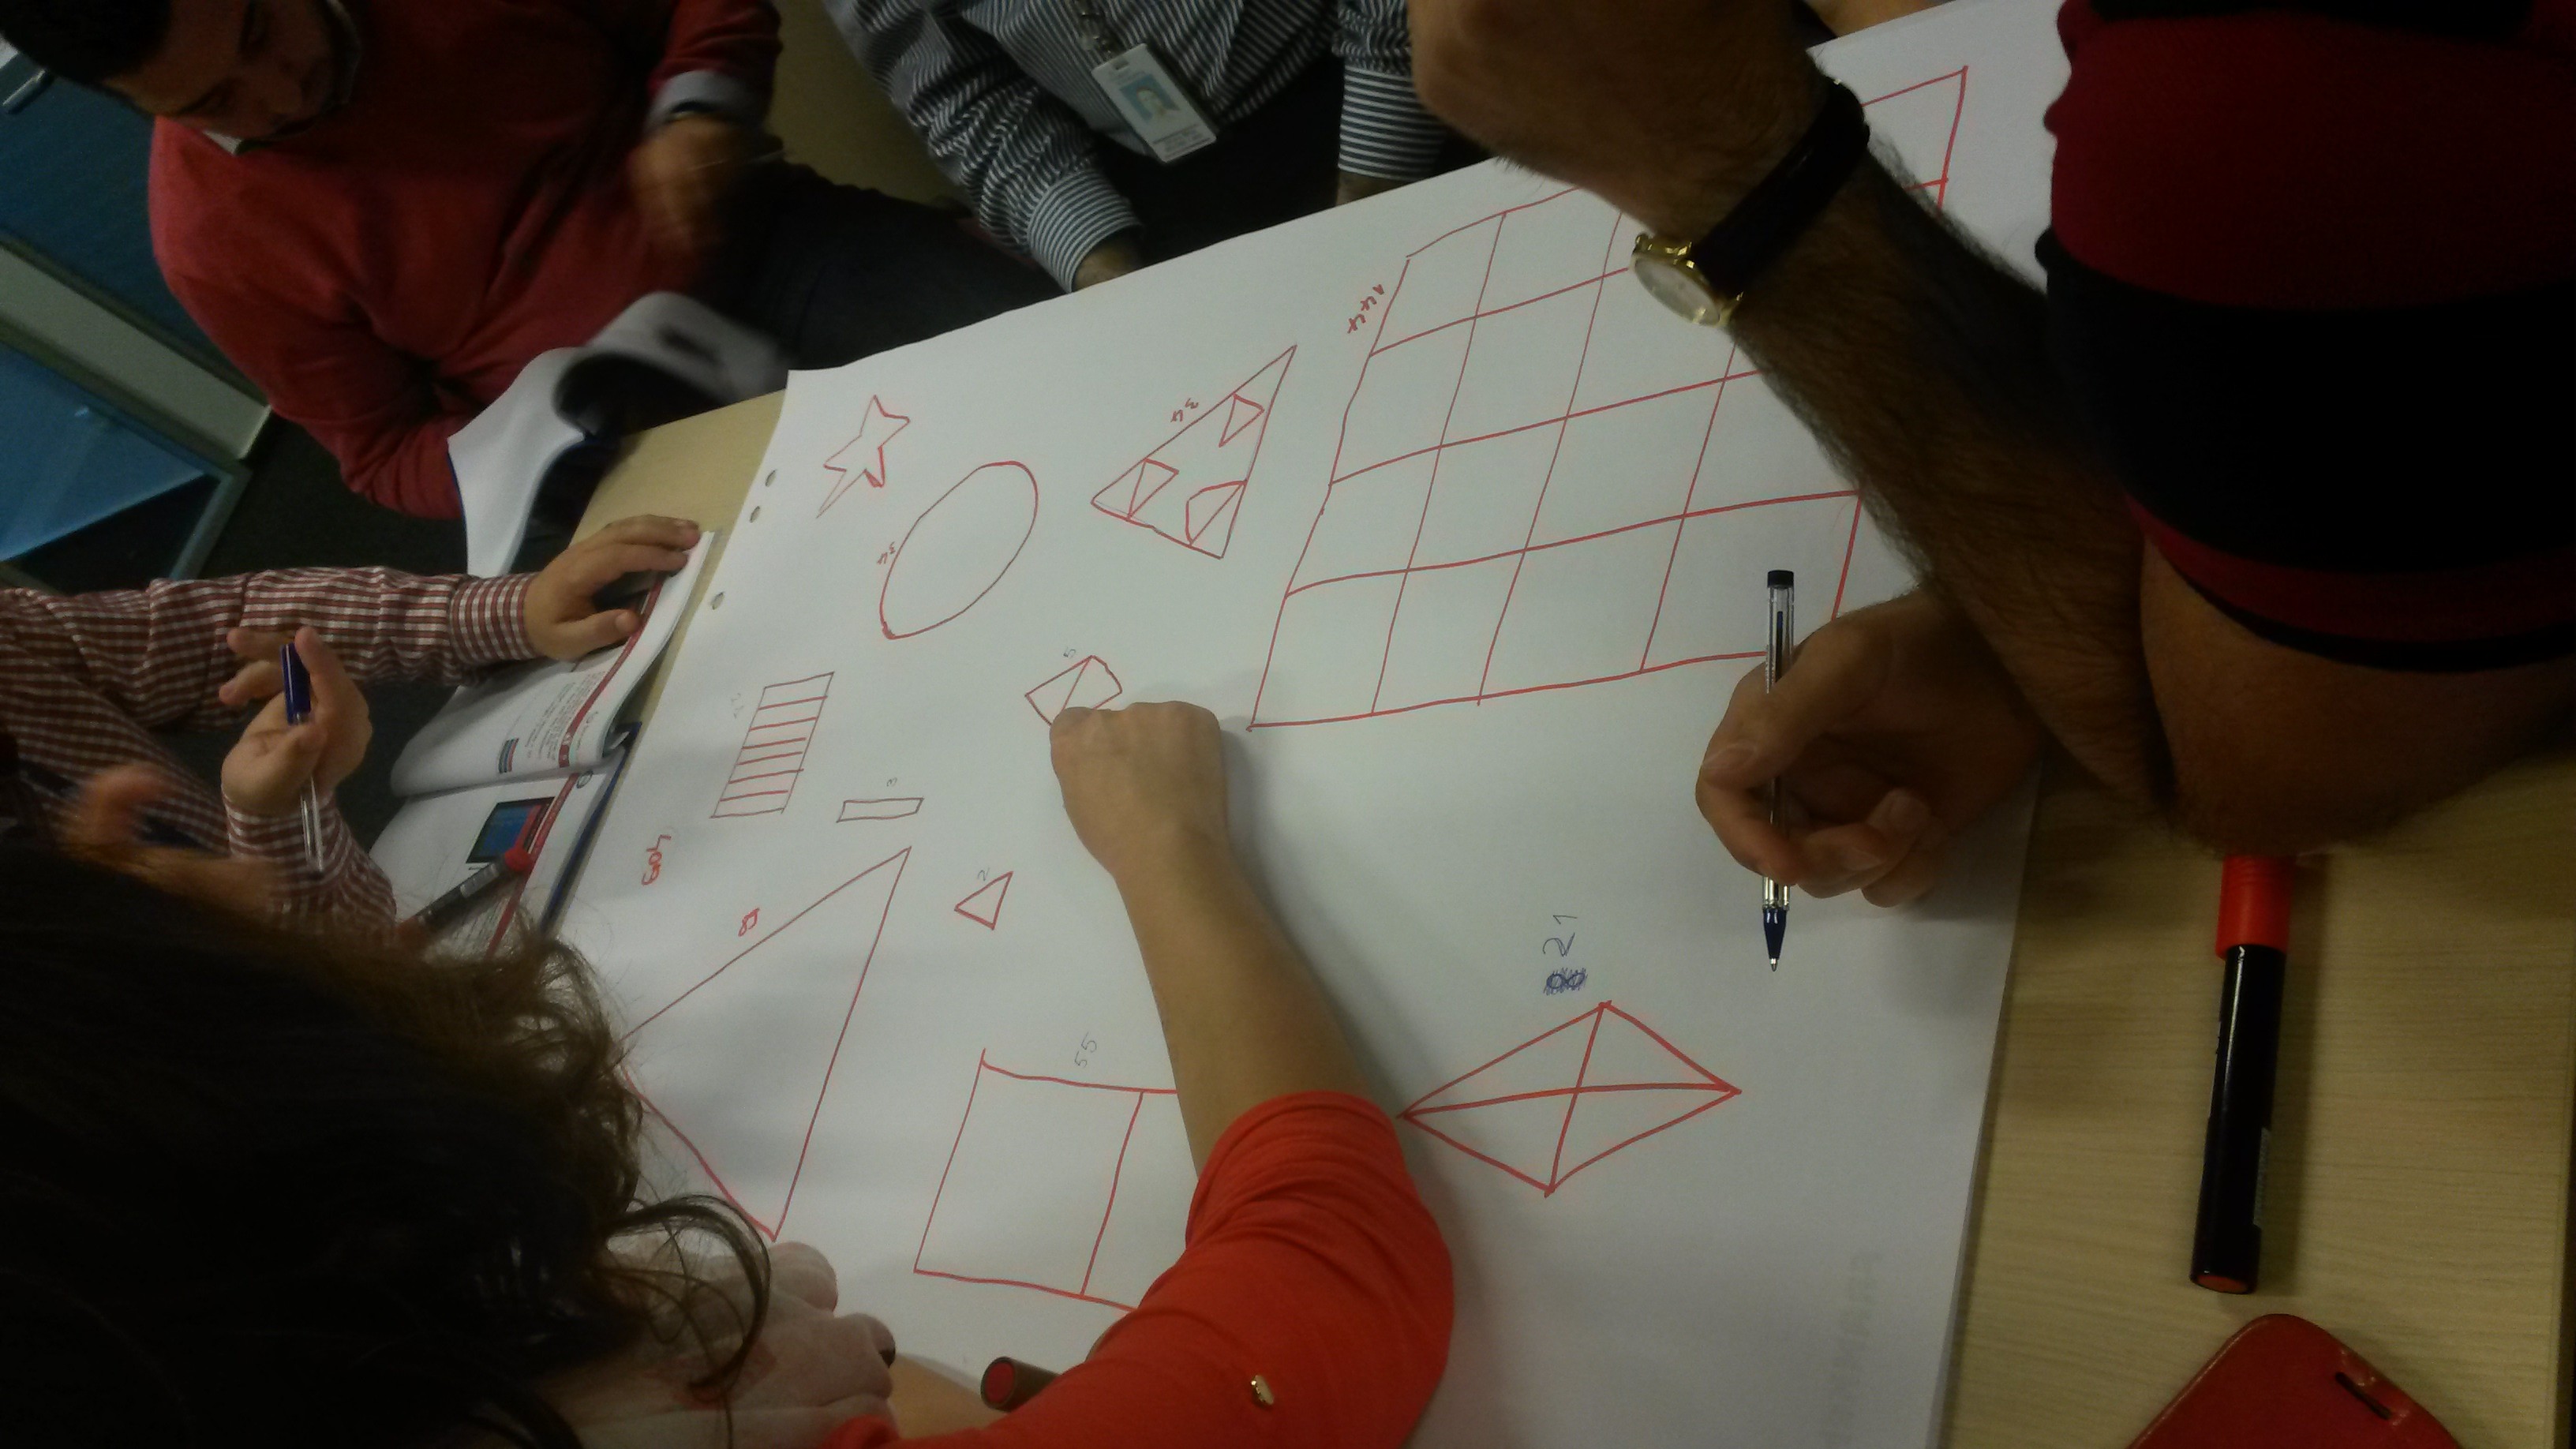
3. Teams evaluate all figures in relative stori-points, using Fibonacci numbers and count the sum of all story-points. The master enters this value in the table. See above
4. The teams also estimate the time for completing the task (fill in all the figures) in minutes (absolute estimate), taking into account that only high-quality filling is accepted, i.e. does not contain white spaces and does not climbs over the outlines of the figures.
Performance
1. The length of one iteration is not more than a minute.
2. Before the first iteration, the presenter may give a minute to discuss the team paint strategy. Priorities - starting with the smallest, ending with the big ones. When teams reach the largest fill, the lead can increase the planning, so that the teams break the pieces into segments and evaluate the segments separately.
3. Run the first iteration:
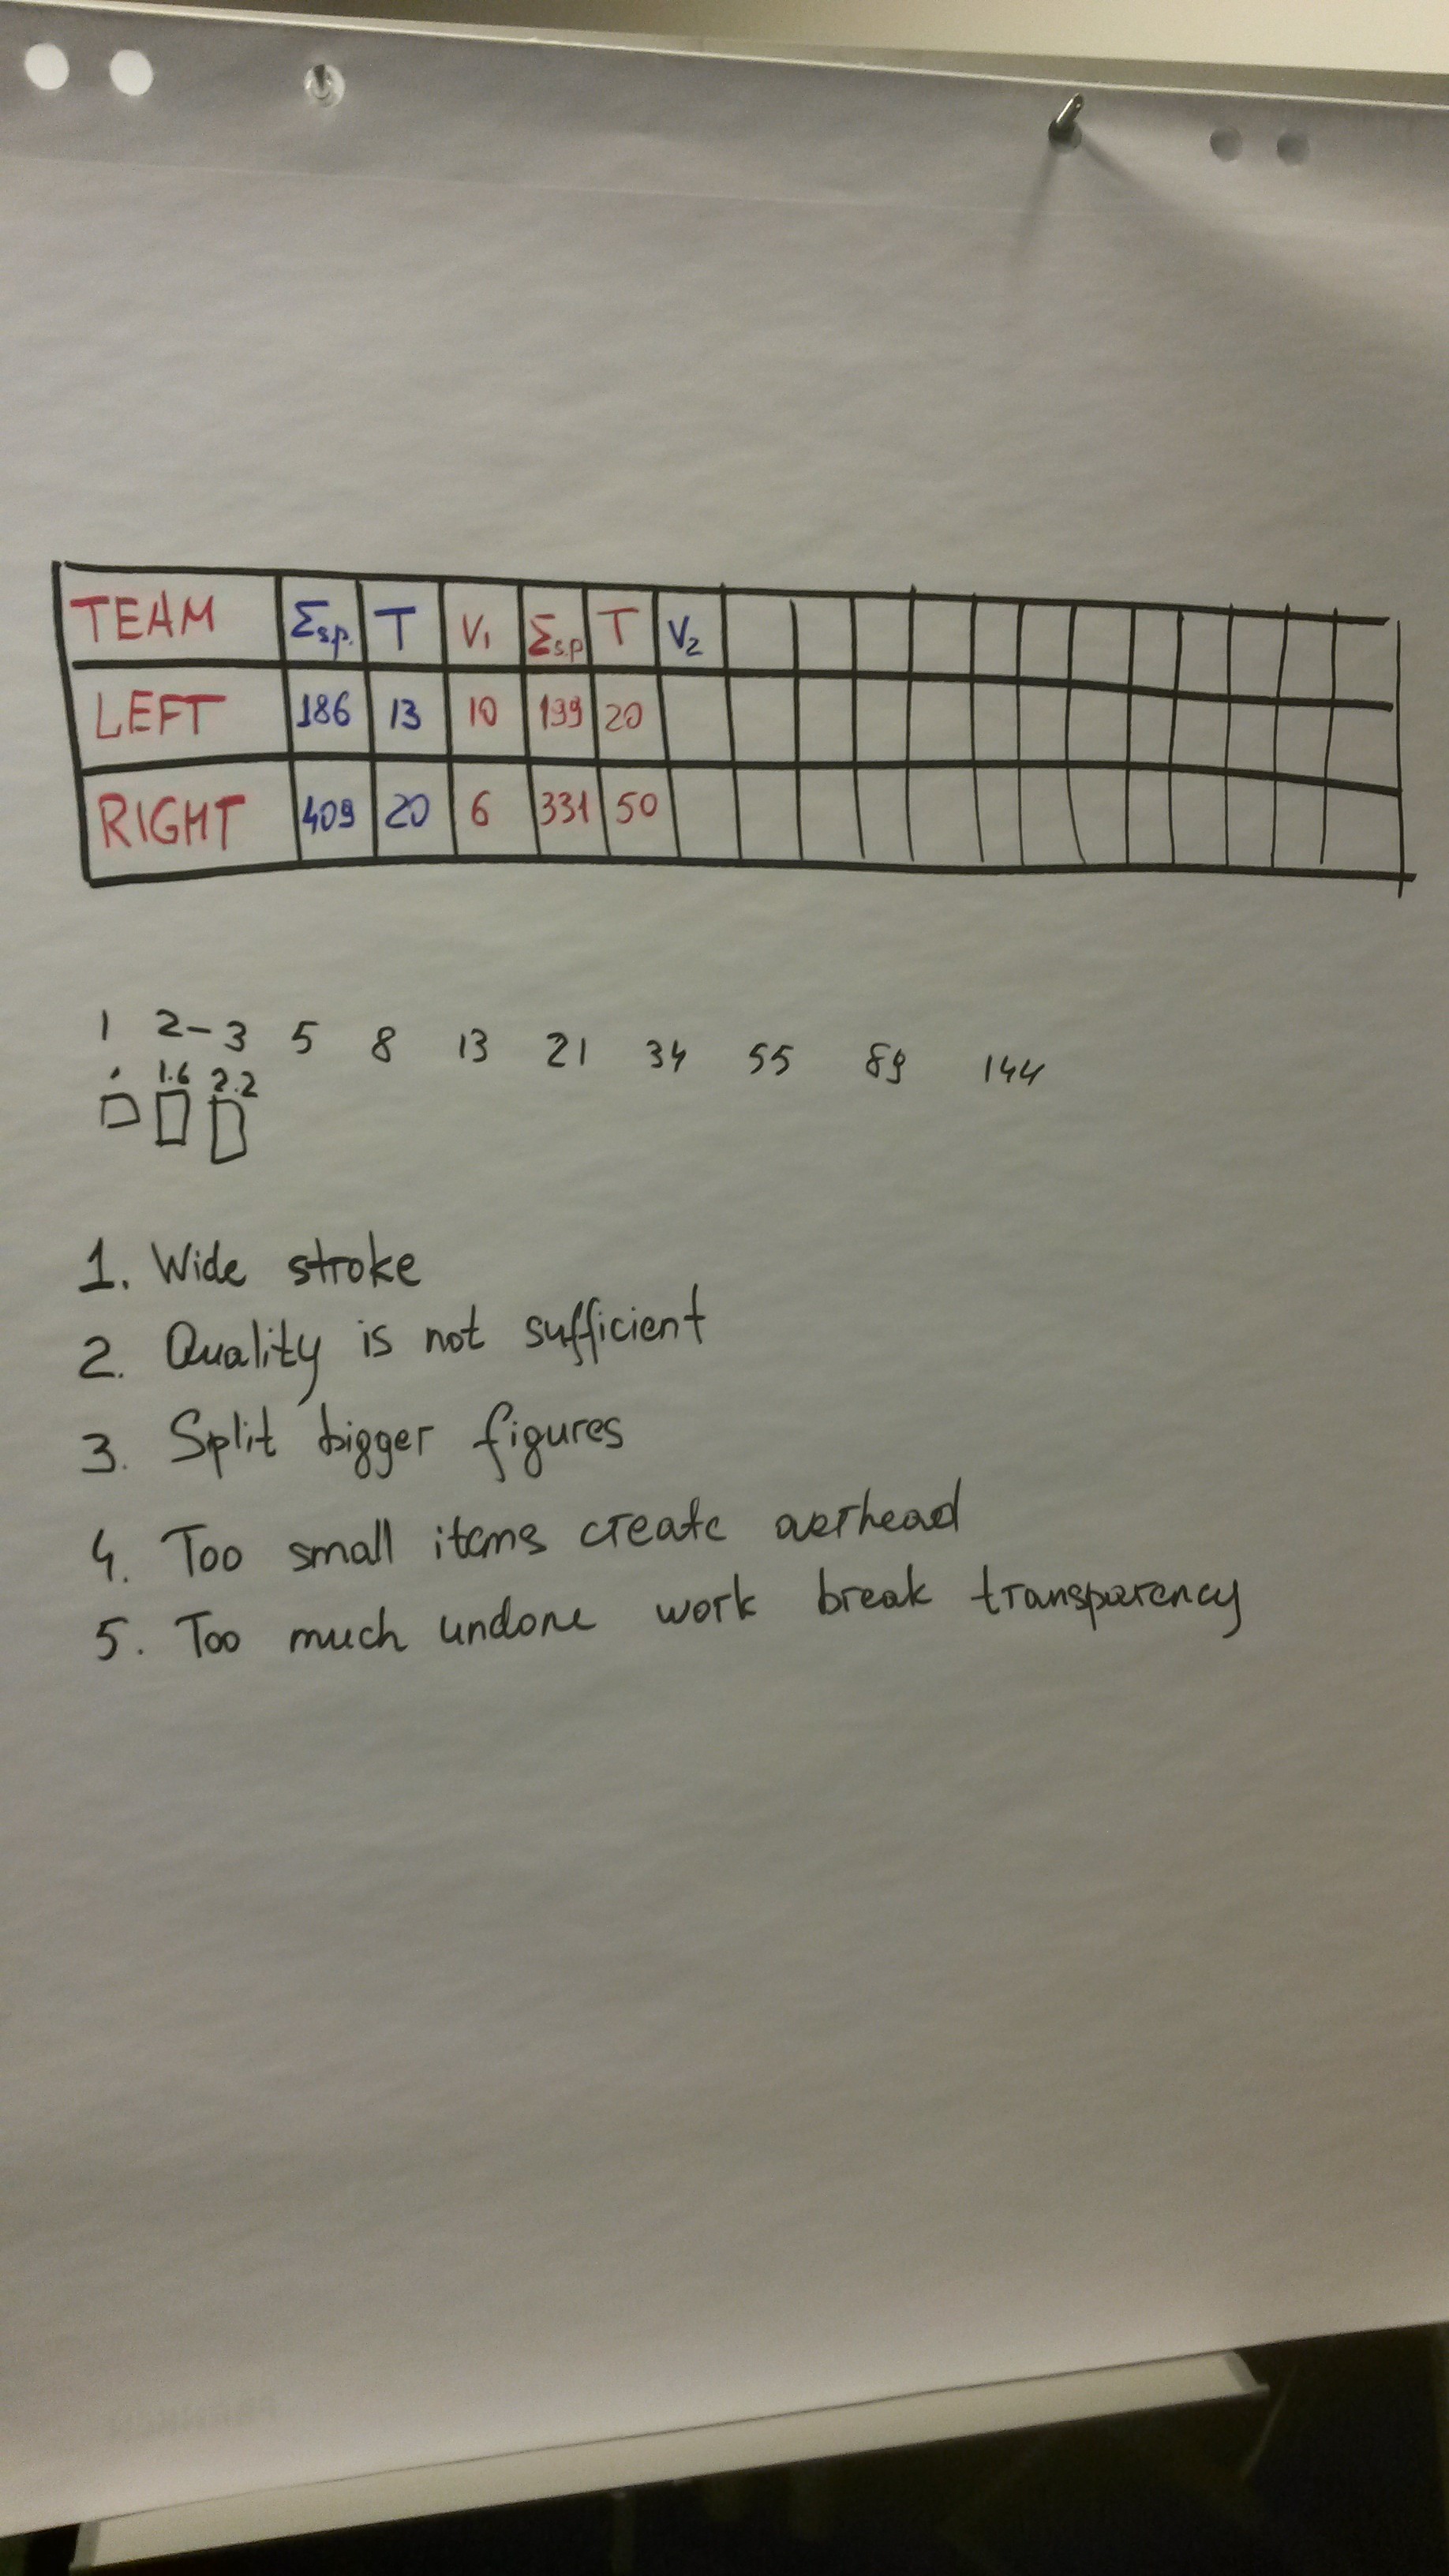
4. The host accepts the work. We count only perfectly painted shapes, or segments (only if there was a preliminary breakdown). The team considers Velocity.
5. Partially done work is revalued in the story points in the direction of reduction, but the difference is not added to the total speed (i.e., speed only shows the accepted work). People often ask me why? I understand that it is a shame to lose points when the story at the end of the sprint is 90% completed (the points will pass, as it were, past the team). The only question is what the team wants, show high speed or overstate the expectations of the customer? Perhaps in this unfinished story really left 10% of the work. But suddenly, completing these 10%, you find a defect, which you will spend + 50% of your time to solve. And the customers have already shown high speed? That is why the community of scrum practitioners does not recommend including any unfinished stories in Velocity.
6. The team recalculates the amount of remaining story points on the flip chart and predicts the project implementation period using the formula.
= -\Velocity Most likely the deadline will be different from the originally planned
7. Repeat steps 1-6 before completing the paint project:
8. The team celebrates the completion of the project.
Discussion
1. If even before the first iteration, the teams had different evaluations, discuss how the customer can understand who is right? As a result, it may turn out (and this is the most likely outcome) that everyone is wrong, because it is a thankless task to promise exact dates in the complex system. Discuss how not to fall into the trap of your own wrong assessments?
2. If the teams did not earn points after the first iteration. Discuss why it’s important to have a finished increment at the end of the iteration? Why does the half-finished increment show no progress? Why half-increment can give large errors in the calculation of the forecast of the project?
3. Demonstrate how to draw the Release Burn-Down Chart using the data from the table.
4. Discuss why it is important to accustom the customer to the fact that the speed of the team can constantly change under the influence of unforeseen circumstances?
5. Collect and record feedback from participants. What did they learn new? What have you learned? What exercises can you try in real life?
6. The moderator makes sure that the participants understood how the relative parrots helped to count the real time of the project.
7. Explore the value of sharing large tasks / stories (figures) and how teams improved between iterations.
Thanks for attention!
PS August 29-31 Vyacheslav conducts certified Professional Scrum Master training in Moscow.
Source: https://habr.com/ru/post/307760/
All Articles