Recommender systems in online education. Continuation
We continue to talk about the adaptive learning system at Stepic.org. The first introductory part of this series can be read here .
In this article we will talk about building a recommender system (which is the basis of adaptability). We will tell about the collection and processing of user data, transition graphs, handlers, user response evaluation, generation of output.
Recall the linear regression, regularization, and even understand why in our case it is better to use the ridge regression, and not some other one there.
Common words
The recommendation system on Stepic.org offers the user new lessons (educational content) based on what he was interested in earlier. It uses for this various ways to find content that is somewhat similar to the one that the user has already studied, or not so similar, but generally interesting.
Each of these methods is designed as a separate function ( handler ), which extracts the list of lessons according to the principle laid down in it and marks them with weights depending on how well they fit the user. A detailed description of these handler functions will be provided below.
The recommendation system can be used in different situations. Two main cases:
- the usual recommendation for a particular user, which is shown to him on the main page and in the tab “Recommended Lessons”, as well as from time to time is sent to the post office;
- contextual recommendation , which is shown to the user after passing the lesson outside the course (that is, a lesson for which there is no fixed following), as a hint what to look further.
Along with the recommendation, the user is also shown information about why this particular lesson was offered to him. This information is easy to extract due to the fact that in each function, the handler has some kind of intuition, so that you can reconstruct the reason for the recommendation.
User Data
In the process of learning at Stepic.org, the user leaves a significant digital footprint. In addition to information about his progress, information is also stored about when he visited different steps (step is an elementary unit of content; steps are combined into larger lessons), when he tried to solve problems and with what result, and even how he watched the video: which speed and the volume, where he stopped and where he rewound.
The most interesting for the basic recommender system are the following information: tags (that is, areas of knowledge with which the lessons are traced) that the user was interested in, the lessons he visited, the lessons he learned, and, if the recommendation is contextual, the current lesson.
In addition to information about a specific user, the stored data can be viewed as information about the interaction of users with content. One of the ways to aggregate and use this information turned out to be transition graphs, which we will discuss in more detail.
Transition Graphs
It is often useful to find out how users explore content, what they watch more often, what less often, which materials skip, which ones they return to, and, most importantly, the order in which they are viewed. Using logs about user actions, it is easy to provide answers to these questions. We used for this transition graph ( process map ), that is, a directed graph in which the vertices will be the content units (for example, steps or lessons), and the weights of the arcs will show the number of transitions between these content units.
Each user action in the log has a timestamp. Actions also come in different types, for example, "viewed" (opened step), "succeeded attempt" (solved problem) or "commented" (left a comment). We will be interested in the actions of the user in relation to the steps, which are then easy to summarize into the lessons to which the steps belong, and even to the tags that mark the lessons.
Visually, the transition graph can be thought of as a series of vertex materials (for example, steps), between some of which there are arcs. The presence of an arc between two steps means that there are users who have watched them one after another. Each arc has a label containing the number of such users. An example of a transition graph for the steps of one lesson within a course:
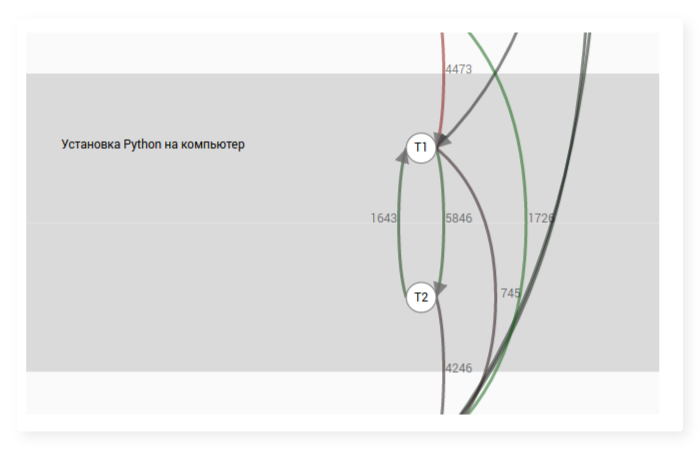
The process of building a transition graph is trivial: for each user, we consider all his actions in relation to the steps, sort them by time, and then count for each pair of steps how many times he performed the action with one of them immediately after the action with the other. Next, we summarize the frequencies for all users, and we get a general transition graph.
Initially, we introduced step-by-step graphs so that teachers could find out in which order students learn the materials of their courses. For ease of analysis, we calculate the average frequency of transitions between the steps in the course and paint the edges in the final graph green if the transition is more often expected, or red if less expected, and throw out rare transitions.
Fragment of the transition graph for one of the courses:
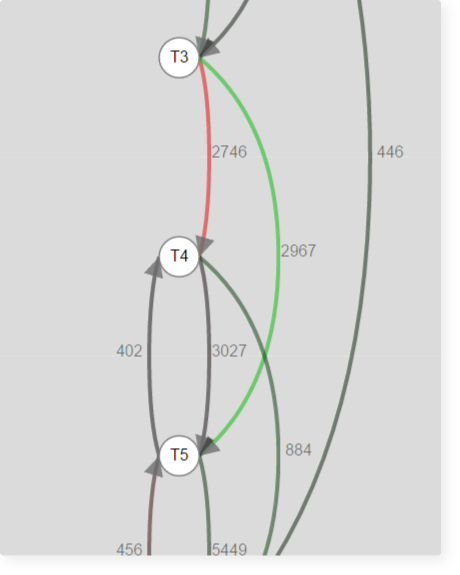
From this fragment it can be seen that the step with the T4 theory is passed more often than usual and proceeds to the next one.
Next, we began to build graphs of transitions, not only in steps, but also in lessons and tags, in order to use this in a recommender system. The transition graph for lessons is based on the same principle as for steps, just actions on steps are considered as actions on lessons to which these steps belong. For tags, the process is similar: actions with steps are translated into actions with their tags.
Handlers
Here we list the handler functions, each of which implements its own way of recommendations. The handler takes as user parameters, and, if the recommendation is contextual, then the lesson on which the user is currently located. Handler returns for user a list of lessons, each of which corresponds to a weight from 0 to 1. The greater the weight, the better the recommendation:
.
Suppose we want to recommend the user lessons on a specific tag, for which the proportion of lessons the user has completed is
. In case there is no transition graph on it, all his lessons gain weight.
. If there is a graph, then for each lesson this weight is divided by the distance in the graph to the nearest previous lesson passed by the user.
. Thus, the idea is realized that the user may be interested in passing the materials located in the graph of transitions near the already studied them.
Lessons with interesting user tags - Handler recommends lessons marked with tags that the user has already learned. To do this, use the above recommendation for tags, the weight of the lesson
for the user
will make up
.
Unfinished lessons - recommended lessons that the user started and did not finish, with the weight the greater, the more part of the lesson the user learned:
lesson share
Popular lessons - the handler does not use user information, but simply recommends the most popular lessons on the platform for the last week. Weight is directly proportional to popularity:
where
- lesson number
Lesson paths — paths that contain the lessons that the user has taken are used; lessons following the lessons are recommended, weighing the less the farther the lesson from those already passed:
where
- distance from the lesson
Tag transition graph - recommended lessons with tags that are followed by tags that interest the user. Weights depend on the user's progress on the tags, as well as on the relative frequency of transitions between the tags. Let be
- the frequency of the transition from the tag, the lessons of which the user has studied, to some tag
. Then for the lesson
.
Lessons on tags from similar users (collaborative filtering) - based on the tags of interest to the user, users with similar interests are identified and lessons with tags that they learn themselves are recommended. Let the current user
, with a measure of similarity between them -
(lies between 0 and 1, the larger it is, the more similar users are). Then the lesson
.
Lesson transition graph (only with contextual recommendations) - the handler recommends lessons that follow the current one in the transition graph, the weight depends on the relative frequency of the transition between the current lesson and the recommended one. If moving from current lesson to lesson
then
.
- Ways for lessons (only with contextual recommendations) - recommended lessons, following the current in any way, the weight is inversely proportional to the distance between the lessons:
where
- distance from the lesson
- If all previous handlers collectively recommended fewer lessons than needed, then random lessons are added to the recommendations, the weight of such lessons is 0.
Understood? Great, go ahead.

User reaction rating
In order to understand how successful the recommendation turned out, after its display we fix, whether the user followed the link, and also what part of the lesson the user eventually learned (value from 0 to 1). At the same time, the user has the opportunity to find out why the lesson was advised (the options correspond to the handlers), and mark the recommendation as not interesting to him.
As a result of each recommendation shown, we can match a number: corresponds to the rejection of the recommendations
- following the link without studying the lesson,
- following the link and learning the lesson completely; meaning from
before
- incomplete study of the lesson, and
- lack of reaction.
Formation issuance
So, we received lists of lessons from several handlers, in which each lesson is assigned a weight from 0 to 1. The more, the more successful the handler evaluates this recommendation. The question is, how best to combine them?
It would be easy for each lesson to add or multiply the weights of the handlers that advised him. But that would mean that we think different handlers are equally useful, which, generally speaking, may not be the case. I would like to evaluate each handler as a utility factor, using user reactions to the recommendations. Simple linear regression satisfies these requirements.
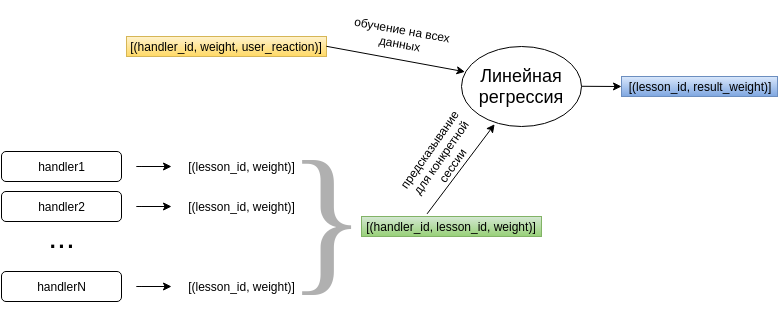
The regression model is trained using the accumulated data on how the recommendations of different handlers were evaluated by the user. Based on this, the model generates a weight vector for handlers. Further, when we need to recommend something to the student, the regression model for each lesson multiplies the weights of the handlers that offered it with a trained vector of parameters and gives the resulting weight for each recommended lesson.
Since we are so deep in the materiel, let's formally describe the regression model. If you know well what linear regression is, feel free to skip the next section.
Linear regression
Suppose we have a matrix whose strings
called observations , and columns as factors , and a column of values of the target or dependent variable
. Regression model
where
- model parameters, and
- random error, is called linear , if the dependence of the target variable on the factors is linear , that is,
.
Usually for convenience ( constant ) is inserted under the sum sign by adding a column of ones to the observation matrix:
for all
.
Using this notation, a linear regression model can be written as . The solution to this problem is the column
which minimizes the sum of squared deviations of the predicted values from the real ones, i.e.
.
This method of approximation is called the method of least squares ( ordinary least squares ) and is the most widely applicable in the context of solving a linear regression problem.
In our case, we can consider as observations, that is, rows of the matrix , recommended lessons, as factors of these observations, the weight that the handlers assigned to the lesson, and the values of the target variable — the user's recommendation rating.
So for lessons advised users
respectively for handlers
observation matrix
and a column of target variable values (user reaction)
will look like this:
Vector , which gives a minimal error in predicting the reaction of the user, contains an individual weight for each of the handlers, to which his recommendations should be multiplied. If the weight of one of the handlers is relatively large, then this handler makes a positive contribution to the recommendations, and vice versa.
For the work of the recommender system, the regression model is regularly retrained on data on user reactions to recommendations. We use the SciPy library to solve this problem and find the column . This library has already implemented a linear regression problem solution.
Understood? Great, just a little bit left.

Regularization
After the implementation of a linear regression recommender system that found a weights column for handlers minimizing the square of deviations of the user's real response from the predicted (
), we noticed that gradually the weight of one handler increases indefinitely, while the others decrease, which ultimately led to the formation of the issue almost exclusively from the results of this handler. This effect is called positive feedback , and is characterized by the fact that the deviation in the results of the system affects its further work, and the further, the more the results are shifted in the direction of this deviation.
In addition, since handlers can use very similar information about user activity, there may also be a problem of multicollinearity of factors in our data, which entails a weak isolation of the matrix and, as a result, solution instability.
As a result, we get a solution that gives a small error on the data on which it is trained, and a big one on real data. This situation is called overfitting the model.
As a solution to the problem of retraining, regularization can be considered. According to the book The Elements of Statistical Learning , the main methods of regularization are the lasso (LASSO, least absolute shrinkage and selection operator) and the ridge regression (Tikhonov's resolution, ridge regression). Both of these methods change the expression that we minimize in the process of finding a regression solution, adding to it a penalty for the norm of the vector .
In the case of lasso regularization is used -Norm and the solution is as

In the case of ridge regression, -norm and the solution looks like
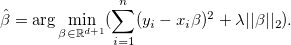
In both cases, the parameter is selected in the process of optimization.
Using lasso regularization reduces all weights and those that were already relatively small become equal to zero. Thus, the lasso method is well suited for the selection of significant factors (feature selection).
The ridge regression method also reduces the weights of the factors, but it never reduces them to zero, unless .
According to Andrew Ng , lasso regularization works better than combed one in a situation where the number of factors far exceeds the number of training observations. In the reverse situation, the ridge regression is more appropriate.
Accordingly, the ridge regression is better suited for our case. Its implementation is also present in the SciPy library, which made us very pleased.
Conclusion
In this article, we have dealt with how the recommendatory system for educational content on Stepic.org is implemented. Sometimes, probably, it was hard, but you succeeded! (If you, of course, do not just scroll to this place, then we advise you to go back and read)
See the recommendation system in action at https://stepic.org/explore/lessons — it lists recommended lessons for you to learn. But if you are logged on to the platform for the first time, then the recommendations may not be particularly relevant.
In the next and final article in this series, we will look directly at the adaptive system at Stepic and discuss the results of the work done: prediction accuracy, user preferences, and evaluate the statistics.
And finally, I would like to ask: Do you believe in adaptive online education ? Will it force out traditional courses? Can the most intelligent recommender system recommend educational content to a person as well and even better than a live teacher ?
')
Source: https://habr.com/ru/post/307670/
All Articles