From Slides Defined to Software Defined Networking. Part 2
In the previous article, we tried to acquaint readers with the architecture and key points of the Big Switch Networks SDN-solution from Big Cloud Fabric. In this part, we present an overview of the interaction interfaces and functionality of the factory.
Big Cloud Fabric Interface
As mentioned in the previous section, the factory controller is a single point of control, analytics and integration with external systems. Despite the fact that both a full-featured CLI and an extremely user-friendly web interface are available for configuration, monitoring, and troubleshooting, they are essentially clients for a single REST API. Many manufacturers offer REST interfaces for interacting with their products, but it so happens that in the world of network devices they are often less functional than CLI / WEB and do not provide access to all functions and mechanisms, which significantly limits their applicability. In turn, the approach that was chosen in BCF completely eliminates the loss of functionality — all that can be done in the CLI or in the web interface — is available for implementation using the REST API. Moreover, the process of using the REST API is made as convenient and simple as possible: just enter the debug rest command in the CLI and for each command entered in the CLI, the method, path and body of the request, as well as the code and body of the response will be displayed. Thus, to write a script to automate routine processes, there is no longer any need to sit on the documentation (which also exists) - it is enough to perform the required operations in the CLI once and make a template based on the conclusions.
Separately, I wanted to mention the web-management interface. It so happened in the networked world that the CLI console is considered the most convenient tool for configuring, troubleshooting. This is partly due to the fact that, before the advent of generally accepted APIs and the ability to execute scripts directly on hardware, the CLI provided more options for automating routine operations and was often much more informative than a web interface. However, in the BCF controller, the web-interface is so convenient, understandable and functional, that when testing our engineer almost did not use the services of the CLI - all the settings and diagnostic information were available in a convenient and understandable graphical interface. In addition to the excellent ergonomics and understandable logical structure, the web-interface contains a lot of seemingly insignificant but very useful details that form the feeling of satisfaction from working with it. For example, when adding a switch, you must choose which role it will occupy in the architecture (Spine or Leaf). But if one of these words is encountered in the name that is assigned to the switch, the role will be suggested automatically. Trifle, but nice.
')

Screenshot of the GUI home page (image is clickable)
Big Cloud Fabric Functionality
When we started testing BCF in the laboratory, a technique was developed based on practical experience. It included the functions and mechanisms that are guaranteed to occur in the data center, because we were not sure that a young product would have the same capabilities and support a similar set of mechanisms and protocols as the old-timers of the telecommunications market. However, already at the first stage of studying the documentation on BCF, we had to significantly increase the volume of tested functions, since all of them were really interesting and in demand. But most of all we were impressed by the fact that all the functions declared worked like a clock — not a single test failed or worked with comments. In general, the feeling of working with BCF can be briefly described as “quick, easy and convenient.”
The logical structure of BCF consists of elements that are understandable to any network specialist, and this distinguishes BCF from similar solutions from other manufacturers. The structural unit of the BCF logical structure is the tenant, which is actually a classic VRF. In the tenants, the broadcast segments and their routing interfaces are located, and the connection between them is carried out through the system router (system tenant). In the segments are the terminal physical or virtual hosts (end point). Interfacing with external devices can be organized both through static routing and using BGP. However, behind such simplicity of the logical structure is well-developed functionality and flexibility.
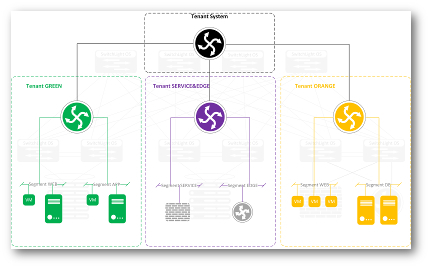
Logical diagram of the Big Cloud Fabric (clickable image)
In contrast to classic switches, servers transmitting packets with different VLAN IDs can become members of one broadcast segment, and at the same time the same VLAN ID can be assigned to different segments. There is no need to use backup protocols of the main gateway, there is actually no device that implements this function, i.e. any switch in the factory can rewrite the header and forward the packet to another subnet. Created access policies and service chains (ACL, Policy-based Routing) work throughout the factory, because they are associated not with specific switches or interfaces, but with the overlying logical structures.
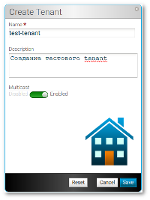 How powerful and at the same time simple the BCF tool is can be judged by the fact that switching and routing multicast traffic in a factory is configured only by switching the “Multicast Enable” slider in the tenant settings — after that the factory can route multicast traffic between subnets within the selected tenant, and each tenant can operate with the same set of multicast groups without the risk of incorrect packet transmission. Compare this with setting up multicast routing on a classic, large data center network - PIM, IGMP, IGMP snooping - and this is on each device.
Thus, despite the absence in the technical characteristics of the mention of familiar protocols, the centralized architecture of BCF not only allows you to implement any necessary functionality that is needed in data center networks, but also significantly expand it. This is especially noticeable when it comes to monitoring mechanisms, troubleshooting and analytics. The Fabric SPAN mechanism allows you to mirror the traffic of the entire factory, filtered by L2-L4 parameters to any port of any switch. For example, the task of mirroring the analytics tool for all HTTP traffic from a factory is solved by creating a single Fabric SPAN policy in about 2 minutes. In a classical data center network, the solution of such a task will not only take much longer, but will also require the use of additional equipment.
Another fairly common situation is that there is no connectivity between two servers using a specific protocol. In a classical network, in this case, an active troubleshooting begins: ping, traceroute, telnet, analysis of routing tables, ITU access lists, and so on - box by box, console by console. In BCF, a similar problem is solved simply by running the Test Path tool: it is enough to specify the addresses, protocol and ports of the source and destination, and the controller will display in graphical form the traffic path, point and description of the problem, if any. In this case, the tool has 2 modes of operation: the results of the first are based on the analysis of the tables that the controller has built and loaded onto the switches, and the second one checks how the required packet is processed on each switch and thus the actual traffic flow pattern is obtained. The process of troubleshooting using the Test Path tool usually takes no more than a minute and is performed from a single graphical interface.

Screenshot of the Test Path tool (clickable image)
Separately, I would like to talk about the possibilities of the factory to collect, process and provide analytical information. Again, thanks to the BCF architecture with the centralized Control Plane, the controller is a single point where raw data about the state of the switchboard hardware, interface counters, errors, logs, etc. flow. The controller processes the received information, correlates the events among themselves, stores the history and presents the result in a convenient, customizable form. The analysis includes both events occurring in the physical infrastructure (port problems, hardware problems, highly loaded interfaces, etc.) and logical structure events (switching on / off / moving a virtual machine, traffic intensity by host / segment, etc.). ). In fact, together with the network infrastructure of the data center, we get a powerful analytics system, without additional investments in the server for collecting and analyzing logs, as well as the database.

Screenshot of the analytical system Big Cloud Fabric (clickable image)
Source: https://habr.com/ru/post/307578/
All Articles