CodeRush for Roslyn: Part 3 - an overview of the possibilities for learning code
Every day a new code is created in the world. Lots of code. Some part of this code may be useful to you. Can reduce development costs or save your time. But to use the code, it is necessary to understand it, so lazy developers read more than they write. Quick understanding of how code works is a valuable skill that is acquired through years of practice. In this article we will describe how CodeRush for Roslyn (hereinafter CRR ) helps to read the code faster, even to those who have not mastered this skill perfectly. The article will be interesting to hackers and lazy developers.

How can a machine help you learn code?
If you open the source code of any program in Notepad, it will be something like this:
')
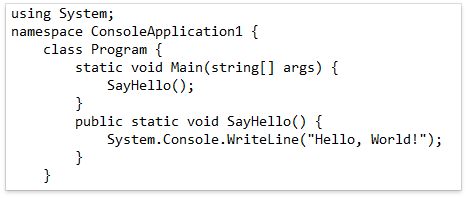
To make the code easier to understand, you can highlight keywords. In the simplest implementation, this can be done, for example, by text searching for keywords. Or implement a regular expression code coloring, as done in Far Manager.

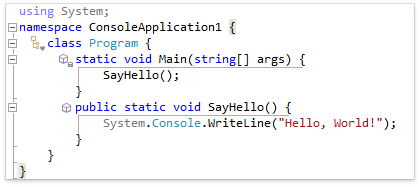
When the code is compiled, its lexical and syntactic parsing occurs. The result of the parser is usually a tree. Using information from the syntax tree, Visual Studio can define the boundaries of structural blocks and make coloring of literals.

Syntax tree for SayHello () method

But on the penultimate image there is a coloring for which a syntactic tree is not enough. This is the line “using System”. In order for this line to become gray, you need to analyze information about the use of types - the semantic model. From the semantic model you can get information about the relationships between types. For example: base classes and their descendants, implementation of interfaces, method overloading, searching for links. search for places to use classes.
Well, finally, to understand the code, it is launched under the debugger and see how it works.
Thus, in addition to the actual source text, the developer of extensions for Visual Studio has at least three more sources of data about it:
How does CRR use this information to help code research?
CRR adds to the standard studio visualization of structural lighting and icons in the beginning of the methods. Structural highlighting is based on the syntax tree.
Icons contain information about the scope and type of language design and are perceived by a person more quickly. Structural highlighting also works in XAML.

Many people like navigation in ILSpy, when you can find all the places where a method is called, a property is used or set. In CRR, there is a References window for this, which visualizes the information found in the semantic model. In contrast to the standard studio link search, in our References window, grouping, filtering, and built-in code review are implemented. Filtering is implemented not only by the name of the entity, but also by the type of its use.

Links can be searched for anything, not just methods or properties. For example, this is the result of searching for links to an element of an enumeration.

References embedded in References are shown at the bottom of the image. Thanks to him, when viewing links does not change the current tab with the code. But, if necessary, the link in the studio code editor will open by double-clicking.
The engine that works in References is also available as a pop-up UI. In CRR, this feature is called JumpTo . In addition to the semantic model, JumpTo uses data about the project structure.

JumpTo even works in XAML . When using MVVM, the CRR pattern can find the ViewModel and correctly navigate from XAML to the model code.

In addition to the options shown, JumpTo can navigate by heirs and base types, by overloaded methods, by project files. To call JumpTo, press Ctr + Alt + N. Unlike References , JumpTo focuses more on transitions than on learning the code, so when you select an item in the list of issue, you navigate to it without a preview.
In addition to navigation, which is provided by References and JumpTo , the CRR has a manual navigation mechanism. These are bookmarks. Standard Bookmark, can navigate to the exact line. Bookmarks in CRR “two-dimensional”.

In addition to the tabs, the last image shows markers. Red markers can be put most, blue place some of our features. For example, DropMarkerBeforeJump . A marker differs from a bookmark in that it disappears when it returns to it.
When debugging, CRR can show the values of local variables and predict transitions. In this image, you can see that our Debug Visualizer reduced the brightness of a fragment of code for which the condition did not work. Thus, when debugging code, there is no need to view the code from an inactive branch.

CRR helps to quickly understand the code due to its structural highlighting, the References window, advanced JumpTo navigation, and improved visualization in the debugger.
You can download it in the Visual Studio Gallery .
This is an article in a series of articles on CRR.
Previous articles:
CodeRush for Roslyn: Part 2 - feature overview for better code
CodeRush for Roslyn: Part 1 - useful features for development through testing
How can a machine help you learn code?
If you open the source code of any program in Notepad, it will be something like this:
')
To make the code easier to understand, you can highlight keywords. In the simplest implementation, this can be done, for example, by text searching for keywords. Or implement a regular expression code coloring, as done in Far Manager.
When the code is compiled, its lexical and syntactic parsing occurs. The result of the parser is usually a tree. Using information from the syntax tree, Visual Studio can define the boundaries of structural blocks and make coloring of literals.
Syntax tree for SayHello () method
But on the penultimate image there is a coloring for which a syntactic tree is not enough. This is the line “using System”. In order for this line to become gray, you need to analyze information about the use of types - the semantic model. From the semantic model you can get information about the relationships between types. For example: base classes and their descendants, implementation of interfaces, method overloading, searching for links. search for places to use classes.
Well, finally, to understand the code, it is launched under the debugger and see how it works.
Thus, in addition to the actual source text, the developer of extensions for Visual Studio has at least three more sources of data about it:
- Roslyn Syntax Tree
- Roslyn Semantic Model
- Debug information
How does CRR use this information to help code research?
CRR adds to the standard studio visualization of structural lighting and icons in the beginning of the methods. Structural highlighting is based on the syntax tree.
Icons contain information about the scope and type of language design and are perceived by a person more quickly. Structural highlighting also works in XAML.
Many people like navigation in ILSpy, when you can find all the places where a method is called, a property is used or set. In CRR, there is a References window for this, which visualizes the information found in the semantic model. In contrast to the standard studio link search, in our References window, grouping, filtering, and built-in code review are implemented. Filtering is implemented not only by the name of the entity, but also by the type of its use.
Links can be searched for anything, not just methods or properties. For example, this is the result of searching for links to an element of an enumeration.
References embedded in References are shown at the bottom of the image. Thanks to him, when viewing links does not change the current tab with the code. But, if necessary, the link in the studio code editor will open by double-clicking.
The engine that works in References is also available as a pop-up UI. In CRR, this feature is called JumpTo . In addition to the semantic model, JumpTo uses data about the project structure.
JumpTo even works in XAML . When using MVVM, the CRR pattern can find the ViewModel and correctly navigate from XAML to the model code.
In addition to the options shown, JumpTo can navigate by heirs and base types, by overloaded methods, by project files. To call JumpTo, press Ctr + Alt + N. Unlike References , JumpTo focuses more on transitions than on learning the code, so when you select an item in the list of issue, you navigate to it without a preview.
In addition to navigation, which is provided by References and JumpTo , the CRR has a manual navigation mechanism. These are bookmarks. Standard Bookmark, can navigate to the exact line. Bookmarks in CRR “two-dimensional”.
In addition to the tabs, the last image shows markers. Red markers can be put most, blue place some of our features. For example, DropMarkerBeforeJump . A marker differs from a bookmark in that it disappears when it returns to it.
When debugging, CRR can show the values of local variables and predict transitions. In this image, you can see that our Debug Visualizer reduced the brightness of a fragment of code for which the condition did not work. Thus, when debugging code, there is no need to view the code from an inactive branch.
CRR helps to quickly understand the code due to its structural highlighting, the References window, advanced JumpTo navigation, and improved visualization in the debugger.
You can download it in the Visual Studio Gallery .
This is an article in a series of articles on CRR.
Previous articles:
CodeRush for Roslyn: Part 2 - feature overview for better code
CodeRush for Roslyn: Part 1 - useful features for development through testing
Source: https://habr.com/ru/post/307346/
All Articles