About clouds and sensors: connecting Intel NUC and Genuino 101 to the IBM Watson IoT platform
Our story today is about using the Intel Next Unit Computing (NUC) compact computer to connect sensors connected to the Genuino 101 board to the IBM Watson IoT platform. From this material, you will learn how, in real time, to read information from sensors connected to Genuino 101, immediately view them on the NUC and send it to the IBM Watson cloud. There, data can be stored, processed, visualized. In order to do all this, use the Node-RED installed on the NUC. The Node-RED graphical interface allows you to create flowcharts that implement the functions of data input, processing and output, that is, everything that underlies the IoT applications.
In order to try out everything that will be discussed, in practice, you will need the following:
Details about connecting Intel gateways for the Internet of things to the IBM Watson cloud can be found here , about working with the IoT Developer Kit here .
')
Connect to Intel IoT Gateway Developer Hub by entering the IP address NUC in your browser. When requesting a name and password, use both for that and for the other gwuser . After connecting, basic information about the NUC will be displayed, in particular, the model number, version, Ethernet address and network information.
Click the Sensors icon, then click Manage Sensors to open the Node-RED window. Here, by default, there will be a Sheet 1 sheet, on which is placed the standard block diagram for RH-USB sensors. In this project, however, such sensors are not used, so at this step you need to select the entire flowchart and delete it. Now we have a blank sheet on which we will work.
On the left side of the Node-RED interface is a set of nodes. These are the functional blocks for creating Node-RED applications in the NUC. In our case, you will need the nodes shown below.
Nodes used in the example
These nodes must be dragged into the workspace and placed as shown in the figure below. Some nodes are used several times. The nodes are connected using the mouse. Please note that we will need the Watson IoT node later; it is not included in the current version of the Node-RED flowchart.
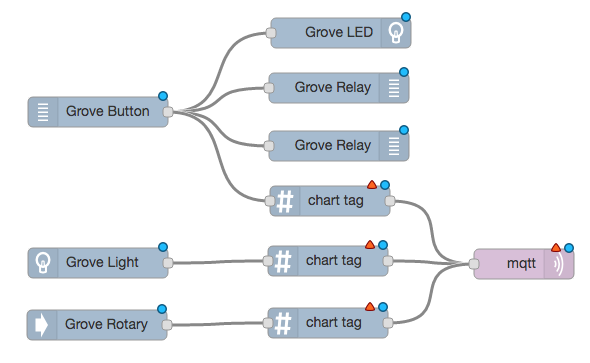
Placing nodes in the Node-RED workspace
Nodes that have just been placed in the workspace need additional configuration, otherwise our project will not work. To configure a node, double click on it. And when the parameters panel opens, make the necessary configuration changes.
The table below shows the settings that are required for the nodes. In some cases, the Name field remains blank (in this case, the standard node name is used). The pin numbers correspond to the connectors of the baseplate to which the corresponding sensor or actuator is connected.
Nodes and their settings
After making the settings, you should check everything to see if the sensors are connected securely. Now you can click on the Deploy button, it is responsible for deploying the application to the NUC and launching it. If the application runs smoothly, in the upper part of the Intel IoT Gateway Developer Hub window you can see the information that comes from the sensors in real time. These are the readings of the rotation angle sensor (Rotary), the light sensor (Light), and also the data from the button (Button).
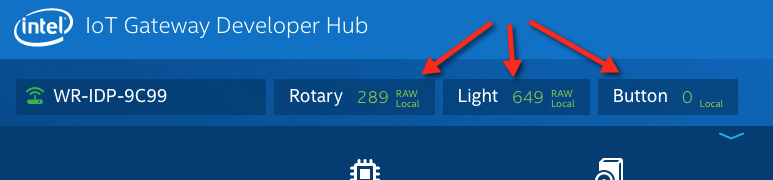
An application created in Node-RED is running on the NUC and displays data in the Intel IoT Gateway Developer Hub windows.
If you rotate the lever of the angle sensor or cover the light sensor - the indicators in the corresponding fields should change. If you press the button, the LED lights up, the buzzer turns on, and the relay is energized.
Now it's time to add a node for the IBM Watson cloud IoT platform to our application. With it, you can send data to the Quickstart service. Quickstart allows you to connect to Watson very quickly and with minimal loss of setup time. Often this service is used in the initial stages of developing new IoT applications.
Complete the flowchart in the Node-RED editor with an output node Watson IoT . When a node is in the workspace, its name will change to IBM IoT Device . Route the connecting line from the output of the Grove Rotary node to the input of the new node. Double-click on this node and configure its parameters as shown below. Do not forget about the node name (the Name field) - enter Watson IoT Quickstart into it. Identifier (Id) Quickstart is automatically generated, you do not need to change it.
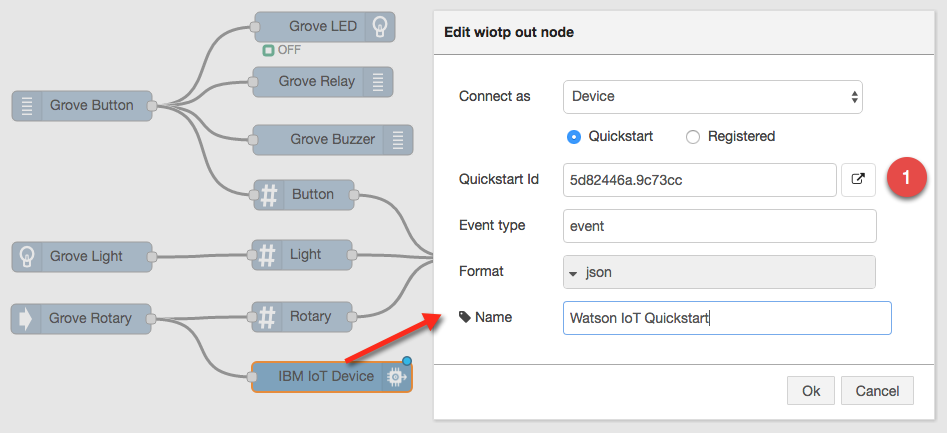
Configuring settings for the IBM IoT Device node
After making changes to the site settings, click OK , and then click the Deploy button. The program already installed on the NUC will be updated. At this point, the Grove Angle Sensor values will begin, once per second, to enter Quickstart. To view this data in Quickstart, in the Node-RED workspace, double-click on the Watson IoT Quickstart node , then click on the button with a link to Quickstart (it is marked with “1” in the figure above and is located to the right of the Quickstart id field). If you do this, the Quickstart page will open in your browser, and a real-time graph of the rotation angle sensor will be displayed on it. If you twist the handle of the sensor, the graph, respectively, will change.
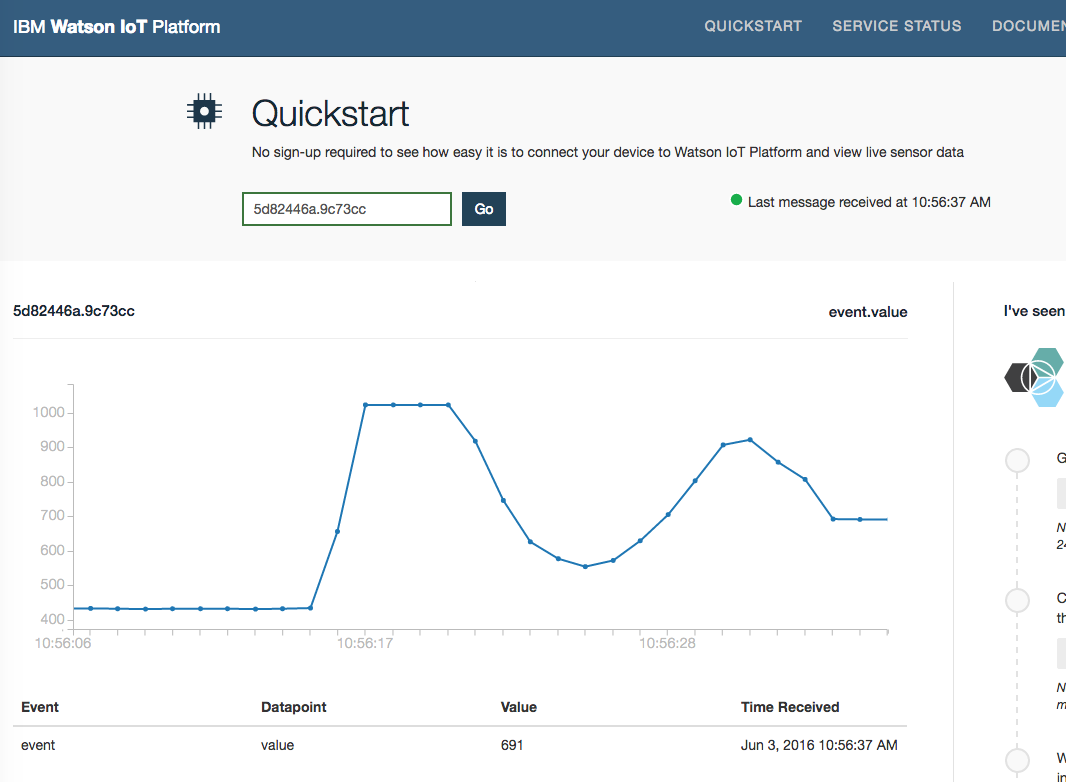
Sensor readings are displayed in Quickstart.
Each new portion of the indicators received from the sensor connected to the Genuino 101 board and transmitted to the Watson cloud using the NUC is displayed at the bottom of the screen along with information about the time of data acquisition. This data should correspond to those that can be observed locally in the Intel IoT Gateway Developer Hub. In order to check whether this data is transmitted correctly, you can compare what is seen in Quickstart with what is displayed in Developer Hub.
Based on the example that we reviewed here, you can create complex applications that use sensors connected to the Genuino 101 board and the NUC computer as a tool for organizing work with the IBM Watson cloud-based IoT platform. If you’ve done everything we’ve talked about here, now you’ll probably want to bring a few more sensors to Quickstart, to check if this information is correctly transmitted to the cloud.
Surely, you already have the idea of your own application for the Internet of things, using all that we have told you about. So now is the time to register with IBM Watson and get started. Good luck!
In order to try out everything that will be discussed, in practice, you will need the following:
- Intel NUC computer connected to the Internet. In our project, it acts as an IoT gateway.
- Genuino 101 related to NUC via USB.
- Seed Studio Grove base expansion card, connected to Genuino 101 and transferred to 3V3 VCC mode.
- Grove sensors connected to the base board: a light sensor connected to connector A1, a rotation angle sensor on connector A2, a button (connector D4), a green LED (D5), a buzzer (D6) and a relay (D7).
Details about connecting Intel gateways for the Internet of things to the IBM Watson cloud can be found here , about working with the IoT Developer Kit here .
')
Reading sensor readings and data output in Intel IoT Gateway Developer Hub
Connect to Intel IoT Gateway Developer Hub by entering the IP address NUC in your browser. When requesting a name and password, use both for that and for the other gwuser . After connecting, basic information about the NUC will be displayed, in particular, the model number, version, Ethernet address and network information.
Click the Sensors icon, then click Manage Sensors to open the Node-RED window. Here, by default, there will be a Sheet 1 sheet, on which is placed the standard block diagram for RH-USB sensors. In this project, however, such sensors are not used, so at this step you need to select the entire flowchart and delete it. Now we have a blank sheet on which we will work.
On the left side of the Node-RED interface is a set of nodes. These are the functional blocks for creating Node-RED applications in the NUC. In our case, you will need the nodes shown below.
Nodes used in the example
 | Read button presses |  | LED (on or off) |
 | Light level measurement |  | Formatting output to NUC |
 | Rotation angle measurement |  | Sending data to the Watson IoT platform |
 | Relay (open or closed) |  | Sending data to the Watson IoT platform |
These nodes must be dragged into the workspace and placed as shown in the figure below. Some nodes are used several times. The nodes are connected using the mouse. Please note that we will need the Watson IoT node later; it is not included in the current version of the Node-RED flowchart.
Placing nodes in the Node-RED workspace
Nodes that have just been placed in the workspace need additional configuration, otherwise our project will not work. To configure a node, double click on it. And when the parameters panel opens, make the necessary configuration changes.
The table below shows the settings that are required for the nodes. In some cases, the Name field remains blank (in this case, the standard node name is used). The pin numbers correspond to the connectors of the baseplate to which the corresponding sensor or actuator is connected.
Nodes and their settings
| Block diagram node Options |
|
| Grove light |
|
| Grove Rotary (angle sensor) |
|
| Grove led |
|
| Grove Relay (top) |
|
| Grove Relay (bottom) |
|
| chart tag connected to Grove |
|
| chart tag connected to Grove |
|
| chart tag connected to Grove |
|
| mqtt |
|
After making the settings, you should check everything to see if the sensors are connected securely. Now you can click on the Deploy button, it is responsible for deploying the application to the NUC and launching it. If the application runs smoothly, in the upper part of the Intel IoT Gateway Developer Hub window you can see the information that comes from the sensors in real time. These are the readings of the rotation angle sensor (Rotary), the light sensor (Light), and also the data from the button (Button).
An application created in Node-RED is running on the NUC and displays data in the Intel IoT Gateway Developer Hub windows.
If you rotate the lever of the angle sensor or cover the light sensor - the indicators in the corresponding fields should change. If you press the button, the LED lights up, the buzzer turns on, and the relay is energized.
Send data to the cloud and the Quickstart service
Now it's time to add a node for the IBM Watson cloud IoT platform to our application. With it, you can send data to the Quickstart service. Quickstart allows you to connect to Watson very quickly and with minimal loss of setup time. Often this service is used in the initial stages of developing new IoT applications.
Complete the flowchart in the Node-RED editor with an output node Watson IoT . When a node is in the workspace, its name will change to IBM IoT Device . Route the connecting line from the output of the Grove Rotary node to the input of the new node. Double-click on this node and configure its parameters as shown below. Do not forget about the node name (the Name field) - enter Watson IoT Quickstart into it. Identifier (Id) Quickstart is automatically generated, you do not need to change it.
Configuring settings for the IBM IoT Device node
After making changes to the site settings, click OK , and then click the Deploy button. The program already installed on the NUC will be updated. At this point, the Grove Angle Sensor values will begin, once per second, to enter Quickstart. To view this data in Quickstart, in the Node-RED workspace, double-click on the Watson IoT Quickstart node , then click on the button with a link to Quickstart (it is marked with “1” in the figure above and is located to the right of the Quickstart id field). If you do this, the Quickstart page will open in your browser, and a real-time graph of the rotation angle sensor will be displayed on it. If you twist the handle of the sensor, the graph, respectively, will change.
Sensor readings are displayed in Quickstart.
Each new portion of the indicators received from the sensor connected to the Genuino 101 board and transmitted to the Watson cloud using the NUC is displayed at the bottom of the screen along with information about the time of data acquisition. This data should correspond to those that can be observed locally in the Intel IoT Gateway Developer Hub. In order to check whether this data is transmitted correctly, you can compare what is seen in Quickstart with what is displayed in Developer Hub.
What's next?
Based on the example that we reviewed here, you can create complex applications that use sensors connected to the Genuino 101 board and the NUC computer as a tool for organizing work with the IBM Watson cloud-based IoT platform. If you’ve done everything we’ve talked about here, now you’ll probably want to bring a few more sensors to Quickstart, to check if this information is correctly transmitted to the cloud.
Surely, you already have the idea of your own application for the Internet of things, using all that we have told you about. So now is the time to register with IBM Watson and get started. Good luck!
Source: https://habr.com/ru/post/307136/
All Articles