How to display dynamic unloading from the database on Atlassian Confluence pages?
There is a huge amount of wiki engines for corporate knowledge bases on the market. If you use Atlassian Confluence , you will probably be interested to learn how to expand the standard wiki-capabilities of the system. And use Confluence, including, in the form of a storefront to dynamically display any useful information, for example:
- your product metrics
- Agile team metrics
- graphs of the growth of your team,
- list of the nearest birthdays,
- etc.
Solvable problem
For clarity, I will consider the task of accounting for your company's employees, using the example of famous scientists of the past. That is, in the DBMS there is a table, each entry of which is an individual employee, each field of this entry is a characteristic of the employee (full name, date of birth, telephone ...). For simplicity, Atlassian JIRA DBMS will be used as a DBMS, which stores information about projects, tasks, etc.
Ways to display results
And so, we come to the most interesting - how dynamic information will look on the pages of Confluence. Below you can compare several ways to display information on employees.
')
0. JIRA filter
Before displaying information on the page in Confluence, let's see how it will look in JIRA.
To do this, you need to write a simple query, select the columns of interest to display:
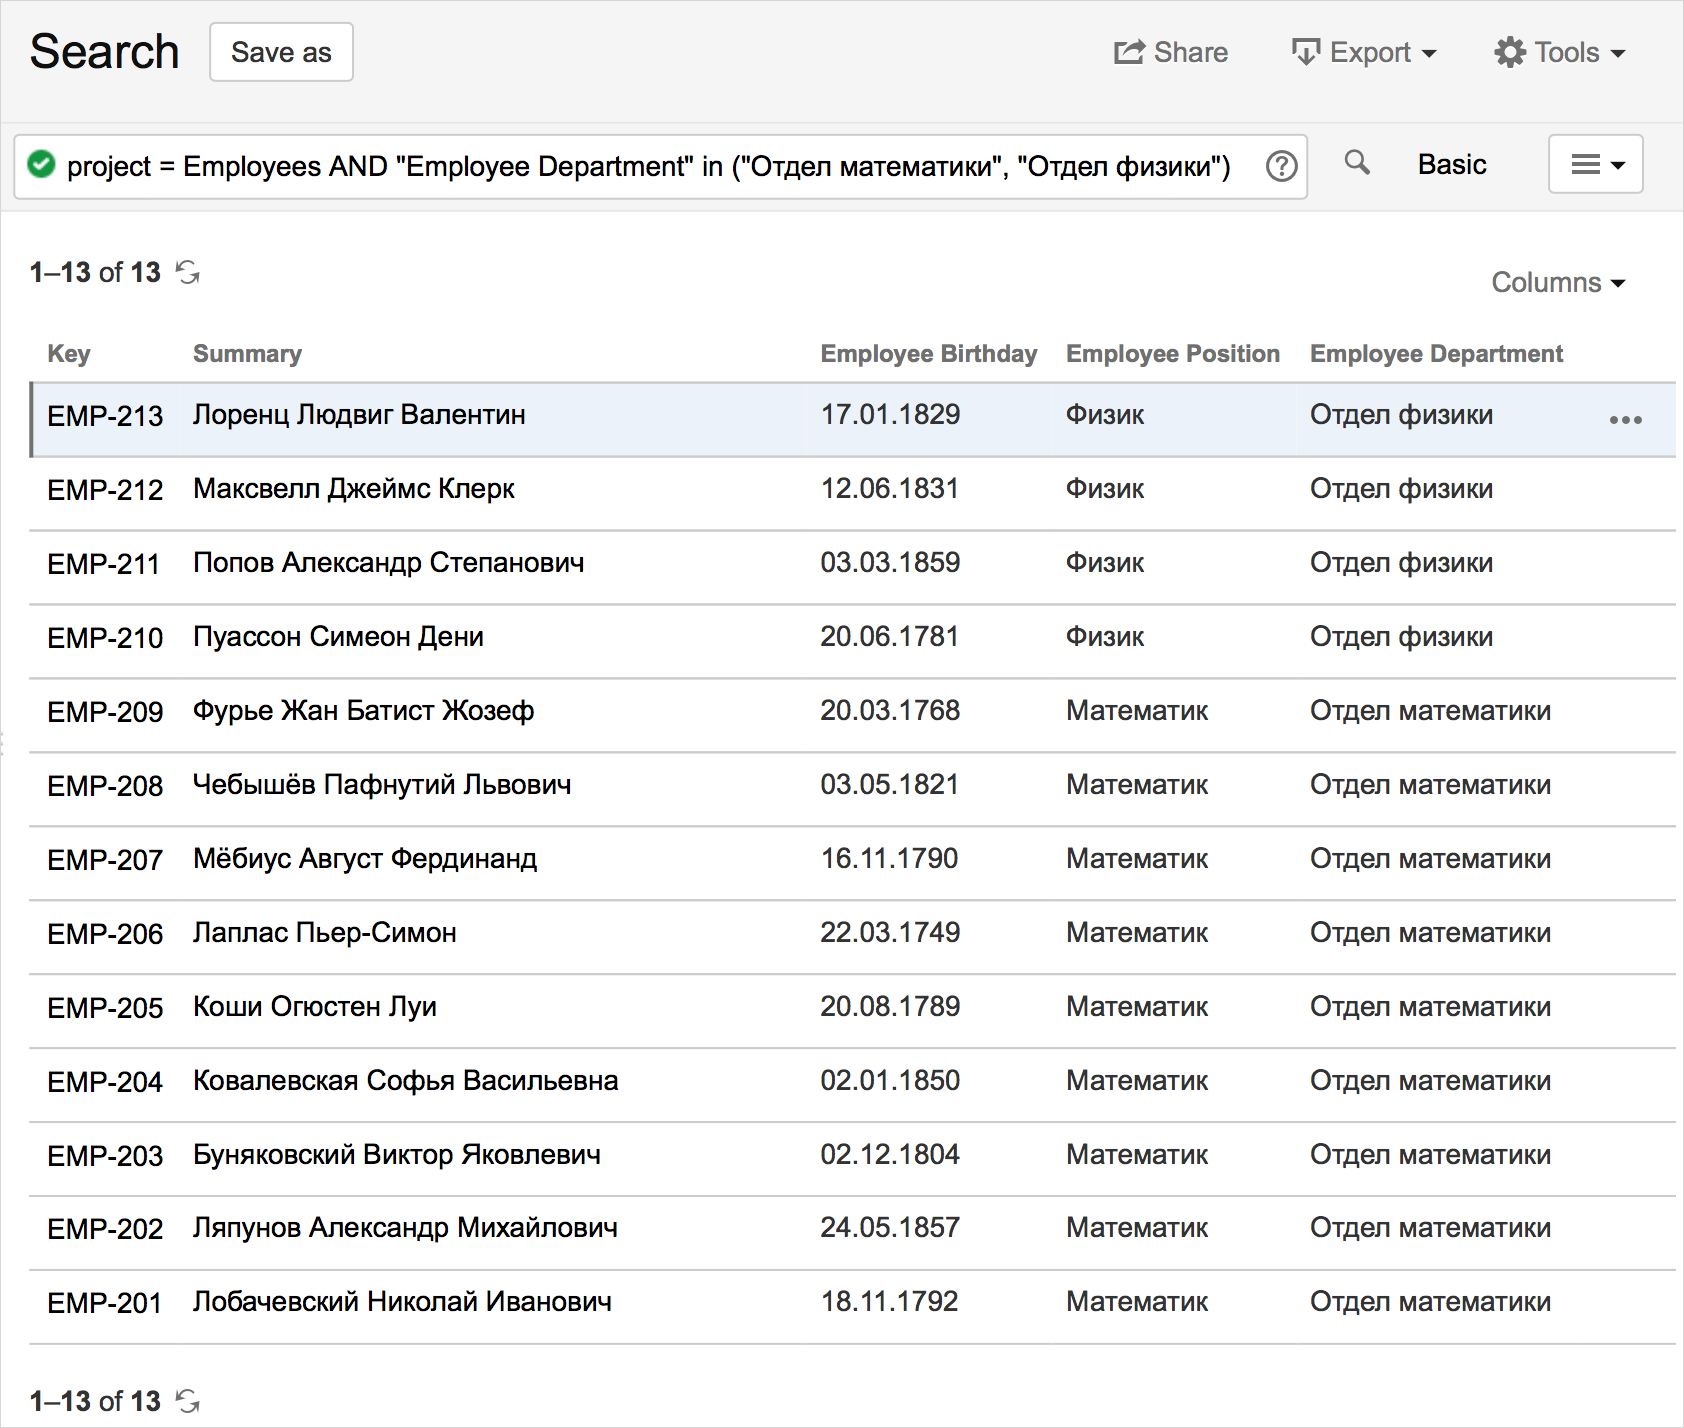
And, for the future, save the query as a filter:

1. JIRA Macro
It’s no secret that Atlassian products have tight integration with each other. For example, on the Confluence page, in a couple of clicks, you can display a list of tasks in a particular project, or according to a specified filter.
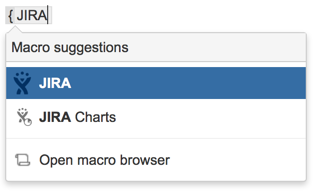
First you need to add a macro:
Then write a request with the JIRA project and the staff departments:
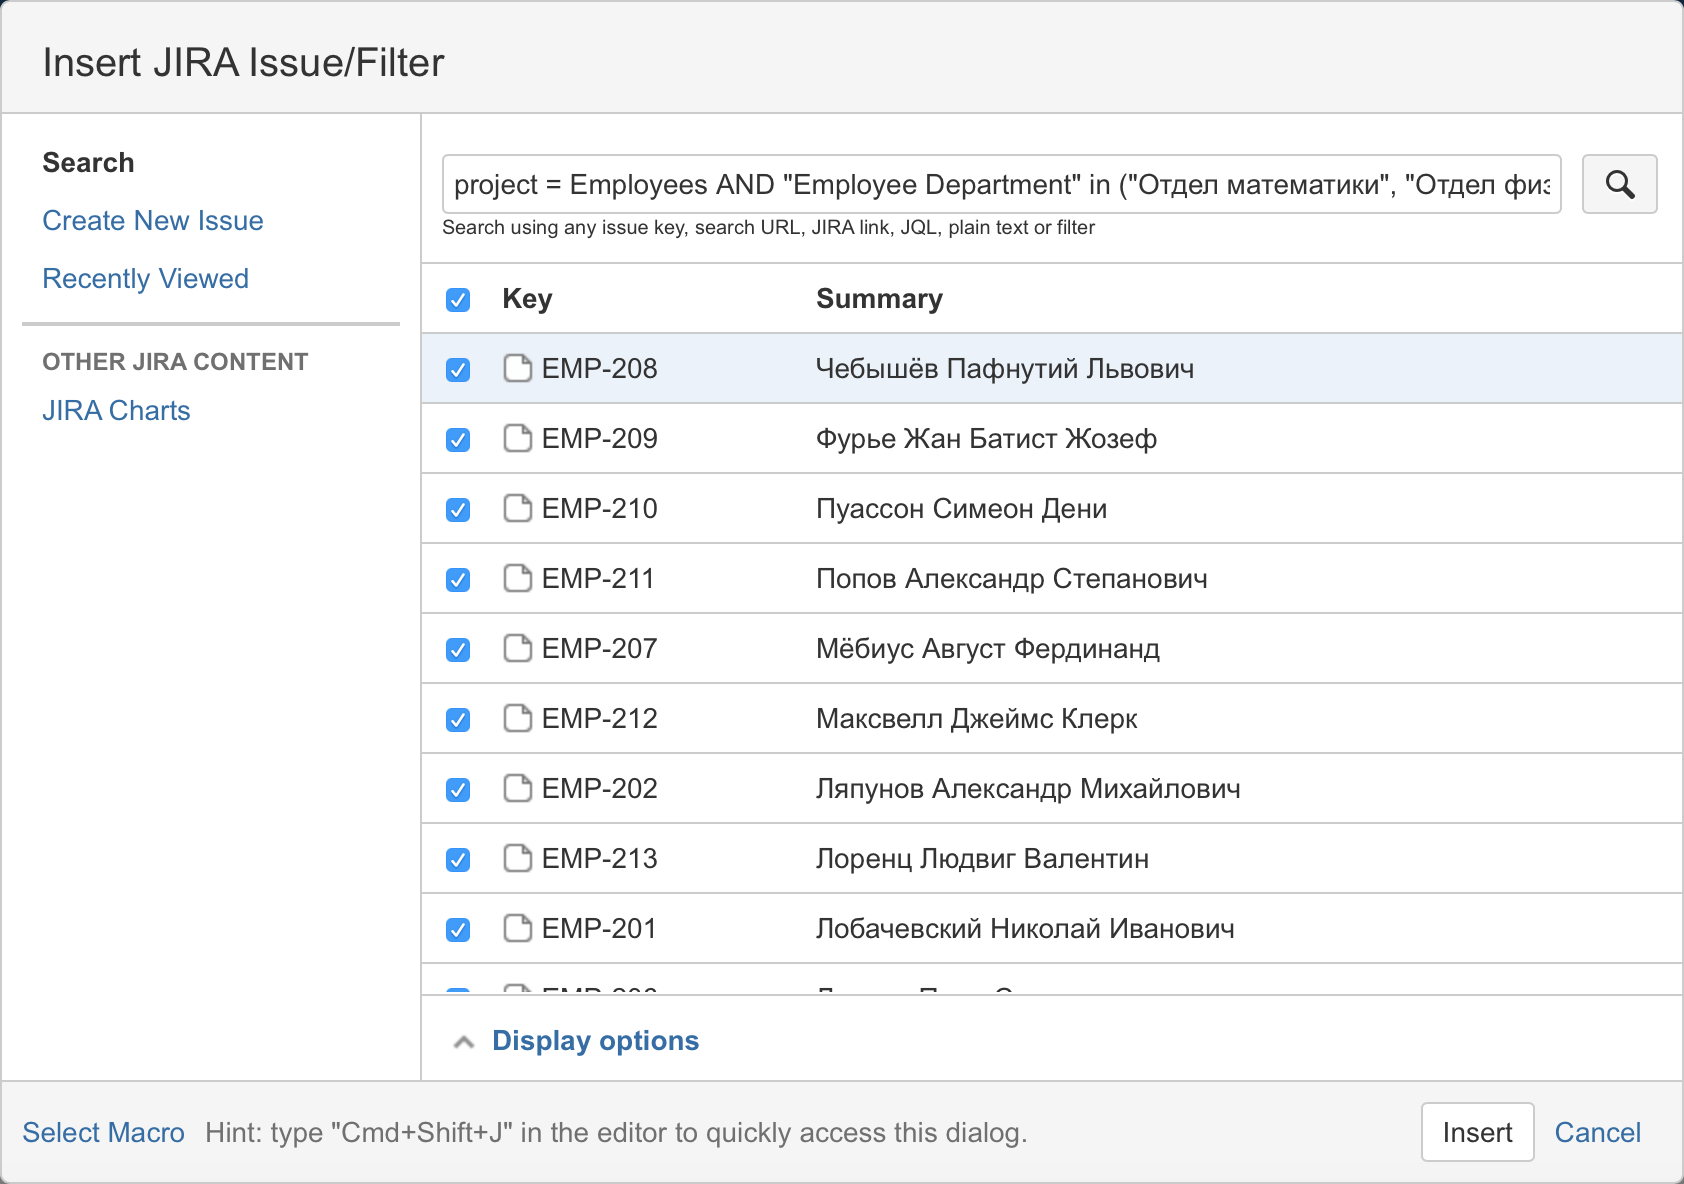
Then select the columns to display in the summary table:

And this is the result:

The resulting table is dynamically updated when the Confluence page reloads, or when you click on “Refresh”.
In addition, the table can be sorted by clicking on the column names. The names of the columns coincide with the names of the fields, they can not be renamed. A paging is also available, in case there are too many entries (in our example, the page size is 20 entries).
2. JIRA gadget
Many JIRA users use portlets / gadgets to display important project information on dashboards:

Here is the list of employees on the JIRA gadget:

Maybe not everyone knows that JIRA gadgets can be displayed on the pages of Confluence . The only difference from the previous case is that the HTML code is generated on the JIRA side and displayed in Confluence unchanged.
3. Direct SQL query
After experimenting with particular cases of JIRA mapping mechanisms, we move on to the more general case of an arbitrary DBMS and queries to it.
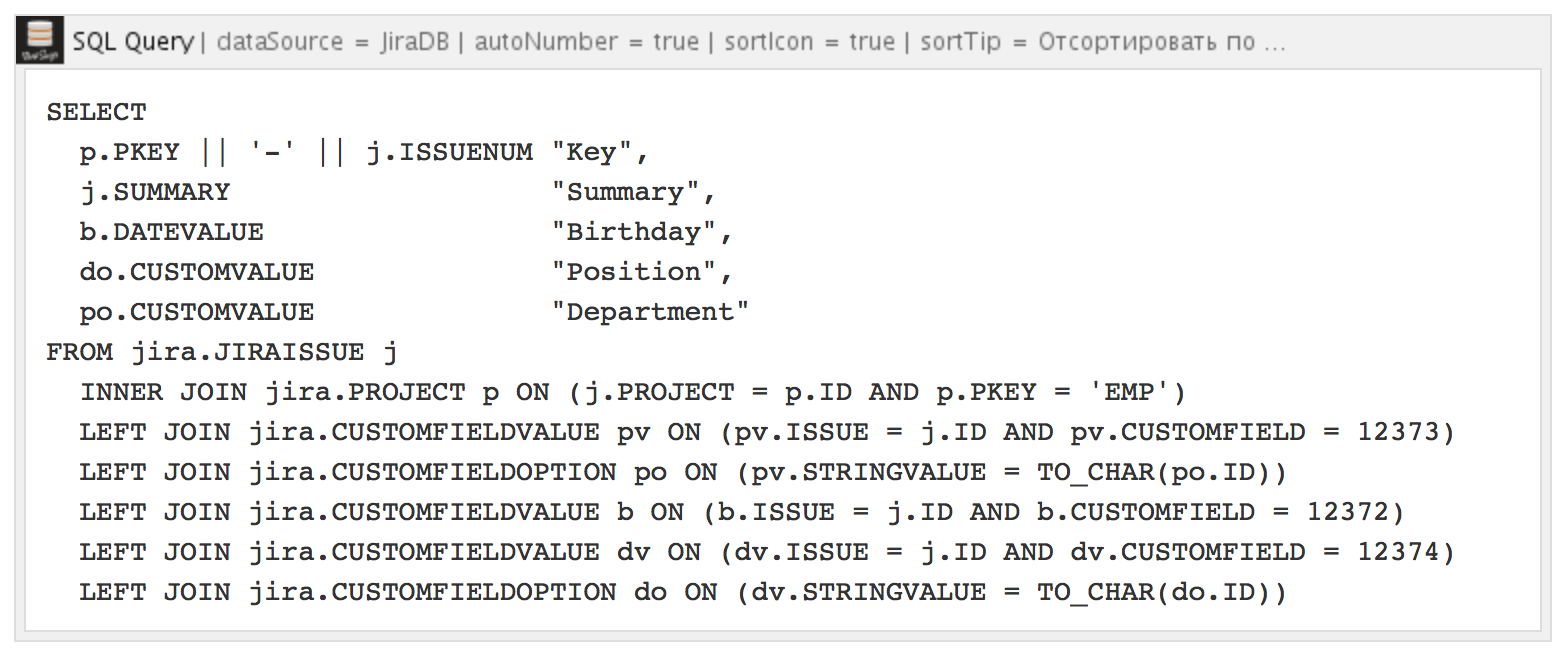
For clarity of comparison, I wrote a SQL query to the same JIRA DBMS:

Unlike the previous three cases, it will be launched through the usual JDBC, without integration mechanisms between Confluence and JIRA.
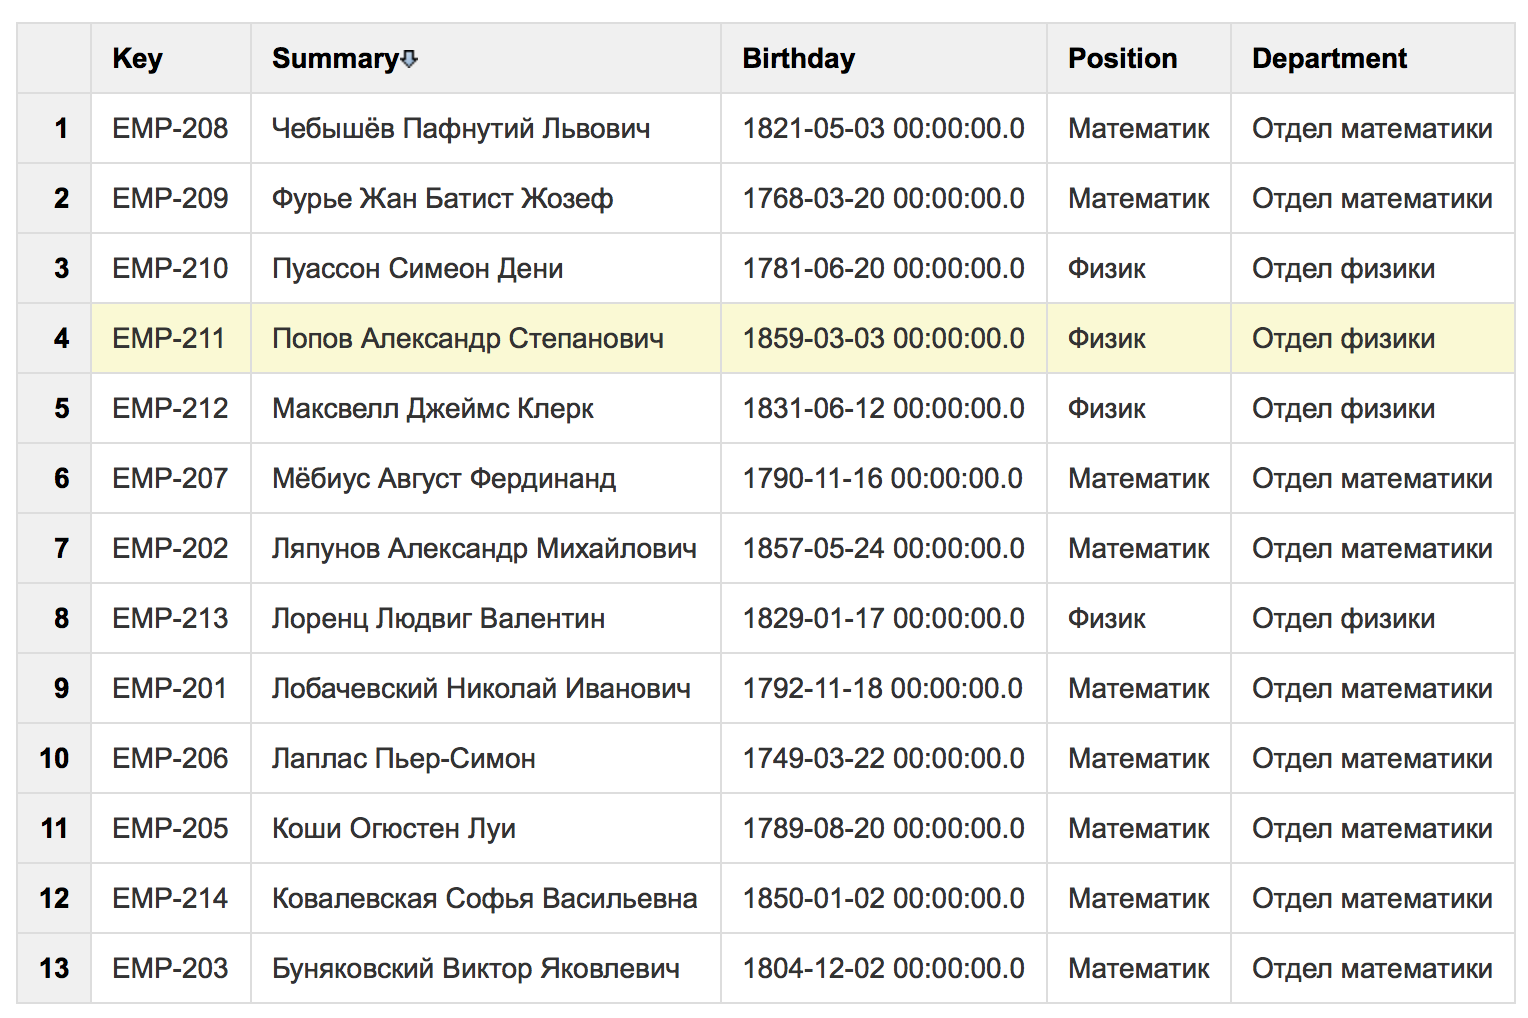
Here is the result of the query in the development environment:

To run this query and view the results on the Confluence page, there is a SQL for Confluence macro from Bob Swift:
Here is the result of the query:
Unlike previous mechanisms, in SQL for Confluence there is no possibility of paginal output of results. But in the macro settings, you can turn off the auto-numbering of the rows of the executed query. In addition, it is possible to calculate the sum, average, maximum value by columns (in our example, irrelevant).
From a security point of view, the macro allows you to perform an arbitrary SQL query on the DBMS. To prevent data leakage or corruption, you must, first, configure the rights of the technical user from which SQL queries are run. At a minimum, disable recording. Secondly, to limit the rights in Confluence to edit the page with the request.
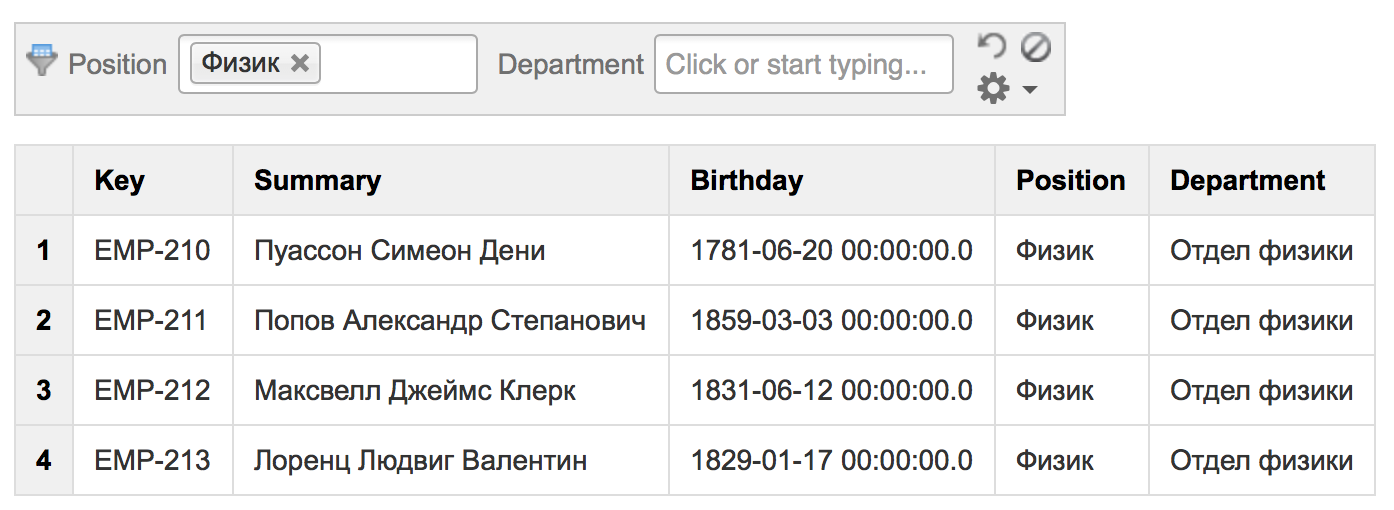
To add the ability to filter the results of queries, the SQL for Confluence macro works well together with another macro - Table Filter for Confluence from StiltSoft:
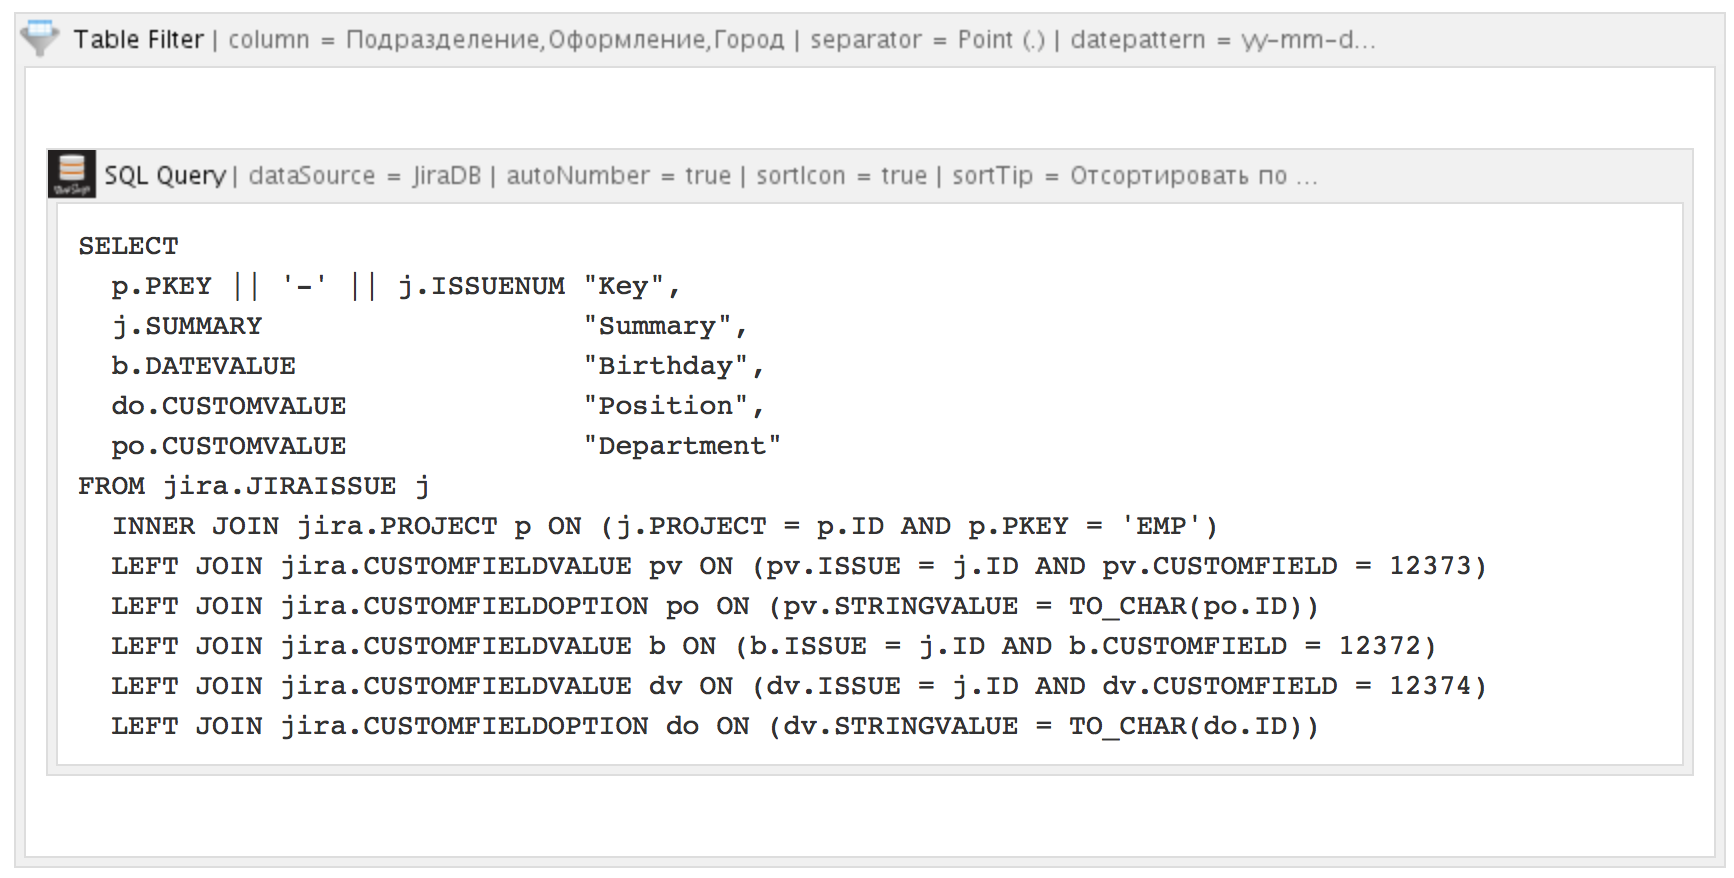
As a result, a set of fields is attached to the table above, by changing the values of which you can filter:
4. eazyBI
And the final, the richest and most complex macro called eazyBI is offered by the eponymous company. This product is tailored to the solution of more complex tasks in the direction of BI, deserves a separate article. But eazyBI is quite suitable for our task.
First, you need to configure the data source and specify the SQL query to select data:
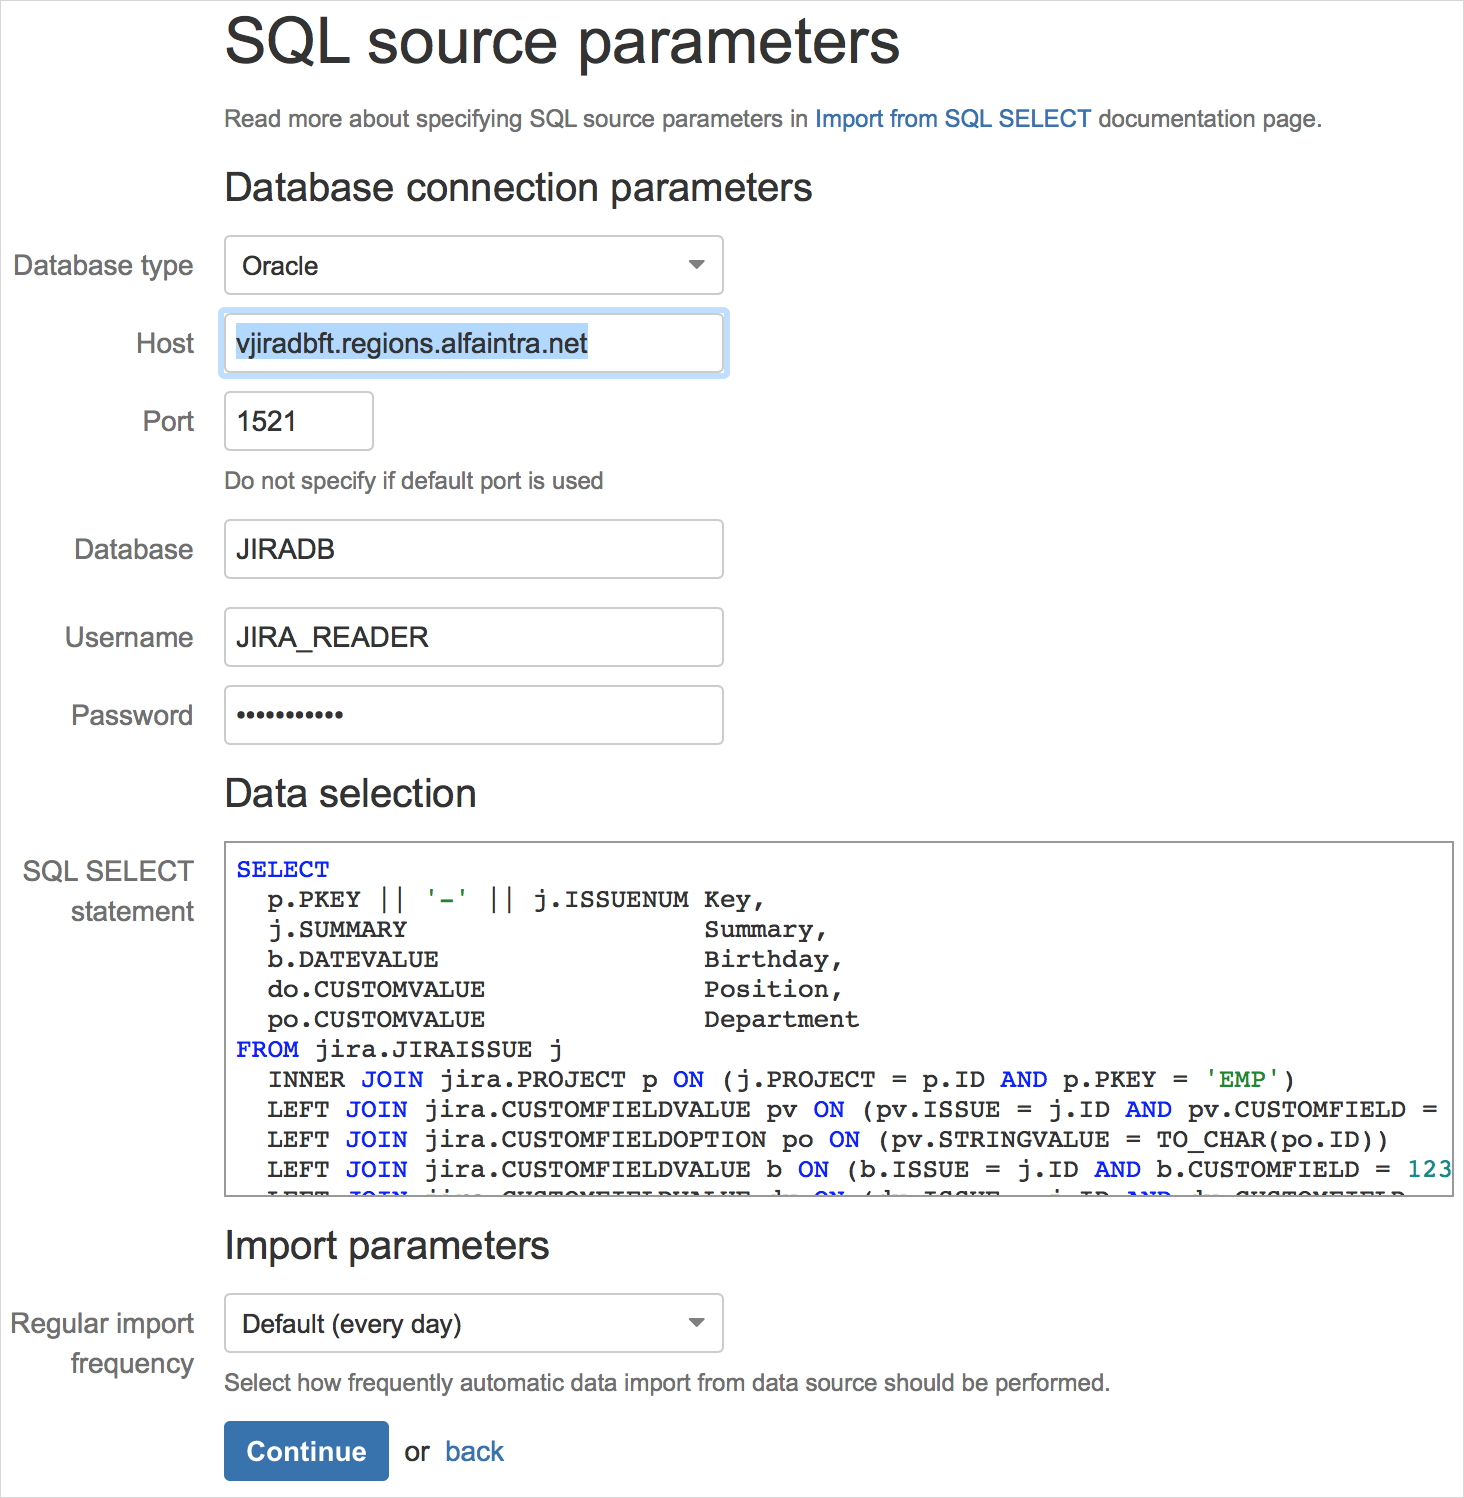
The eazyBI engine will execute the query, unload the column names and the first rows of the result:
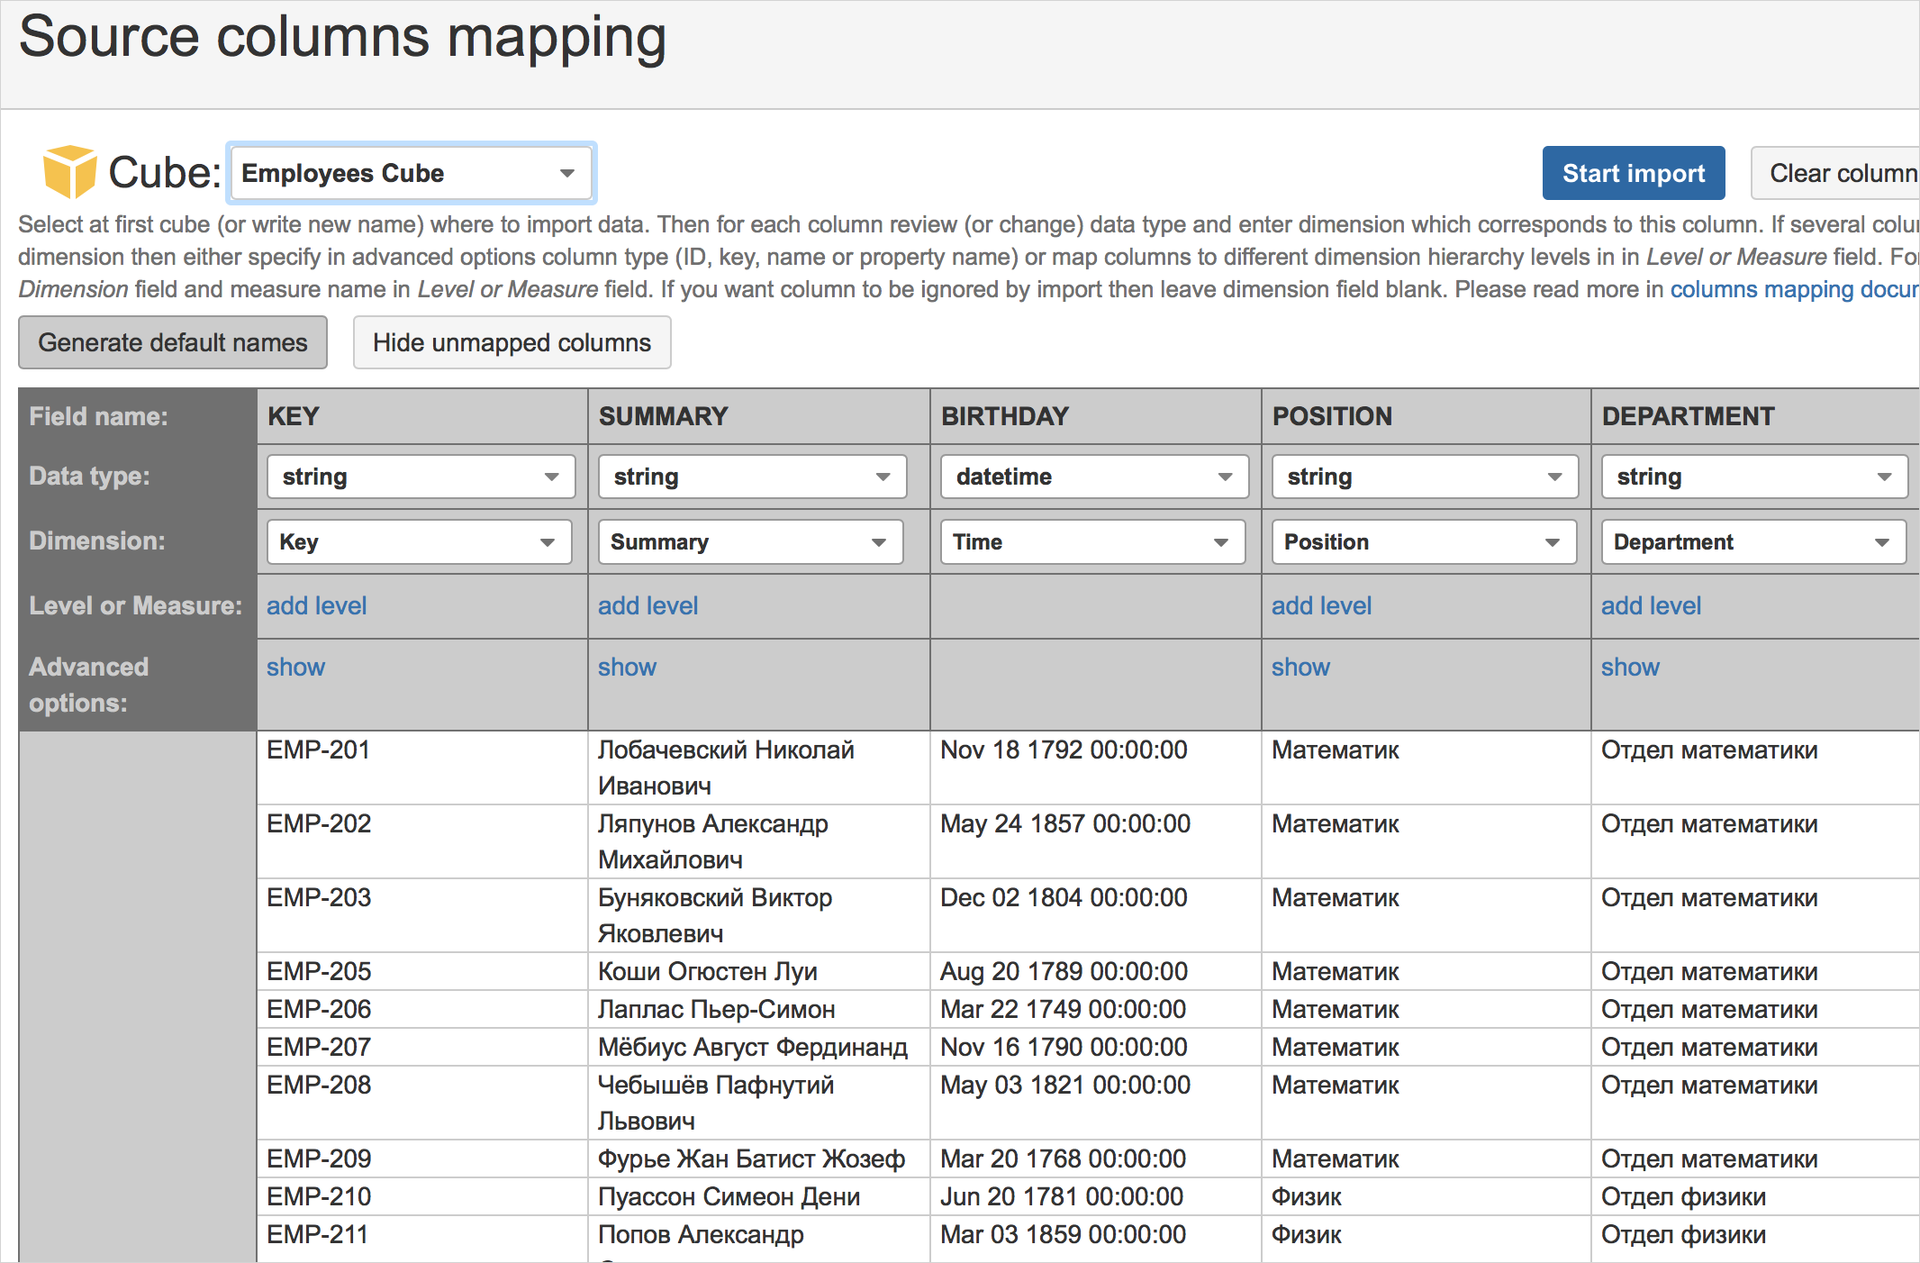
Then start importing data, create a cube of them. Combining the dimensions of the cube in the correct order, we get this unloading:
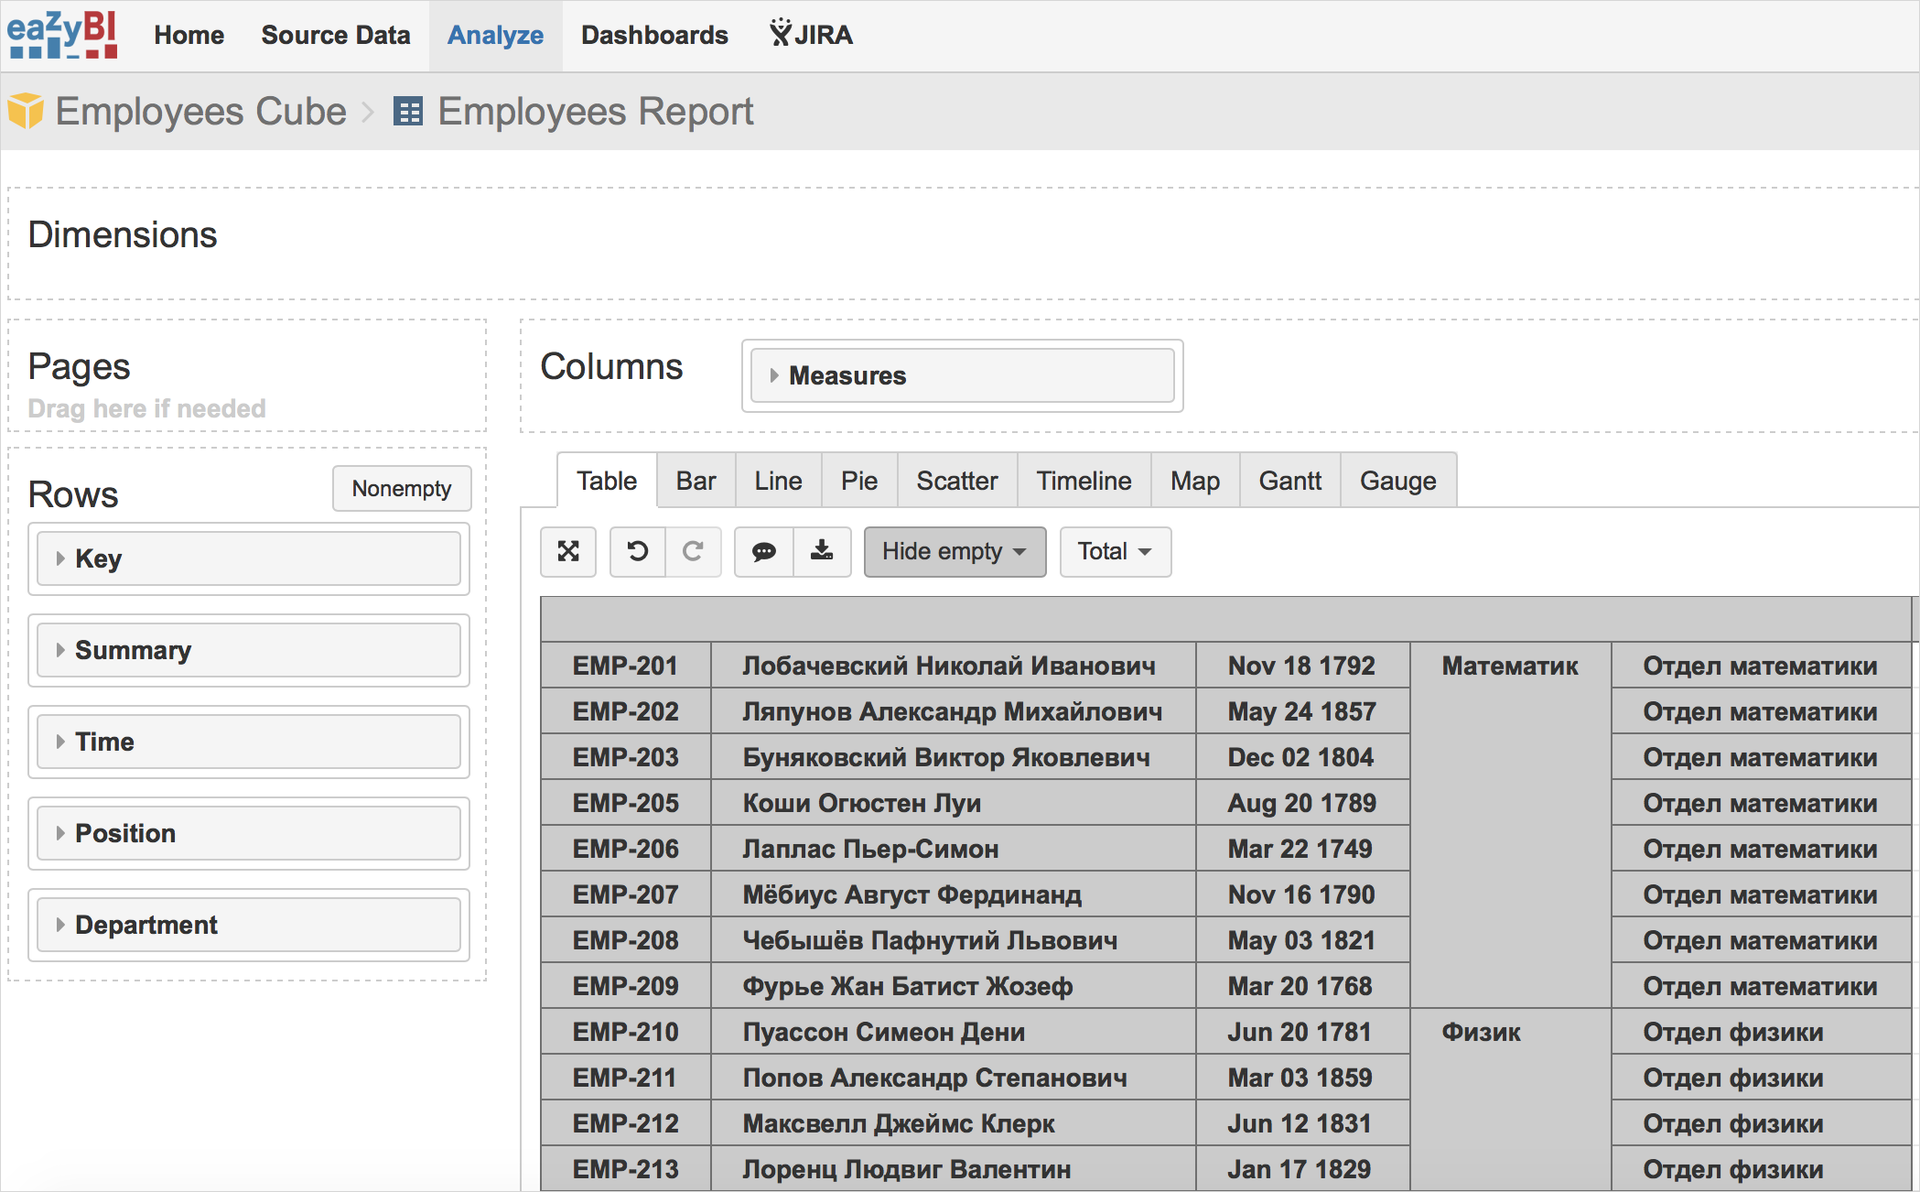
Which through the corresponding macro is added to the Confluence page.
In eazyBI, all functions are present, as in the mechanisms described above. In addition, there is auto-update, export to Excel, convenient grouping by dates and much, much more.
Among the shortcomings, I want to highlight the peculiarity of the work of BI engines - before displaying, the result of the query is unloaded into a separate DBMS, from which there is already a display in Confluence. These requests are not triggered in real time, but at intervals (from 5 minutes to 1 day). Therefore, eazyBI is better to use on large data arrays, where the speed of query execution is critical (as a result, the load on the DBMS), and the freshness of the data is not very critical.
Results
Here’s what comes out of the bottom line:
| viewing | sorting | paging | column renaming | filtering | numbering | real time execution | |
| 0. JIRA filter | not | Yes | Yes | not | not | not | Yes |
| 1. JIRA Macro | Yes | Yes | Yes | not | not | not | Yes |
| 2. JIRA gadget | Yes | Yes | Yes | not | not | not | Yes |
| 3. SQL query | Yes | Yes | not | Yes | Yes | Yes | Yes |
| 4. eazyBI | Yes | Yes | Yes | Yes | Yes | Yes | not |
Thus, I would like to advise you - if the data is stored in JIRA, use standard mechanisms until they satisfy your needs. If you do not satisfy, or the data is not stored in the JIRA DBMS, then experiment with SQL + Table Filter. If there is a lot of data, getting them resource-intensive and relevance is not so important, feel free to use eazyBI.
PS Here is a last year's article from the sandbox , in which the data visualization engines in Confluence are described in more detail. Including, mentioned Table Filter.
Source: https://habr.com/ru/post/306788/
All Articles