Page segmentation - overview
Some time ago (oh, god, a year has passed!) To the question whether anyone would be interested in a review on modern methods of image document page segmentation, I received a positive answer (from massimus ). And today I finally decided to make this review.
 But for starters - a small digression. The text recognition system in our products can be described very simply. We have a page with text, we parse it into text blocks, then we parse the blocks into separate lines, lines into words, words into letters, we recognize letters, then we collect everything back to the text of the page further down the chain. The segmentation task is set like this: there is a page, it is necessary to decompose it into text and non-text elements.
Further, the task can be clarified and clarified ( here I’m already fed up with explanations that the correct formulation of the problem is already half a step to solving it; you can be sure that I got my colleaguesand bosses even stronger). Scientists from different countries, the authors of the methods cited, want to do science, not casuistry, so they formulate their task more simply:
')
The page has text and pictures. It is required to break the text into blocks and select pictures.
The inspiration for me was the article F. Shafait, D. Keysers, and Th. Breuel. Performance Comparison of Six Algorithms for Page Segmentation (hereinafter, I will call it SKB, after the initial letters of the authors' last names), where a comparative assessment of almost all the given segmentation methods is given. So if you want to immediately dig into the original sources - it is better to take it and follow the links. A description of the algorithms themselves, details and discussion - here.
So, we need to break the text into blocks and select images. As you can see, there is no talk about tables, charts and other delights; moreover, they often assume that the pictures are high-contrast and at the same time well binarized - that is, their borders can in principle be found by working only with a monochrome image.
Also in research often use the concept of "Manhattan" and "non-Manhattan" layout. “Manhattan” is one in which the boundaries of all blocks are straight (each block is either rectangular or consists of several rectangles with some vertices and parts of the sides common), the “non-Manhattan” does not satisfy such restrictions.
To begin, we will examine some algorithms designed to work with the "Manhattan" document.
This is the most ancient algorithm - perhaps the first thing that comes to mind when faced with the task of segmentation. First described back in 1982, in an article by KY Wong, RG Casey, FM Wahl. Document Analysis System.
In a nutshell, it works like this: let's spread the words vertically and horizontally a little, the resulting connected areas will be ready-made blocks.
If you describe a little more, it turns out like this:
The associated areas in the captured image are the finished blocks. They should be divided into text and non-text. In 1982, there was still no such arsenal of machine learning tools, without them it was difficult - the decision tree was painted by hand.
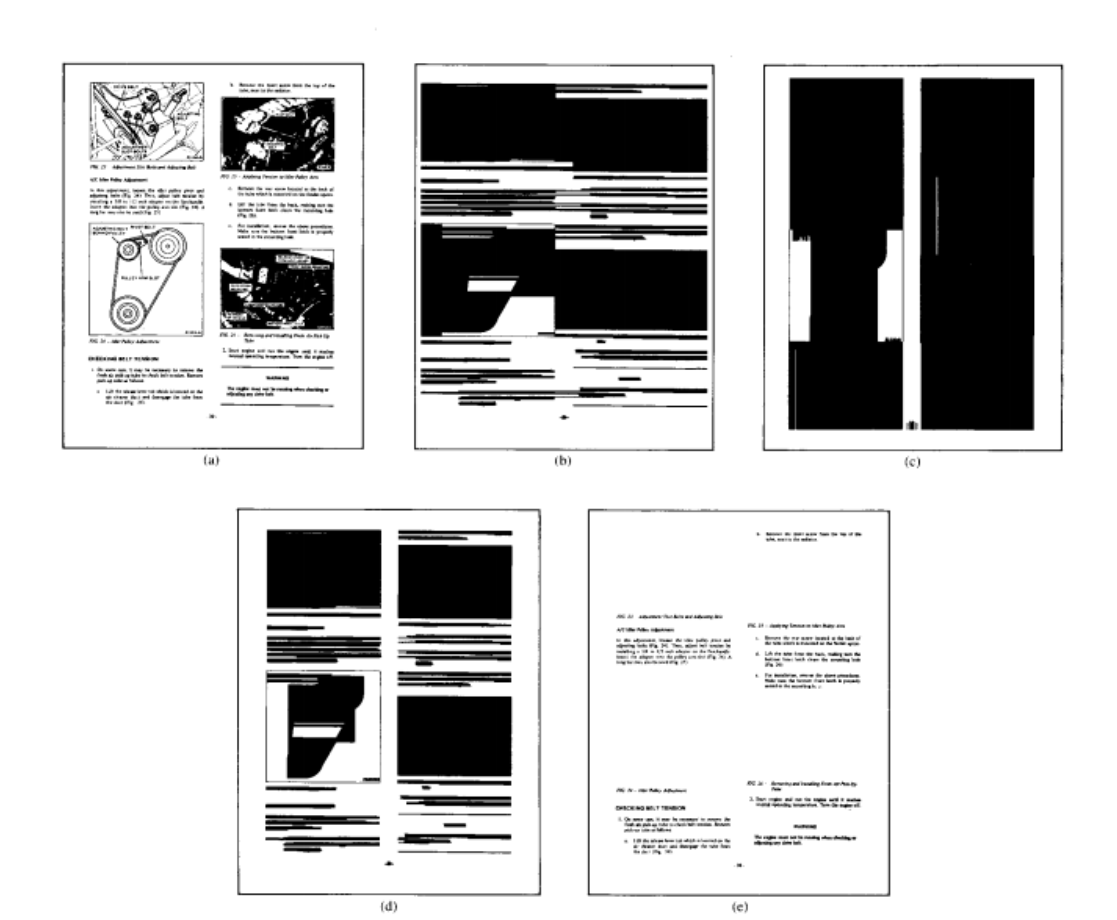
This is how intermediate images and end blocks look like:
In the original article, the authors worked with a picture with a resolution of 240 dpi and picked up the values of T_horz = 300 T_vert = 500 and T_final = 30. Somewhat surprisingly, the values turned out so large (T_vert as much as two inches with hook), apparently this is due to what is being done AND.
The advantages of the algorithm are clear - it is simple, it works with the RLE image and only with it, and therefore it is fast. The algorithm itself nowhere clearly relies on the fact that the input document is “Manhattan”. However, if you think about it, then the algorithm will not work on a “non-Manhattan” one — in the example below, the text will be glued to the picture.
The really bad news is that on the “Manhattan” document the glueing of text and “non-text” is also very frequent, in SKB this is noticed.
A couple of years later, in 1984, a more advanced method of page segmentation was described, which is called recursive XY cut. He is described in the article G. Nagy and S. Seth. The “hierarchical representation of optically scanned documents” was also actively developed in the 1990s.
This method is already explicitly stated that it is suitable only for the Manhattan document. The essence of the method is that we divide the page into blocks alternately, dividing the blocks vertically or horizontally. That is, an algorithm like this:
Then we start the algorithm recursively, starting from the whole page:
As for the item on how to divide the block. Two ways are proposed - either in white clearance (it can be found on the projection of the block on the horizontal or vertical axis, respectively) or along a long and fairly well-isolated black straight line.
As a result of all these divisions, the tree structure is obtained, as in the figure below:

The authors of the original article seem to consider this tree view as their main merit. They also noticed that even for the “Manhattan” document it is possible that this algorithm will not achieve the goal: for example, if the blocks are arranged like this
Frankly, not the most common configuration, even for newspapers, not to mention the magazines and office documents. But found in the newspapers for sure.
A more serious problem of the algorithm seems to be its submission to the thresholds. Let's say on such a fragment it will be difficult to separate the title from the text without breaking the title:

And here it will be quite difficult to separate the picture from the text, relying only on the thresholds for the distance:

Of course, problems that are common to all of the algorithms presented in this post are relevant - how not to tear the numbering from the numbered list and how to get rid of the restrictions that I indicated at the beginning (which is only text and high-contrast pictures).
Now tell about the idea of segmenting the page using the maximum white rectangles. What is a “max white rectangle”? White - this means that there are no black dots in it (it is clear that the image must first get rid of small debris). Maximum means that it cannot be increased either left or right, up or down so that it remains white. Further, instead of black points, we will consider connected domains. As in the recursive sections, we can group them somehow, but again we will not stop there. It is clear that almost every scanned page of such white rectangles - tens of thousands. But for segmentation purposes, only the largest ones may be required. The algorithm for their search is proposed in the article by Thomas M. Breuel. Two Geometric Algorithms for Layout Analysis
Let us return to the task of finding the maximum white rectangles. You can enter the concept of "quality" for the rectangle.
Let us call the quality function Q (r) for a rectangle r monotonic , if for r1 r2, Q (r1) <= Q (r2) is fulfilled - that is, if one rectangle lies inside another, then the quality of the inner cannot be greater than the quality of the outer. It is possible to think up monotonous qualities mass. The area is good. The perimeter is good. A square of height plus a square of width is suitable. In general, what fantasy enough for.
If the quality is monotonous, then apply the following algorithm, search for maximum white rectangles, in order of decreasing quality.
Next in the loop:

The condition for exiting the cycle can be either a sufficient number of the rectangles found, or the quality of the current rectangle taken from the queue ... What fantasy is enough for.
Well, we found the maximum white rectangles. Let's see what you can do next.
In the same article, Thomas M. Breuel does not really bother about this topic and writes that the entire analysis is done in four steps:
Further, some reasonable considerations are mentioned in the paper on how exactly white rectangles should be classified. I admit that there are not so many deficiencies in the evaluation function - here we will rather rest on the limitations of the method than on the incorrect evaluation.
Henry Baird describes a slightly different approach in his work. Background structure in document images. This paper describes a very interesting algorithm, but the implementation of some functions leaves a feeling that they are specifically “finely tuned” to a specific experimental base. So, it is proposed to place all the found maximum white rectangles in the priority queue. I will not give a specific priority function, you can look at the work. Intuitively, the larger the area of the rectangle and the higher the rectangle, the higher the priority should be.
Next, we take out rectangles from this queue to put some of them into a special list L. For each rectangle taken out, we apply the trimming rule: if this rectangle intersects with some elements of the list L, then we subtract from it the already processed and what is left, put it back in line. Otherwise, we add it to the list L. The condition for getting out of the cycle is somewhat tricky (I would just indicate the priority threshold, but the authors have a harder time).
Cut out all the rectangles of the list L from the page. The remaining connected areas in the image are declared ready-made text or picture blocks.
As a small summary of the maximum white rectangles, we can say that the maximum white rectangle is a very important concept, extremely useful for solving the problem of page segmentation. According to an experiment from SKB, both of the algorithms presented here work better on both recursive sections and Smearing. Another thing is that in the above algorithms the question is “hushed up” even with pictures, not to mention more complex concepts.
We have analyzed several algorithms for Manhattan documents. But what to do if we got a document like this:
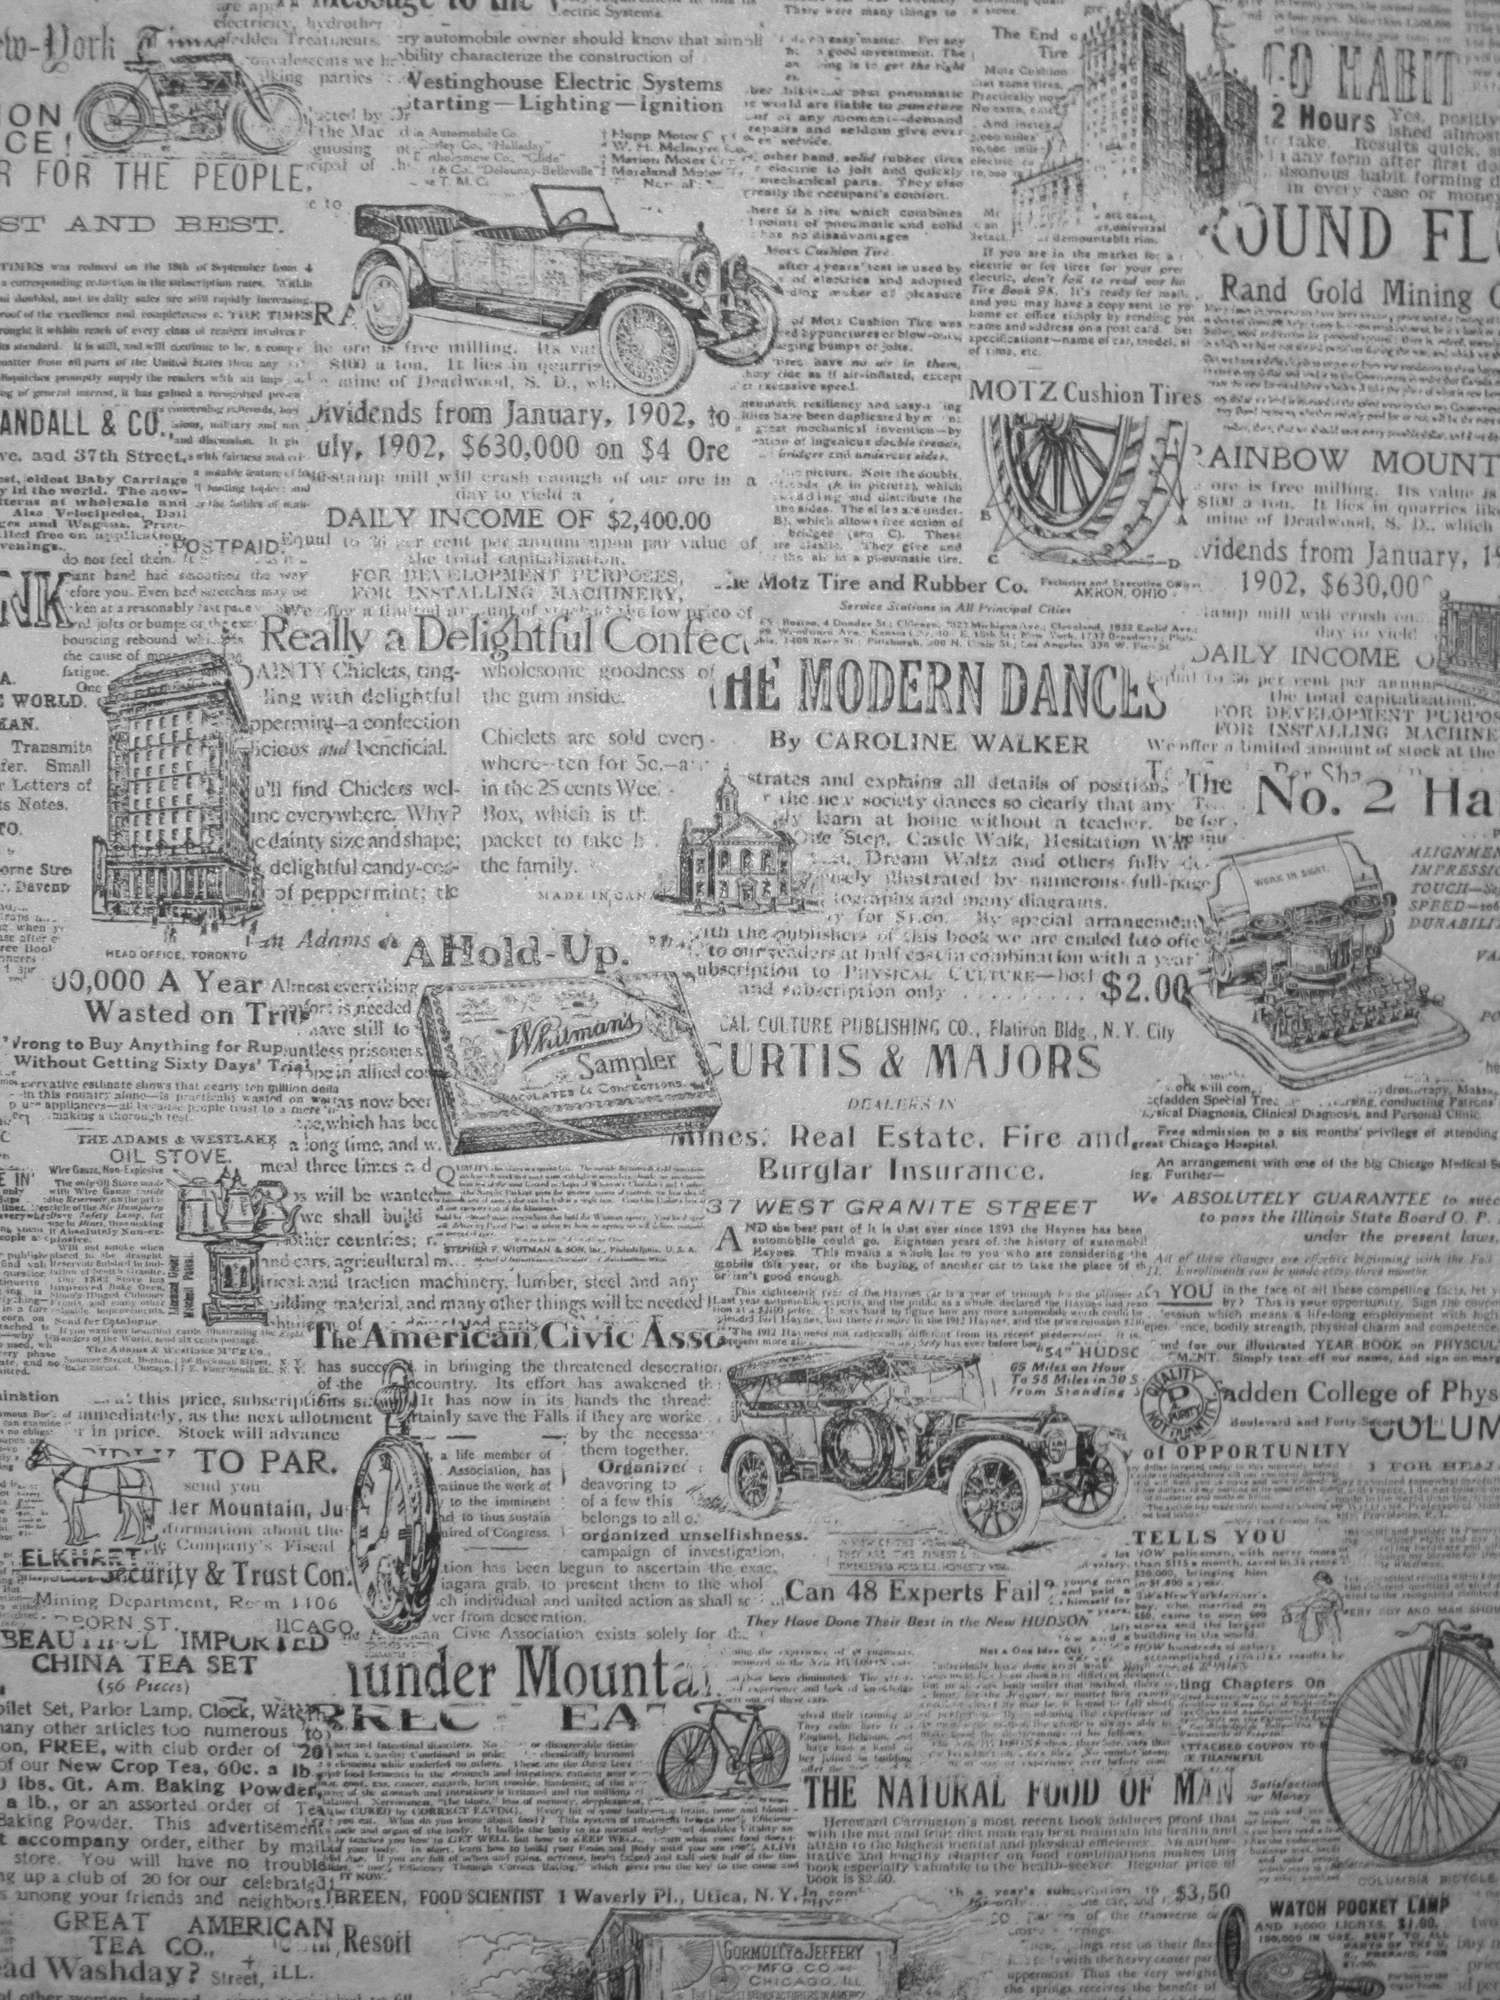
Well, specifically the answer is quite simple - no this is not a document, but just the wallpaper in my closet, so what exactly the document processing program will do with this picture is not so important.
If to speak seriously, the “non-Manhattan” layout is not so big exotic, it can be found in newspapers, in magazines, and sometimes even in books. Here is a typical newspaper example:
Below we analyze two algorithms that cope with the "non-Manhattan" documents.
The word Docstrum is derived from the Carroll productive model portmanteau word - by gluing together the words Document and Spectrum (I love this model, by the way) and denotes the segmentation algorithm for “non-Manhattan” documents. O'Gorman described it in his article The 1993 spectrum for page layout analysis in 1993. The method itself was invented for pages that lay on the scanner is not perfectly smooth, but at a slight angle. We describe how this algorithm works.
To begin, we will prepare the page by removing small debris and large, obviously non-text objects (well, or pretend that there are no pictures on the pages - is this the first time?). We believe that all that remains on the page are small letters. We cluster these letters in size (the author proposed exactly two clusters, but those who used this method tried three, and four, and even more). Let's look at the distances from each letter to k (usually taking k equal to 4 or 5) of the nearest neighbors from the same cluster. Let's write down distances in the histogram. Let's look at the first three peaks of the histogram. It is argued that the smallest peak is the distance between the letters in the word, the second is the line spacing, and the third is the space. If we use this assumption, we can correct the bias, by the way.
For the segmentation of the page, we do a transitive closure by the close components - we merge the words inside the lines and the close lines with each other, we get ready blocks.
Besides the fact that this method is positioned as working with “non-Manhattan” documents, it explicitly uses an important idea. I mean the property that the threshold values of distances, on which our solution depends (put two words in one block or not), are selected depending on the height of the words. This means that this method has at least some chance of regularly coping with the problem “over-segmenting of large fonts” that has been repeatedly mentioned by researchers.
On the other hand, here too, the authors deftly hushed up the question of what to do with pictures and more complex objects. Yes, and other shortcomings of the idea of relying only on the thresholds for the distance we have already discussed above.
The Voronoi diagram is an interesting object that is constructed from an arbitrary set of points of the plane (in our case, by the centers of the letters). The points along which the Voronoi diagram is constructed will be called reference points here . It is a partition of the plane into areas; each area corresponds to one reference point and is a set of points of the plane for which this reference point is closer than any other reference point. In more detail about the Voronoi diagram and its connection with another curious object - Delaunay triangulation , the easiest way to read is through the links in Wikipedia.
About how to build them, it is worth reading the beautiful AV Booklet already quoted many times on Habré . Skvortsova "Delone Triangulation and its application." I will talk about the 1998 article K. Kise, A. Sato, and M. Iwata. Segmentation of page images using the area voronoi diagram. That is, how the Voronoi diagram was applied to the solution of the segmentation problem. By the way, today this method is considered a “scientific standard” until science has proposed an algorithm that would be recognized better than this one. And in SKB, the authors write that the Voronoi diagram noticeably outperforms both white rectangles, Docstrum, and recursive sections.
So, with a familiar gesture, we clear the image of garbage (everything, for the last time for this post, pretend that it is really so easy to do), we declare the centers of the remaining connected regions as anchor points and build the Voronoi diagram on them. Then we note which of the cells in the diagram should be merged. We merge cells in two cases:
After we have found all the cells that need to be merged, we merge them - and the Voronoi diagram turns into a ready segmentation.
Later, different researchers tried to improve the work of the Voronoi diagram. For example, in the 2009 Voronoi ++ article: A Dynamic Page Segmentation approach based on Voronoi and Docstrum features, the authors M. Agrawal and D.Doermann tell how to use the Docstrum and even other strange witches to choose the T2 threshold. I will not write about this “improvement” here in detail, but the very existence of articles on the development of a segmentation algorithm based on the Voronoi diagram, and even written by such eminent scientists as David Doermann hints to us where the wind blows.
The drawbacks of the Voronoi diagram are the same again - the limitations depend only on the thresholds, the same ambiguity with pictures. The undoubted advantage of this method lies in the fact that it contains only three parameters that must be selected - and these parameters are explicitly indicated.
This concludes my review of the scientific advances related to page segmentation. And science, I think, will still say its word :)
But for starters - a small digression. The text recognition system in our products can be described very simply. We have a page with text, we parse it into text blocks, then we parse the blocks into separate lines, lines into words, words into letters, we recognize letters, then we collect everything back to the text of the page further down the chain. The segmentation task is set like this: there is a page, it is necessary to decompose it into text and non-text elements.Further, the task can be clarified and clarified ( here I’m already fed up with explanations that the correct formulation of the problem is already half a step to solving it; you can be sure that I got my colleagues
')
The page has text and pictures. It is required to break the text into blocks and select pictures.
The inspiration for me was the article F. Shafait, D. Keysers, and Th. Breuel. Performance Comparison of Six Algorithms for Page Segmentation (hereinafter, I will call it SKB, after the initial letters of the authors' last names), where a comparative assessment of almost all the given segmentation methods is given. So if you want to immediately dig into the original sources - it is better to take it and follow the links. A description of the algorithms themselves, details and discussion - here.
So, we need to break the text into blocks and select images. As you can see, there is no talk about tables, charts and other delights; moreover, they often assume that the pictures are high-contrast and at the same time well binarized - that is, their borders can in principle be found by working only with a monochrome image.
Also in research often use the concept of "Manhattan" and "non-Manhattan" layout. “Manhattan” is one in which the boundaries of all blocks are straight (each block is either rectangular or consists of several rectangles with some vertices and parts of the sides common), the “non-Manhattan” does not satisfy such restrictions.
To begin, we will examine some algorithms designed to work with the "Manhattan" document.
Smearing
This is the most ancient algorithm - perhaps the first thing that comes to mind when faced with the task of segmentation. First described back in 1982, in an article by KY Wong, RG Casey, FM Wahl. Document Analysis System.
In a nutshell, it works like this: let's spread the words vertically and horizontally a little, the resulting connected areas will be ready-made blocks.
If you describe a little more, it turns out like this:
- We take the image of the page in the RLE-representation
- Remove white RLE strokes (= sequence of white pixels) with a length less than lT_horz. We receive the image Image_1
- The original image is rotated 90 degrees and on the rotated image we delete white RLE-strokes with a length less than lT_vert. Rotate the image back and get the image Image_2
- We do AND of images Image_1 and Image_2
- On the resulting image, we will remove the white strokes with a length less than T_Final
The associated areas in the captured image are the finished blocks. They should be divided into text and non-text. In 1982, there was still no such arsenal of machine learning tools, without them it was difficult - the decision tree was painted by hand.
This is how intermediate images and end blocks look like:
In the original article, the authors worked with a picture with a resolution of 240 dpi and picked up the values of T_horz = 300 T_vert = 500 and T_final = 30. Somewhat surprisingly, the values turned out so large (T_vert as much as two inches with hook), apparently this is due to what is being done AND.
The advantages of the algorithm are clear - it is simple, it works with the RLE image and only with it, and therefore it is fast. The algorithm itself nowhere clearly relies on the fact that the input document is “Manhattan”. However, if you think about it, then the algorithm will not work on a “non-Manhattan” one — in the example below, the text will be glued to the picture.
The really bad news is that on the “Manhattan” document the glueing of text and “non-text” is also very frequent, in SKB this is noticed.
Recursive XY cut
A couple of years later, in 1984, a more advanced method of page segmentation was described, which is called recursive XY cut. He is described in the article G. Nagy and S. Seth. The “hierarchical representation of optically scanned documents” was also actively developed in the 1990s.
This method is already explicitly stated that it is suitable only for the Manhattan document. The essence of the method is that we divide the page into blocks alternately, dividing the blocks vertically or horizontally. That is, an algorithm like this:
- Preparing the page, clearing it from small debris
- Select the connected areas. You can even combine them a little and get something like words, if suddenly someone knows how to build such associations safely. But within the framework of this post we will call them “connected areas”.
- We calculate the global parameters of the algorithm, for example, the median height and width of the symbol.
Then we start the algorithm recursively, starting from the whole page:
- We are looking for how to divide the block in a vertical or horizontal cut.
- If we could, we divide and recursively start the division of each of the parts.
- If we could not, stop.
As for the item on how to divide the block. Two ways are proposed - either in white clearance (it can be found on the projection of the block on the horizontal or vertical axis, respectively) or along a long and fairly well-isolated black straight line.
As a result of all these divisions, the tree structure is obtained, as in the figure below:
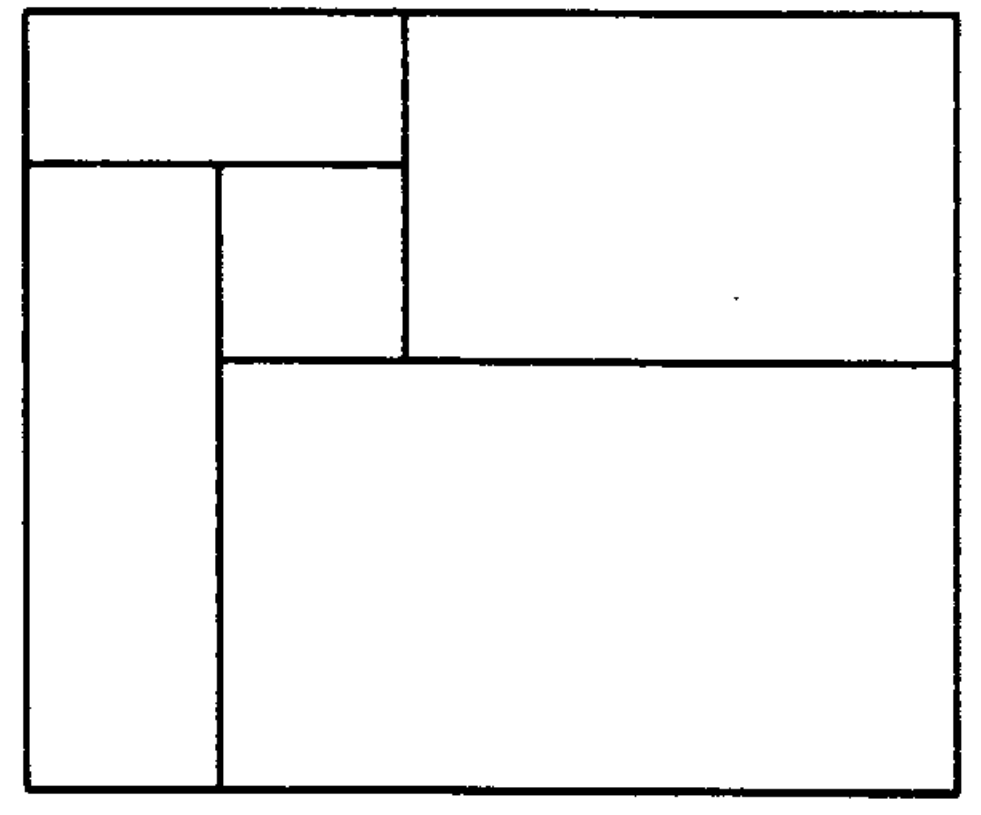
The authors of the original article seem to consider this tree view as their main merit. They also noticed that even for the “Manhattan” document it is possible that this algorithm will not achieve the goal: for example, if the blocks are arranged like this
Frankly, not the most common configuration, even for newspapers, not to mention the magazines and office documents. But found in the newspapers for sure.
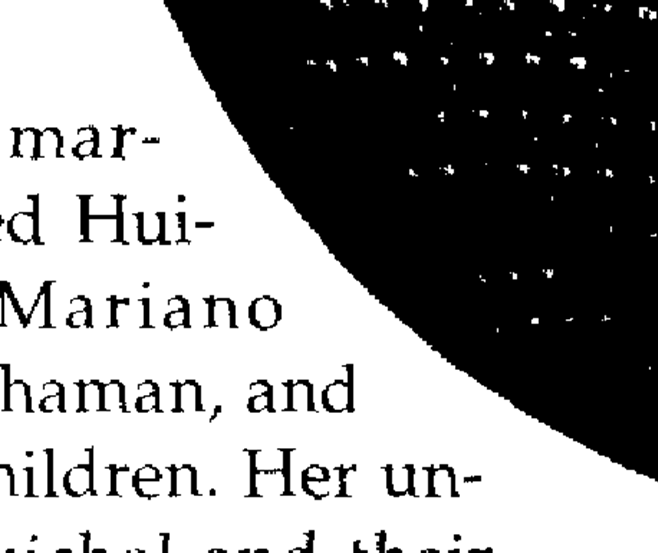
A more serious problem of the algorithm seems to be its submission to the thresholds. Let's say on such a fragment it will be difficult to separate the title from the text without breaking the title:
And here it will be quite difficult to separate the picture from the text, relying only on the thresholds for the distance:
Of course, problems that are common to all of the algorithms presented in this post are relevant - how not to tear the numbering from the numbered list and how to get rid of the restrictions that I indicated at the beginning (which is only text and high-contrast pictures).
Segmentation using maximum white rectangles
Now tell about the idea of segmenting the page using the maximum white rectangles. What is a “max white rectangle”? White - this means that there are no black dots in it (it is clear that the image must first get rid of small debris). Maximum means that it cannot be increased either left or right, up or down so that it remains white. Further, instead of black points, we will consider connected domains. As in the recursive sections, we can group them somehow, but again we will not stop there. It is clear that almost every scanned page of such white rectangles - tens of thousands. But for segmentation purposes, only the largest ones may be required. The algorithm for their search is proposed in the article by Thomas M. Breuel. Two Geometric Algorithms for Layout Analysis
By the way
The second algorithm from these “two” selects lines between these white delimiters, but, as it seems to me, it is not particularly prominent, if anyone is interested, see the article.
Let us return to the task of finding the maximum white rectangles. You can enter the concept of "quality" for the rectangle.
Let us call the quality function Q (r) for a rectangle r monotonic , if for r1 r2, Q (r1) <= Q (r2) is fulfilled - that is, if one rectangle lies inside another, then the quality of the inner cannot be greater than the quality of the outer. It is possible to think up monotonous qualities mass. The area is good. The perimeter is good. A square of height plus a square of width is suitable. In general, what fantasy enough for.
If the quality is monotonous, then apply the following algorithm, search for maximum white rectangles, in order of decreasing quality.
- We get a queue with priorities for rectangles. Priority is equal to quality.
- We put in a queue a rectangle of the whole page. He is exactly the first.
Next in the loop:
- Get out of the queue rectangle. If it is empty, then this is another found maximum white rectangle.
- If not, from the connected areas in the rectangle under investigation, select one “reference” area (similar to the median in QSort). Here it is better not to rely on chance, but to consciously choose something more centrally.
- Note that the maximum white rectangle can be either entirely above this area, or entirely below it, or to its right or left (green rectangles in the figure below).
- Add green rectangles to the queue.
The condition for exiting the cycle can be either a sufficient number of the rectangles found, or the quality of the current rectangle taken from the queue ... What fantasy is enough for.
Well, we found the maximum white rectangles. Let's see what you can do next.
In the same article, Thomas M. Breuel does not really bother about this topic and writes that the entire analysis is done in four steps:
- Find all the high maximum white rectangles and evaluate them as candidates for column breaks.
- According to the column structure found, find the rows
- Looking at the found lines, find paragraphs, header structure, footers
- Restore the reading order using both geometric and linguistic information
Further, some reasonable considerations are mentioned in the paper on how exactly white rectangles should be classified. I admit that there are not so many deficiencies in the evaluation function - here we will rather rest on the limitations of the method than on the incorrect evaluation.
Henry Baird describes a slightly different approach in his work. Background structure in document images. This paper describes a very interesting algorithm, but the implementation of some functions leaves a feeling that they are specifically “finely tuned” to a specific experimental base. So, it is proposed to place all the found maximum white rectangles in the priority queue. I will not give a specific priority function, you can look at the work. Intuitively, the larger the area of the rectangle and the higher the rectangle, the higher the priority should be.
Next, we take out rectangles from this queue to put some of them into a special list L. For each rectangle taken out, we apply the trimming rule: if this rectangle intersects with some elements of the list L, then we subtract from it the already processed and what is left, put it back in line. Otherwise, we add it to the list L. The condition for getting out of the cycle is somewhat tricky (I would just indicate the priority threshold, but the authors have a harder time).
Cut out all the rectangles of the list L from the page. The remaining connected areas in the image are declared ready-made text or picture blocks.
As a small summary of the maximum white rectangles, we can say that the maximum white rectangle is a very important concept, extremely useful for solving the problem of page segmentation. According to an experiment from SKB, both of the algorithms presented here work better on both recursive sections and Smearing. Another thing is that in the above algorithms the question is “hushed up” even with pictures, not to mention more complex concepts.
Non-manhattan layout
We have analyzed several algorithms for Manhattan documents. But what to do if we got a document like this:
Well, specifically the answer is quite simple - no this is not a document, but just the wallpaper in my closet, so what exactly the document processing program will do with this picture is not so important.
If to speak seriously, the “non-Manhattan” layout is not so big exotic, it can be found in newspapers, in magazines, and sometimes even in books. Here is a typical newspaper example:
Below we analyze two algorithms that cope with the "non-Manhattan" documents.
Docstrum
The word Docstrum is derived from the Carroll productive model portmanteau word - by gluing together the words Document and Spectrum (I love this model, by the way) and denotes the segmentation algorithm for “non-Manhattan” documents. O'Gorman described it in his article The 1993 spectrum for page layout analysis in 1993. The method itself was invented for pages that lay on the scanner is not perfectly smooth, but at a slight angle. We describe how this algorithm works.
To begin, we will prepare the page by removing small debris and large, obviously non-text objects (well, or pretend that there are no pictures on the pages - is this the first time?). We believe that all that remains on the page are small letters. We cluster these letters in size (the author proposed exactly two clusters, but those who used this method tried three, and four, and even more). Let's look at the distances from each letter to k (usually taking k equal to 4 or 5) of the nearest neighbors from the same cluster. Let's write down distances in the histogram. Let's look at the first three peaks of the histogram. It is argued that the smallest peak is the distance between the letters in the word, the second is the line spacing, and the third is the space. If we use this assumption, we can correct the bias, by the way.
For the segmentation of the page, we do a transitive closure by the close components - we merge the words inside the lines and the close lines with each other, we get ready blocks.
Besides the fact that this method is positioned as working with “non-Manhattan” documents, it explicitly uses an important idea. I mean the property that the threshold values of distances, on which our solution depends (put two words in one block or not), are selected depending on the height of the words. This means that this method has at least some chance of regularly coping with the problem “over-segmenting of large fonts” that has been repeatedly mentioned by researchers.
On the other hand, here too, the authors deftly hushed up the question of what to do with pictures and more complex objects. Yes, and other shortcomings of the idea of relying only on the thresholds for the distance we have already discussed above.
Voronoi diagram
The Voronoi diagram is an interesting object that is constructed from an arbitrary set of points of the plane (in our case, by the centers of the letters). The points along which the Voronoi diagram is constructed will be called reference points here . It is a partition of the plane into areas; each area corresponds to one reference point and is a set of points of the plane for which this reference point is closer than any other reference point. In more detail about the Voronoi diagram and its connection with another curious object - Delaunay triangulation , the easiest way to read is through the links in Wikipedia.
About how to build them, it is worth reading the beautiful AV Booklet already quoted many times on Habré . Skvortsova "Delone Triangulation and its application." I will talk about the 1998 article K. Kise, A. Sato, and M. Iwata. Segmentation of page images using the area voronoi diagram. That is, how the Voronoi diagram was applied to the solution of the segmentation problem. By the way, today this method is considered a “scientific standard” until science has proposed an algorithm that would be recognized better than this one. And in SKB, the authors write that the Voronoi diagram noticeably outperforms both white rectangles, Docstrum, and recursive sections.
So, with a familiar gesture, we clear the image of garbage (everything, for the last time for this post, pretend that it is really so easy to do), we declare the centers of the remaining connected regions as anchor points and build the Voronoi diagram on them. Then we note which of the cells in the diagram should be merged. We merge cells in two cases:
- Or the distance d between the reference points (centers of connected components) is less than the threshold T1. The threshold T1 is chosen in such a way that this rule deals with the union of adjacent letters in words
- Or, d has the following relation: d / T2 + ar / Ta <1 where ar is the ratio of the area of the larger connected area to the area of the smaller (ie, ar> = 1), and T2 and Ta are two more thresholds. The meaning of this condition is that it is necessary to combine two words in a line, but if these two words have different heights, then you need to combine the cells with more caution.
After we have found all the cells that need to be merged, we merge them - and the Voronoi diagram turns into a ready segmentation.
Later, different researchers tried to improve the work of the Voronoi diagram. For example, in the 2009 Voronoi ++ article: A Dynamic Page Segmentation approach based on Voronoi and Docstrum features, the authors M. Agrawal and D.Doermann tell how to use the Docstrum and even other strange witches to choose the T2 threshold. I will not write about this “improvement” here in detail, but the very existence of articles on the development of a segmentation algorithm based on the Voronoi diagram, and even written by such eminent scientists as David Doermann hints to us where the wind blows.
The drawbacks of the Voronoi diagram are the same again - the limitations depend only on the thresholds, the same ambiguity with pictures. The undoubted advantage of this method lies in the fact that it contains only three parameters that must be selected - and these parameters are explicitly indicated.
This concludes my review of the scientific advances related to page segmentation. And science, I think, will still say its word :)
Source: https://habr.com/ru/post/306510/
All Articles