Automation of laboratory measurements
I am a graduate student of the Institute of Metal Physics, researching the properties of various metals and alloys. The process of measurement and analysis is usually laborious and requires a lot of routine work. In this regard, the installation was automated to investigate the optical properties of metals. How it was, I will tell further in the publication.
Develop software to manage the preparation and conduct of the experiment on an automated optical ellipsometer.
')
During the measurement process, the program must control the stepper drives, performing a two-dimensional scan. The minimum scan step depends on the installation options. The number of points per range is determined by the range and scan step.
The experiment parameters (measurement range, scanning step) do not change during the measurement. Scanning is discrete, step by step.
Measurement is performed only at the moment the actuators are stopped. After the measurement is completed, a move command is given to the next step, and a transport move is made. The voltage at the PMT is regulated using PWM .
I chose C # as a programming language, since it has many useful functions out of the box for working with USB, COM ports, native support for Microsoft Office, etc.
So, to receive data and send commands to the microcontroller, we will use the virtual COM port:
To convert an analog signal, I used a 16-bit ADC from ICP Das , for which there is an SDK on the official website, so reading data from an ADC is trivial:
A bit of mathematics, the calculation of optical constants:
The function of determining the drift "zero" signal:
The photomultiplier tube is terribly nonlinear, so in different parts of the spectrum it has different sensitivity and you need to maintain a constant signal within the set limits (for our measurements it is a range of 300 - 850 mV with an optimum signal-to-noise ratio):

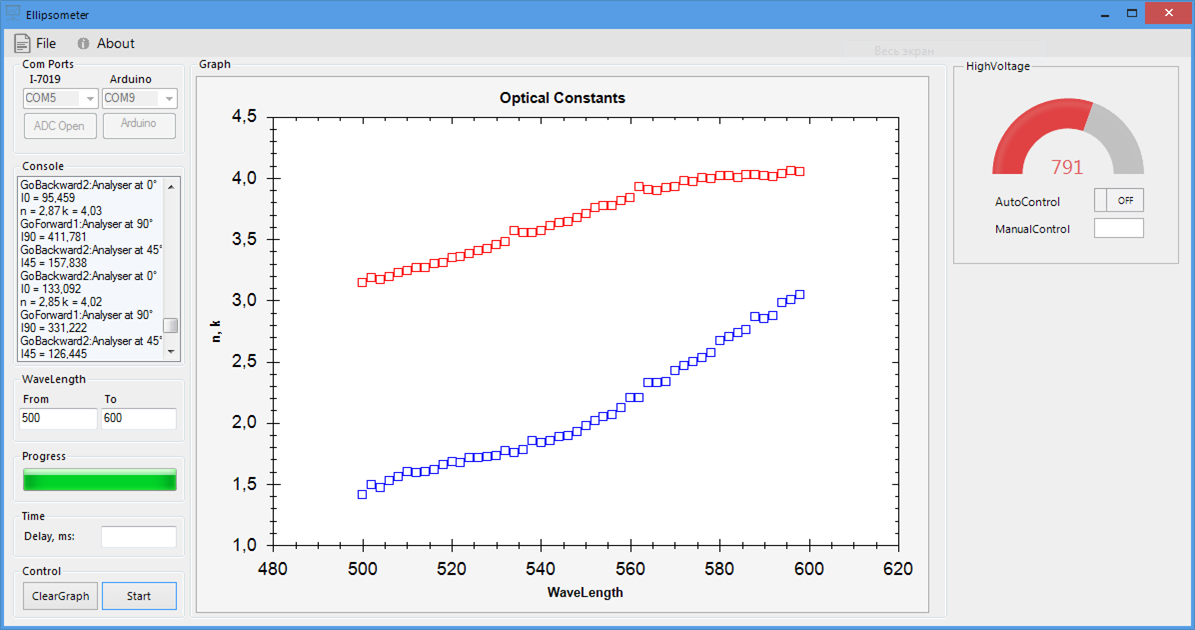
Displaying measurement results in real time is a very important point, as it allows you to control the process and the correctness of the experiment. After analyzing the article on Habré “ Graphing tools for .NET” I chose ZedGraph . Free, fast, simple and quite functional library.

And finally, saving to file:
A hardware-software complex designed to automate laboratory measurements based on WinForms has been developed. At the expense of the performance and relevance of the choice of this particular PL for scientific calculations can be found in the article .
PS This is part of the manager of the “iron”, which I plan to write about in the following article:
Formulation of the problem
Develop software to manage the preparation and conduct of the experiment on an automated optical ellipsometer.
The software should provide the opportunity
- job initial settings and experiment parameters;
- measurements of the optical characteristics of the samples;
- primary data set [data arrays I (α) at a fixed wavelength λ and a fixed (constant) value of I (α) in a given wavelength range λmin ≤ λ ≤ λmax (where α is the analyzer azimuth) or arrays I (λ) at fixed azimuths of the analyzer α1, α2, α3, ... αn];
- processing arrays I (α) or I (λ) to calculate optical constants;
- control of the exposure time before the start of measurements at a given spectrum point or azimuth of the analyzer for measuring the steady-state signal level, as well as the duration of "standing" at a given spectrum point (azimuth) for signal accumulation;
- visualization of measurement data;
- save data to file.
')
Experiment
During the measurement process, the program must control the stepper drives, performing a two-dimensional scan. The minimum scan step depends on the installation options. The number of points per range is determined by the range and scan step.
The experiment parameters (measurement range, scanning step) do not change during the measurement. Scanning is discrete, step by step.
Measurement is performed only at the moment the actuators are stopped. After the measurement is completed, a move command is given to the next step, and a transport move is made. The voltage at the PMT is regulated using PWM .
Soft
I chose C # as a programming language, since it has many useful functions out of the box for working with USB, COM ports, native support for Microsoft Office, etc.
So, to receive data and send commands to the microcontroller, we will use the virtual COM port:
code
// Open ADC Com private void buttonADC_Click(object sender, EventArgs e) { String s = ""; if (comboBox1.Text != "") { s += comboBox1.Text; } try { hPort = PACNET.UART.Open(s + ",9600,N,8,1"); Log.Items.Add(" "); buttonADC.Enabled = false; comboBox1.Enabled = false; } catch { MessageBox.Show(" " + serialPort1.PortName + " !", "!", MessageBoxButtons.OK, MessageBoxIcon.Warning); Log.Item.add(" !"); } } To convert an analog signal, I used a 16-bit ADC from ICP Das , for which there is an SDK on the official website, so reading data from an ADC is trivial:
code
float readSequenceADC(int iChannel, int iterations) { float result = 0; for (int i = 0; i < iterations; i++) { result += readADC(iChannel); Thread.Sleep(150); } result /= iterations; return result; } A bit of mathematics, the calculation of optical constants:
code
public void count(float a, float b, float c) { double x = a; double y = b; double z = c; double ksi = Math.Atan(Math.Sqrt(x / z)); double delta = Math.Acos((x + z - 2 * y) / (2 * Math.Sqrt(x * z))); double denominator = Math.Pow((1 - Math.Sin(2 * ksi) * Math.Cos(delta)), 2); double numerator = Math.Pow(Math.Sin(phi), 2) * Math.Pow(Math.Tan(phi), 2) * Math.Sin(2 * ksi) * Math.Cos(2 * ksi) * Math.Sin(delta); double nk = numerator / denominator; double numerator1 = Math.Pow(Math.Cos(2 * ksi), 2) - Math.Pow(Math.Sin(2 * ksi), 2) * Math.Pow(Math.Sin(delta), 2); double nk2 = Math.Pow(Math.Sin(phi), 2) + (Math.Pow(Math.Sin(phi), 2) * Math.Pow(Math.Tan(phi), 2) * (numerator1 / denominator)); double x1 = 0; double x2 = 0; double D = nk2 * nk2 - 4 * ((-1) * nk * nk); if (D < 0) { x1 = 0; x2 = 0; } else if (D == 0) { x1 = -nk2 / 2; x2 = -nk2 / 2; } else if (D > 0) { x1 = (-nk2 + Math.Sqrt(D)) / 2; x2 = (-nk2 - Math.Sqrt(D)) / 2; } if (x1 < 0 && x2 < 0) { // "X1, x2 < 0" } else if (x1 > 0) { k = Math.Sqrt(x1); } else if (x2 > 0) { k = Math.Sqrt(x2); } n = Math.Sqrt(nk2 + k * k); } The function of determining the drift "zero" signal:
code
// Intensity Drifting Check private void Worker3() { while (isWorking == true) { try { for (int i = 0; i < 1000; i++) { Thread.Sleep(200); I = readADC(3); Intensity.Add(I); this.Invoke((MethodInvoker)(() => Log.Items.Add("I = " + I))); DrawGraph(i, I, 0); } PrintExel.ExportText(Intensity); ClearGraph(); isWorking = false; } catch (Exception e) { MessageBox.Show("Error:\n" + e.Message); } } } The photomultiplier tube is terribly nonlinear, so in different parts of the spectrum it has different sensitivity and you need to maintain a constant signal within the set limits (for our measurements it is a range of 300 - 850 mV with an optimum signal-to-noise ratio):
code
private void maxControl() { double val = 1; while (val > 0.85) { this.radRadialGauge1.Value -= 7; serialPort1.Write("decrease"); val = Convert.ToInt32(Math.Abs(readADC(3))); Thread.Sleep(1000); } } private void minControl() { double val = 0; while (val < 0.4) // val < 300 { this.radRadialGauge1.Value += 7; serialPort1.Write("increase"); val = Convert.ToInt32(Math.Abs(readADC(3))); Thread.Sleep(1000); } } Data visualization
Displaying measurement results in real time is a very important point, as it allows you to control the process and the correctness of the experiment. After analyzing the article on Habré “ Graphing tools for .NET” I chose ZedGraph . Free, fast, simple and quite functional library.
graphing function
private void DrawGraph(int x, double n, double k) { GraphPane pane = zedGraphControl1.GraphPane; PointPairList listN = new PointPairList(); PointPairList listK = new PointPairList(); LineItem myCurve; listN.Add(x, n); listK.Add(x, k); myCurve = pane.AddCurve("", listN, Color.Blue, SymbolType.Default); myCurve = pane.AddCurve("", listK, Color.Red, SymbolType.Default); zedGraphControl1.AxisChange(); zedGraphControl1.Invalidate(); } And finally, saving to file:
code
public static void ExportToExcelIntensity(ArrayList arrLamda, ArrayList arrI0, ArrayList arrI45, ArrayList arrI90) { try { Microsoft.Office.Interop.Excel.Application excelApp = new Microsoft.Office.Interop.Excel.Application(); excelApp.Visible = true; excelApp.Workbooks.Add(); Microsoft.Office.Interop.Excel.Worksheet workSheet = excelApp.ActiveSheet; workSheet.Cells[1, "A"] = "WaveLength"; workSheet.Cells[1, "B"] = "I0"; workSheet.Cells[1, "C"] = "I45"; workSheet.Cells[1, "D"] = "I90"; int row = 1; for (int i = 0; i < arrLamda.Count; i++) { row++; workSheet.Cells[row, "A"] = arrLamda[i]; workSheet.Cells[row, "B"] = arrI0[i]; workSheet.Cells[row, "C"] = arrI45[i]; workSheet.Cells[row, "D"] = arrI90[i]; } workSheet.Range["A1"].AutoFormat(Microsoft.Office.Interop.Excel.XlRangeAutoFormat.xlRangeAutoFormatClassic2); excelApp.DisplayAlerts = false; workSheet.SaveAs(string.Format(@"{0}\OpticalIntensities.xlsx", Environment.CurrentDirectory)); excelApp.Quit(); } catch (Exception ex) { MessageBox.Show("Error:\n" + ex.Message); } } Total
A hardware-software complex designed to automate laboratory measurements based on WinForms has been developed. At the expense of the performance and relevance of the choice of this particular PL for scientific calculations can be found in the article .
PS This is part of the manager of the “iron”, which I plan to write about in the following article:
The photo
Source: https://habr.com/ru/post/306434/
All Articles