Dates among the digits of Pi: some thoughts from the perspective of statistics and numerology

Translation of Michael Trott's post " Dates Everywhere in Pi (e)! Some Statistical and Numerological Muscles on the Digits of Pi ".
The code given in the article can be downloaded here .
Many thanks to Kirill Guzenko KirillGuzenko for his help in translating and preparing the publication.
Content
Get all the dates in the last 100 years
Find all dates in digits of pi
Statistics of all dates
First date appearances
Dates in other views and other constants
In his recent post (see the translation of the post " 3/14/15 9:26:53 The celebration of the" Day of Pi "century, as well as the story of how to get your very personal piece of pi " on Habré) Stephen Wolfram wrote about The unique position of the secular day of pi and presented various examples of the content of dates in the digits of pi (hereafter in decimal representation). In this post I will look at the statistics of the distributions of all possible dates over the past 100 years in the first 10 million digits of pi. We will see that 99.998% of the digits represent a date, and that you can find millions of dates in the first ten million digits of pi.
I will focus on dates that can be given with no more than six digits. That is, I will be able to set dates in the span of 36,525 days, starting from March 15, 1915 and ending on March 14, 2015.
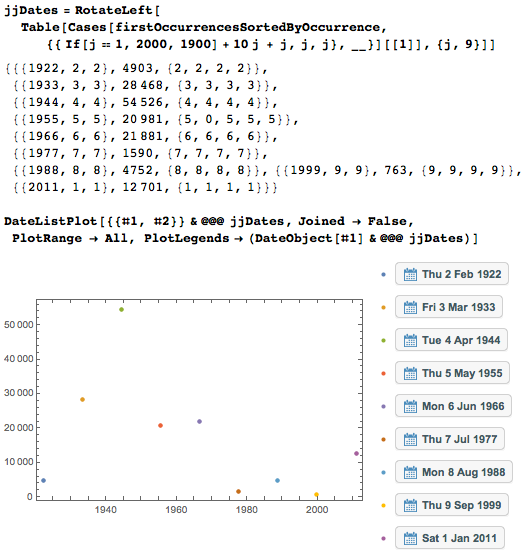
Let's start with a graphical visualization of our theme to set the mood.

')
Get all the dates in the last 100 years
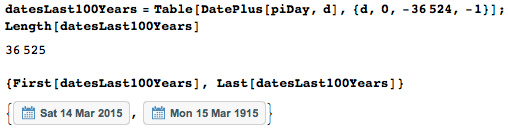
As usual, the day of pi this year fell on March 14th.

36 525 days have passed since the centuries-old pi day of the 20th century.

Create a list of all 36,525 considered dates.
For further work, we define the dateNumber function, which for a given date returns the sequence number of the date, starting with the first (March 15, 1915 has the number 1).

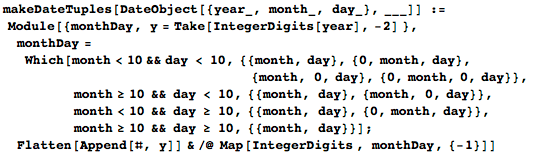
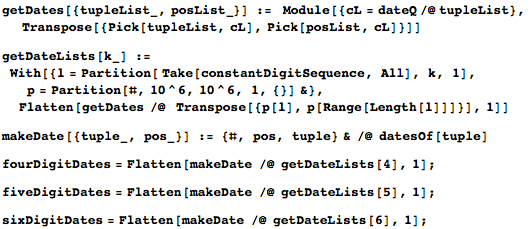
For the months from September to January, I will allow only one number to be set — that is, 9 for September, instead of 09; similarly for days. That is, some dates can be given by different sequences of numbers. The function makeDateTuples generates all sequences of integers representing dates. You can use several different date symbols - always with zeros or always in a short record. With the optional inclusion of zeros in the record of days and months, there will be more possible matches and more results, so I will use them in the future. (And if you prefer the usual format for writing dates as day-month-year, then you just need to make changes to the function makeDateTuples ).
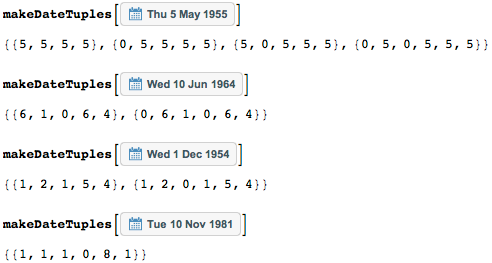
Dates can be presented in one, two or four ways:
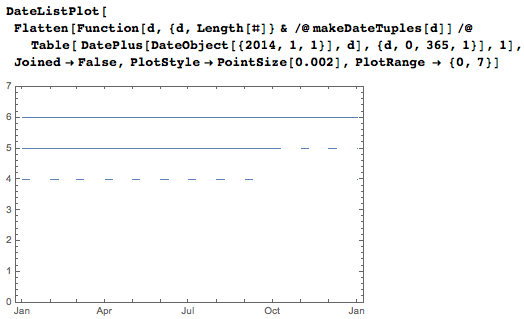
The following chart shows which days of the last year are represented by four, five, and six digits. The first nine days, from January to September, require four or five digits to record, and the last days of October, November and December require six.
For quick (for a constant time) repeated recognition of the sequence as a date, I will set the dateQ and datesOf functions . datesOf gives the normalized form of a sequence of date digits. Start by creating a pair of sequences and interpreting them as dates.

Here are some examples.
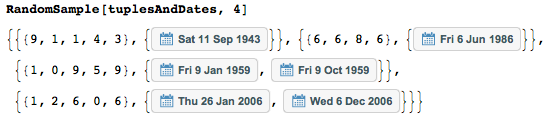
Most (77,350) sequences can be unambiguously interpreted as dates; some (2700) have two possible interpretations.

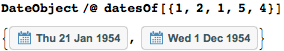
Here are some of the number sequences with two interpretations.

The sequence {1,2,1,5,4} has two interpretations — like January 21, 1954, or December 1, 1954 — reconstructed using the datesOf function.
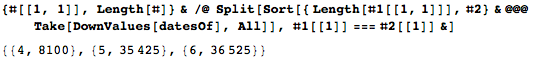
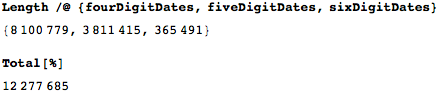
These are the numbers of four-, five-, and six-digit representations of dates.
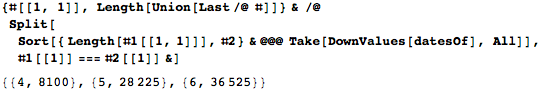
And this is the number of definitions for each of the types set for the datesOf function .
Find all dates in digits of pi
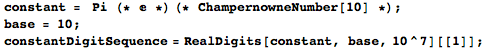
For all further calculations, I will use the first ten million decimal digits of pi (it will be shown later that ten million is enough to find any date in them). We can easily replace pi with any other constant (the code is universal).
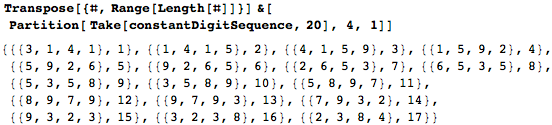
Instead of using the entire sequence of numbers as a string, I will use a sequence of numbers divided into (overlapping) sequences. Now you can quickly and independently work with each sequence. And I indexed the sequence of consecutive numbers of digits. For example:
Using the dateQ and datesOf functions defined above, I can now quickly find all the sequences of numbers that can be interpreted as dates.
Here are some found date interpretations. Each sublist has the form:
{date, startingDigit, digitSequenceRepresentingTheDate}
(date, start number, sequence of numbers representing the date).
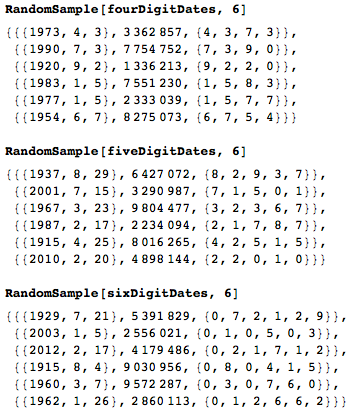
We found about 8.1 million dates represented by four digits ; about 3.8 million dates — five ; about 365 thousand dates - six , for a total of more than 12 million dates .
Note that I could use string processing functions (especially StringPosition ) to search for the positions of the sequence of dates. And, of course, I would get the same result.

While using StringPosition would be well suited for searching for a single date, working with all 35,000 sequences would take much longer.

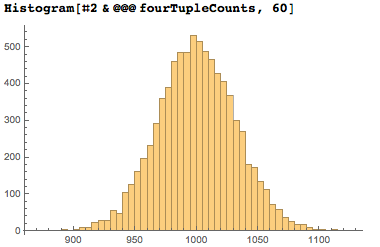
Let's stop for a second and look at the counter of the found sequences of 4 digits. Of the 10,000 possible four-digit sequences, 8,100 are used, with each of them appearing on average (1/10) ⁴ * 10⁷ = 10⁴ times, which follows from the "randomness" of the distribution of the digits of the number pi. I believe the standard deviation should be around 1000 ^ ½≈31.6. A small calculation and schedule confirm these figures.

The four-digit distribution curve for the number of different dates has the expected bell appearance.
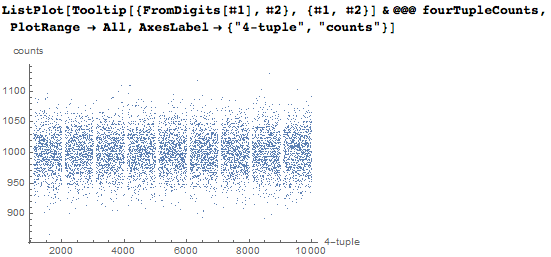
And the following graph shows how often each of the 4-digit sequences, which represents a certain date, appears in the first ten million digits of pi in a decimal representation. We numbered all 4-digit sequences by combining numbers into a number; as a result, you can see empty vertical stripes in areas in which 4-digit sequences do not represent dates.
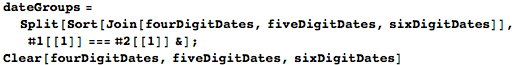
Now let's continue processing the found positions of dates. Group the results into sublists of identical dates.
Indeed, in the first 10 million digits there are all dates , that is, it turns out that 36,525 different dates were found (we will see later that the choice of the number of digits for the analysis was optimal).

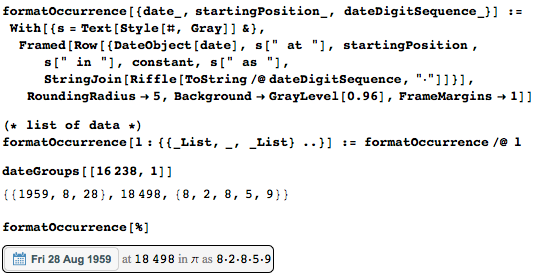
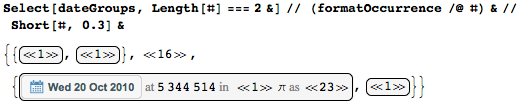
This is what a typical dateGroups member looks like.
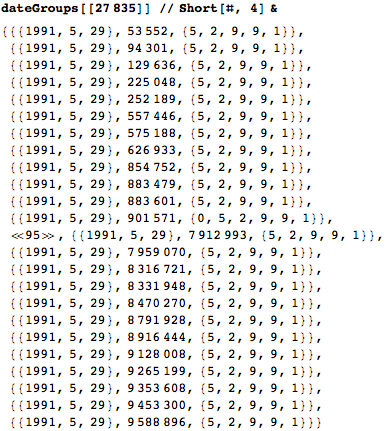
Statistics of all dates
Consider now the data found in terms of statistics. Here is the number of occurrences of each date in the first ten million digits of pi. It is interesting, and maybe even somewhat unexpected, but many dates occur hundreds of times. Periodically arising vertical stripes appear from October-November-December quarter.

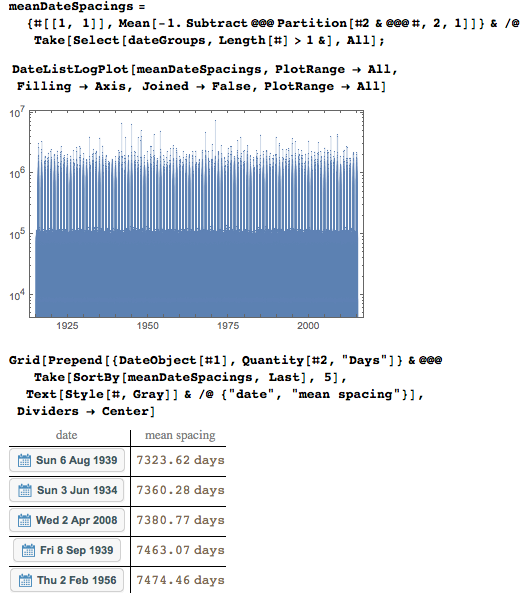
The average distance between dates also clearly shows the early appearance of four-digit year records with average intervals of less than 10,000, intervals of about 100,000 correspond to five-digit ones, and about 1,000,000 correspond to six-digit ones.
To facilitate readability, I formatted triples {date, StartingPosition, dateDigitSequence} individually.
The most frequent date among the first 10 million digits — August 6, 1939 — occurs 1,362 times.

Let's find now the rarest. These three dates are found only once.
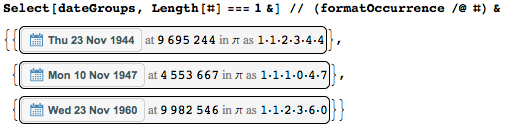
And these are two (the output of the result is shortened to save space).
Here is the distribution of the number of occurrences of dates. Three peaks corresponding to the four-, five-and six-digit representations of dates (from left to right) are clearly different. Dates that are represented by a sequence of 6 digits occur infrequently; as shown above, appear on average about 1200 times.

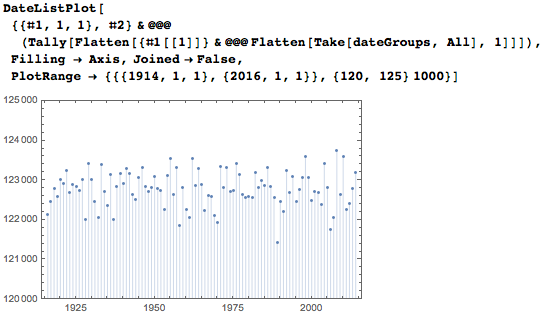
You can also collect and display dates by year (smaller values at the ends appear due to truncation of dates to ensure their uniqueness). The distribution is almost uniform.
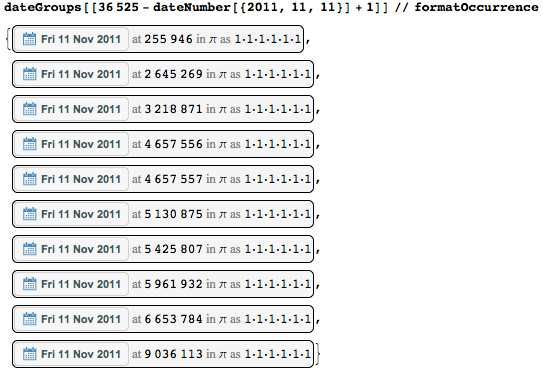
Let's look at dates with beautiful sequences of numbers and how often they appear. Since the results in dateGroups are sorted by date, I can easily access the specified dates. Say, where is the date 11-11-11?
And the date is 1-23-45?

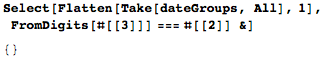
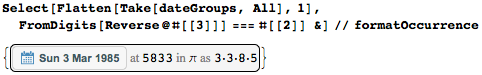
None of the dates begins at its own position (that is, there are no examples like the fact that January 1, 1945 [1-1-4-5] is at the position 1145).
But there is one “palindromic case”: March 3, 1985 (3.3.8.5) lies at palindromic position 5833.
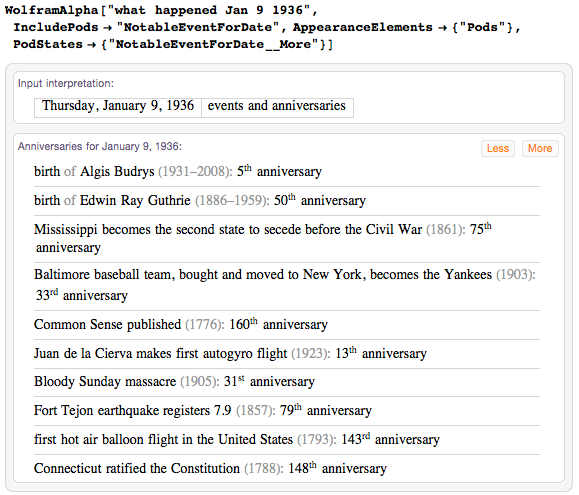
A very special date is January 9, 1936: it appears on the position of the 1936 prime number - 16 747.

Let's look at memorable events on this day in history.
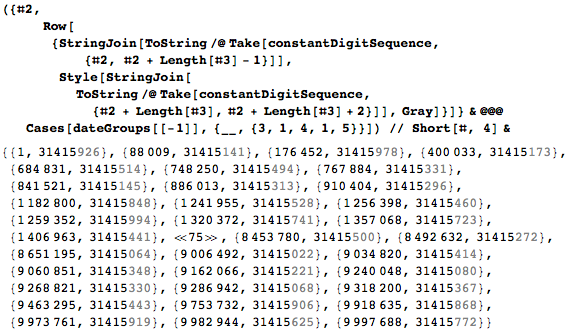
Since there was not a single date that would appear in its position, we can soften the conditions and find all the dates that are “superimposed” on their positions.

And more than 100 times in the first 10 million digits of pi you can meet a known combination of the first digits of pi - 314159.
Among pi, you can find not just dates of birthdays, but also days of physical constants, such as ħ-day (the day of the reduced Planck constant), which, for example, was celebrated as centuries-old on October 5, 1945.

Here are the positions of matching dates.
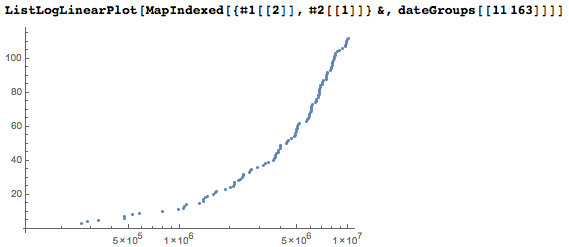
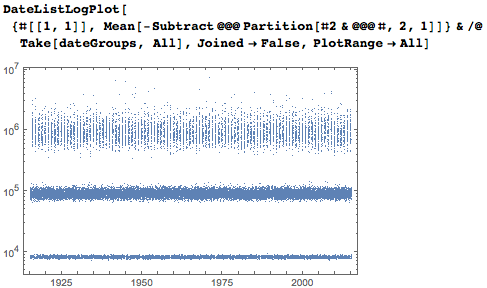
But an attempt to visualize the occurrence of all dates. In the plane of the date-numbers let's set the points for the beginning of each date. We use a logarithmic scale for the positions of numbers, and as a result, the number of points is much larger at the top of the graph.

For dates that appear early in numerical order, the final volume of dates in numbers can also be visualized. Dates are given in four or six digits. The following graph shows the numbers of all dates that begin in the first 10,000 digits.

After coarsening, the distribution becomes fairly uniform.
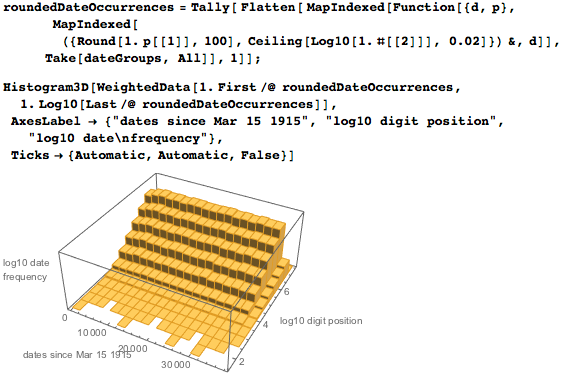
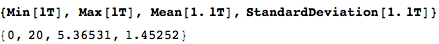
Until now, I took a date and looked at the position from which it begins in the sequence of digits of pi. Let's do the opposite now: how many dates contain this digit of pi? To find the total number of dates for each digit, you can cycle through the dates.

It turns out up to 20 dates for each digit.
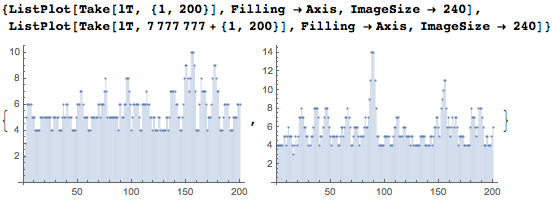
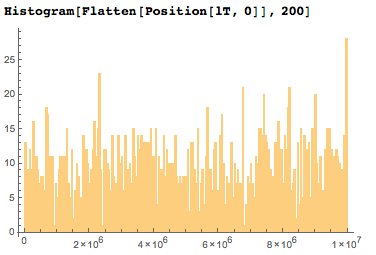
Here are two intervals of 200 digits each. We see that most of the numbers are in dates.
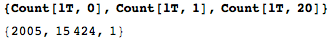
Above, I noted that I had about 12 million dates in the sequence of numbers. The sequence of numbers that I used is only ten million digits long, and each date contains about five digits. This means that all these dates need about 60 million digits. From this it follows that many of the ten million figures must be reused - on average, about five times. Only 2005 of the first ten million digits are not used in any of the sequences interpreted as dates, and this means that 99.98% of all digits are used in dates (not all in the first position).
And here is a histogram of the distribution of the number of dates present on each specific digit. It can be clearly seen without any special calculations, that on average there are about 6 dates per digit.

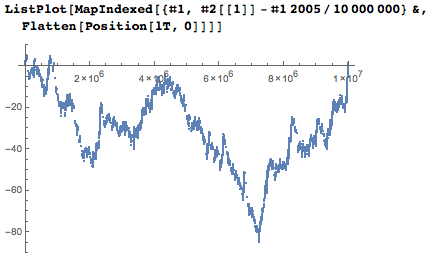
The 2005 non-single-digit numbers are fairly evenly distributed in the first ten million digits.
If I depict specific positions of unused numbers compared to their expected average position, then I will get something like a random walk schedule.
So who do unused numbers border with? There are 162 different neighborhoods of 5 digits. Looking at them, one can immediately see why the central number cannot be part of the date: too many zeros in the district .
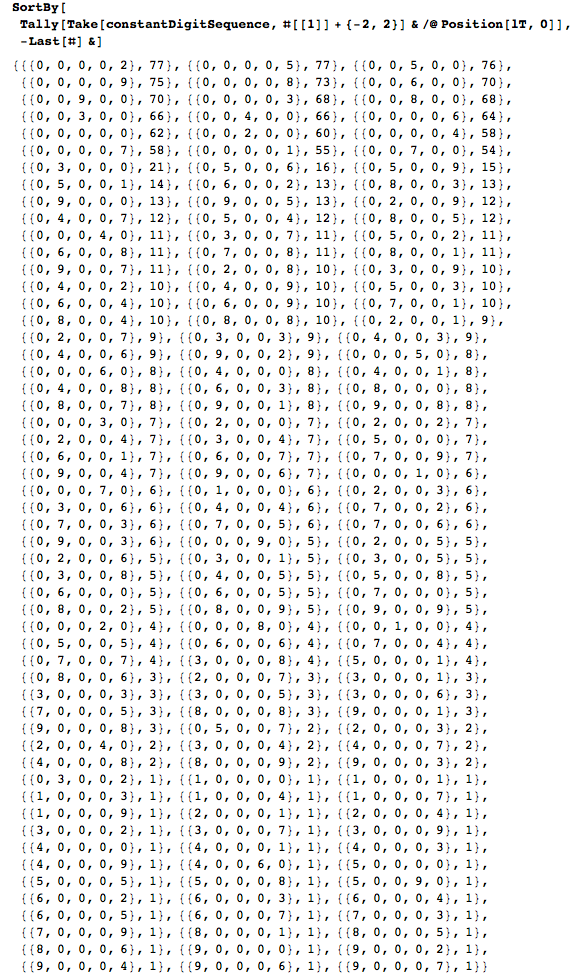
And the largest unused block of numbers is six numbers between positions 8 127 088 and 8 127 093.

Most digits overlap dates from different years. The graph below shows the range of years from early to late, as a function of the position of the digit.
Here are the unused numbers along with the three left and three right neighbors.

In order to illustrate the operation of the algorithm above, I will take a random number and find all the dates that "cover" it.
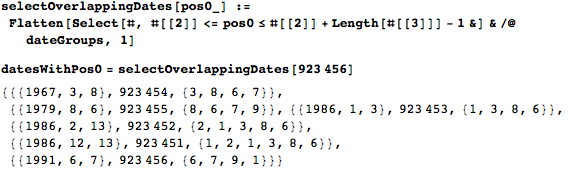
But the visualization of the "overlay" of dates.
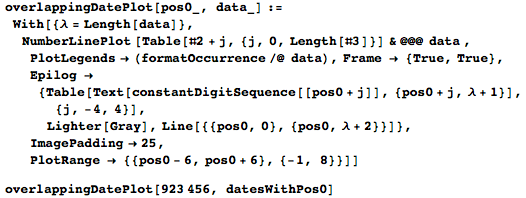
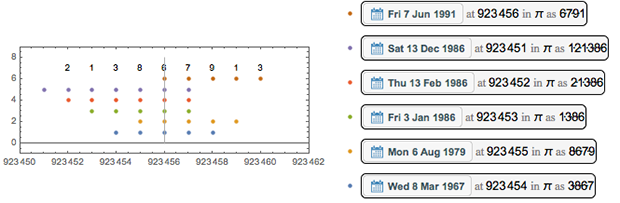
The most used figure - the unit at position 2 645 274 - is present on 20 different dates.

Here are the numbers in its neighborhood and possible dates.
If I build a year, starting with this number for a larger number of figures (say, for the first 10,000), then I will see a relatively dense coverage of dates on the plane of the number-date.

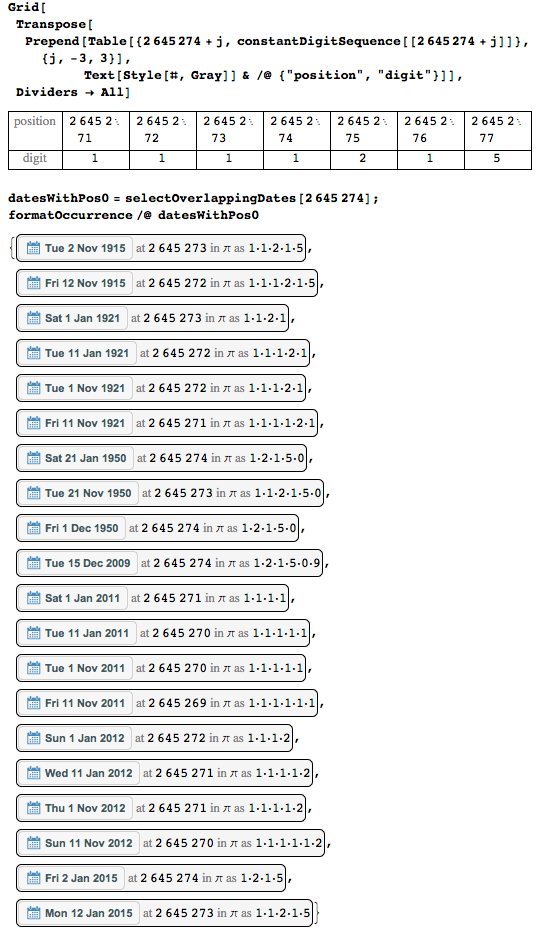
Let's now build a graph of related dates. We will consider two dates linked if they have at least one common digit (not necessarily the initial one).

Below is the same graph, only for the first 600 digits, but with dedicated communities.
We now calculate the average distance between two occurrences of the same date.
First date appearances
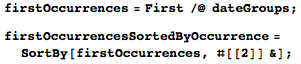
The first appearances of dates are most interesting, so let's extract them. We will work with two versions of the date list, the first is a list of lists of the form {date, first position of date} ( firstOccurrences ), and the second is the same list, sorted by position number in digits of pi ( firstOccurrencesSortedByOccurrence ).
All possible interpretations of dates are in the first ten digits of pi.

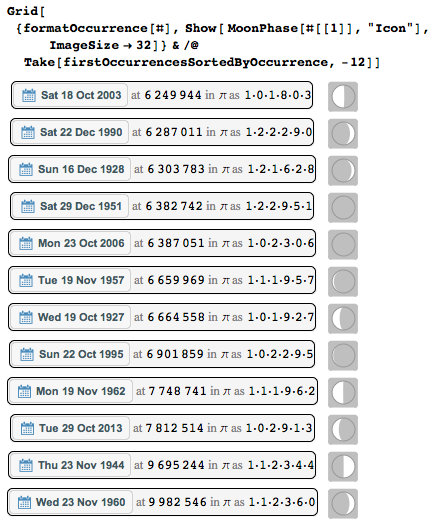
Or here's another extreme - dates that occur for the first time as late as possible.
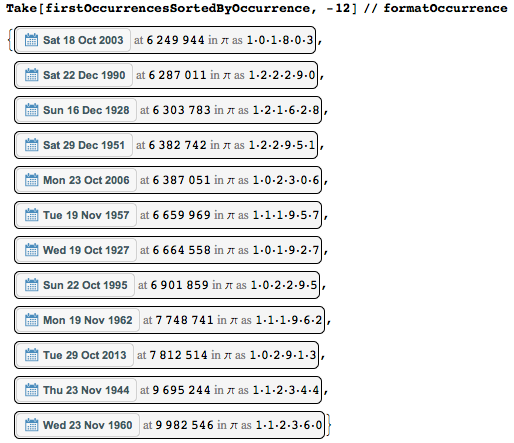
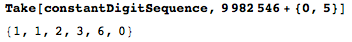
You can see that Wednesday November 23, 1960 begins only at position 9 982 546 (= 2 * 7 * 713039) - so, using only the first ten million digits, I was lucky to catch it. Here is a quick direct check of this “record” date.
And who are the lucky ones from famous people who were lucky to be born on this day?

And in what phases was the moon during each of the top 10 most “deeply buried” dates?
And while Wednesday, November 23, 1960 is the furthest date in a decimal sequence of numbers, the most recent position as a prime number corresponds to the date October 22, 1995.
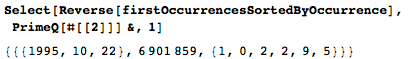
In general, it turns out that less than 10% of all dates appear on the positions in the form of prime numbers.

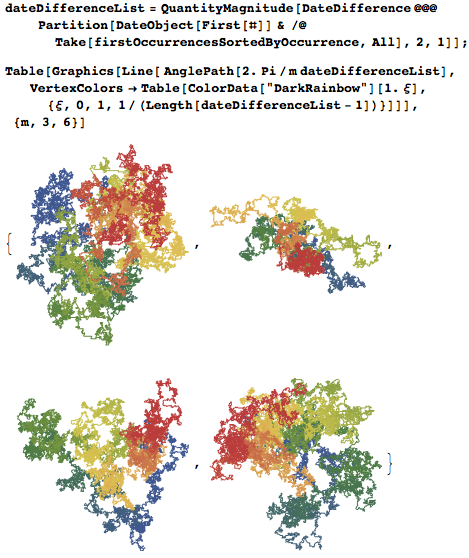
Often, some direct the digits of pi in a certain direction on a plane, forming random walks. We will do the same depending on the distance between the first occurrences of the dates. We obtain images of typical two-dimensional random walks.
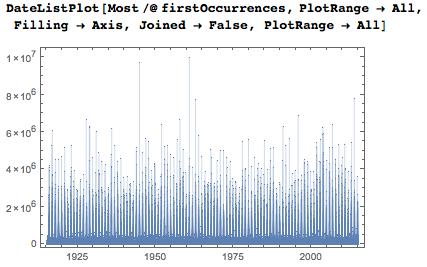
Here are the positions of the first appearances of dates in the last few years. Bursts in October, November and December of each year are caused by the need to set dates in five or six digits, while from January to September dates can be set with fewer digits if you omit the optional zeros.
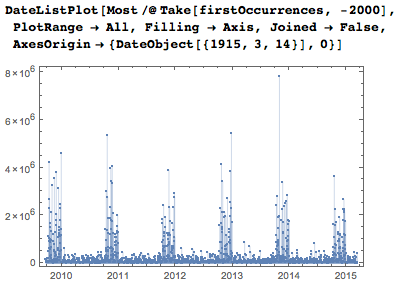
If I include all the dates, I get, of course, much more "dense" graphics.
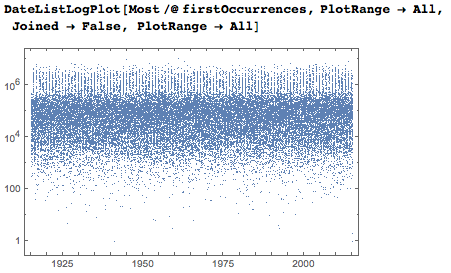
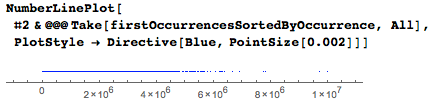
The logarithmic vertical axis shows that most dates first appear between the thousandth and the millionth digits.
To get a deeper and more intuitive understanding of general homogeneity and local “accidents” in a sequence of numbers (and, as a result, in dates), I will give a Voronoi diagram in the days-numbers plane based on the points of the first occurrences of dates. The decrease in density with increasing numbers due to the fact that I considered only the first appearance of dates.

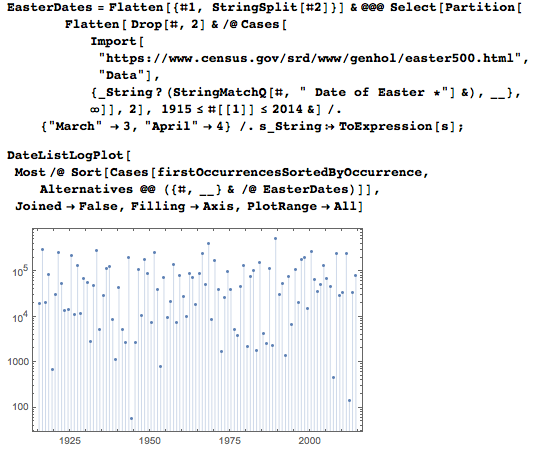
Easter Sunday is a great date for visualization, as it falls on different days each year.
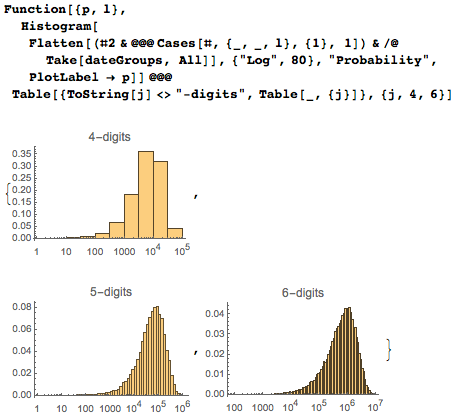
The average position of the first occurrence of a date, as a function of the number of digits required to indicate it, depends, of course, on the number of digits needed to encode it.

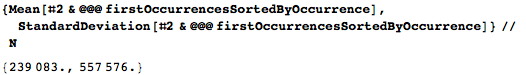
The average position of the first occurrence of the date falls on 239,083, but due to a spread of several million digits, the standard deviation is much larger.
Here are the first occurrences of "good" dates, formed by repeating a single digit.
The detailed distribution of the number of occurrences of the first dates has the greatest density in the first few tens of thousands of digits.
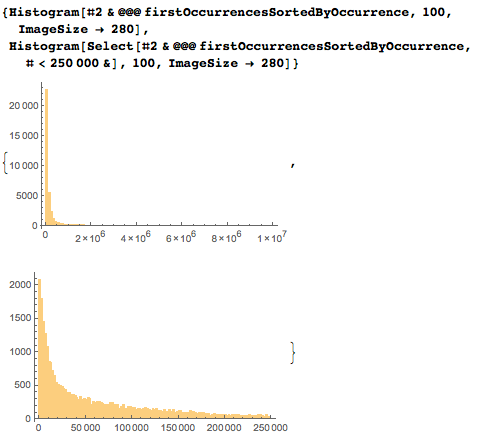
Logarithmic axes are much better suited to demonstrate distribution, but because of the increase in cell size, caution should be used in interpreting the maximum.
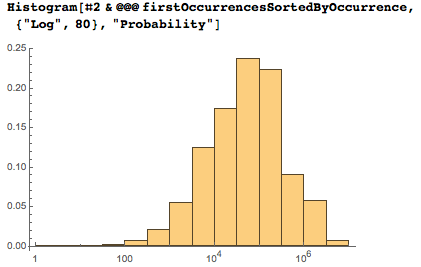
The latter distribution is essentially a weighted superposition of the first appearances of the four-, five-, and six-digit sequences.
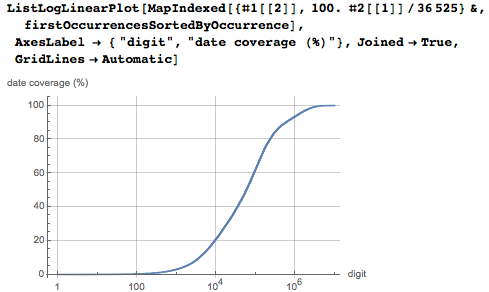
But the cumulative distribution of dates depending on the position of the figures. You can see that the first 1% of the ten million digits already contains 60% of all dates.
On even positions of dates it is slightly more, than on odd.

You can do the same for numbers that are multiples of three, four, and so on. The left image shows the deviation of each class of correspondences from the average value, and the right one - the greatest correspondences considered by the parity criterion.

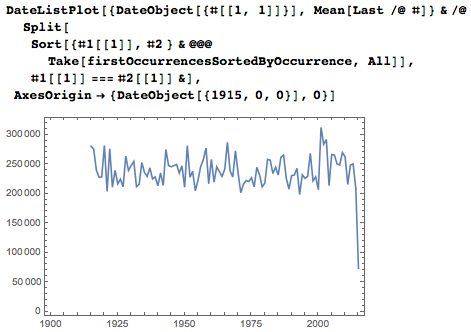
Actual numbers of first occurrences in each specific year fluctuate around the mean.
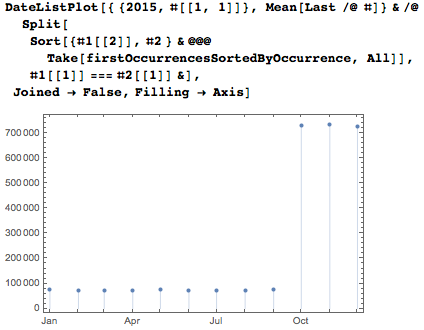
Average numbers of the first occurrences of dates, sorted by months, clearly distinguish between two-digit and single-digit entries for months.
Averages by days of the month (1-31) are mainly slowly increasing functions.

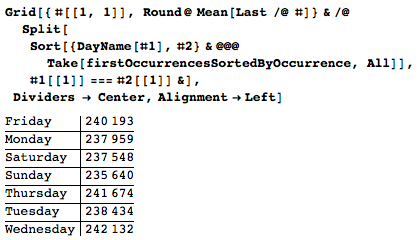
Finally, here are the average days of the week. Most of the first occurrences for dates fall on medium dates.
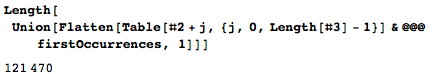
Above, I noted that most of the numbers are on some dates. Only a small number of digits are contained in dates that appear for the first time (121 470).
Some of the positions of the sequences overlap anyway, and I can form a network of chains of dates with overlapping sequences of numbers.

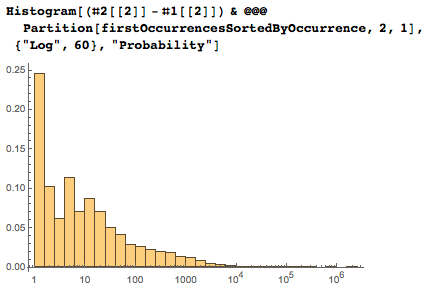
The following graph shows the increasing sizes of the gaps between successive dates.
Gap size distribution:
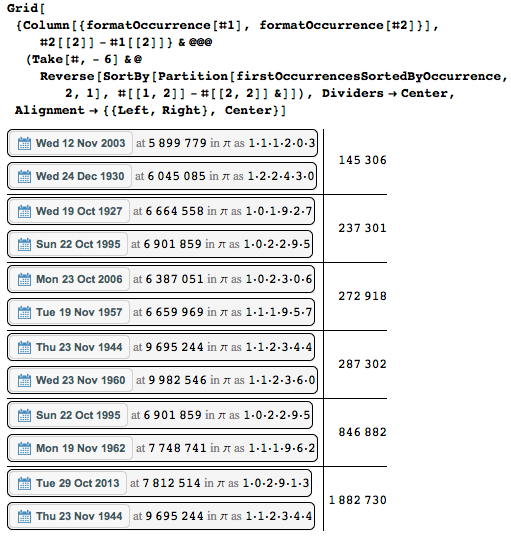
Here are a pair of the most distant from each other consecutive dates. In the penultimate figure, large gaps are clearly visible.
, ( ) .

:

, , .

, . ( ) . , (2015). .
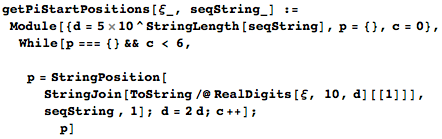
. , , 14 9:26:53. 3 • 1 • 4 • 1 • 5 ? (), 3 • 1 • 4 • 1 • 5?( ξs . , 3 • 1 • 4 • 1 • 5 , )
, :

.

TimelinePlot , Brett Champion, (. " Wolfram Language: TimelinePlot " ), , .

, (, e ), , . , ( , ChampernowneNumber [10]). e ? 21 2014? ? , .
Source: https://habr.com/ru/post/306420/
All Articles