Grafana Benefits for Testing
Good day!
As mentioned in previous posts, our company (RTL-Service) is engaged in a local positioning system. Before you - a new article from the testing department.
In the process of testing any objects (devices, server, client, ...) it is often necessary to know how the values of the parameters of these objects change over a period of time.
When setting device parameter values (signal transmission power, device polling cycle, and many others), there are situations when an enterprise engineer makes a mistake and sets an invalid parameter value. Errors are also possible during the development phase of the firmware, including an indication of an incorrect interval of permissible parameter values. To manually catch all the errors of this kind, you must try a huge number of different combinations of parameter values.
In our department, a project was written (in Python) to check the device firmware for the adequacy of the received parameter values. Within the framework of this project, requests for changing parameter values were constantly sent to the devices during the day. In this case, if a valid parameter value was sent, it was monitored that the device accepted the request and set the corresponding parameter value. If an invalid parameter value was sent to the device, then it was checked that the device rejected it and saved the “old” parameter value. Since alpha testing of the firmware, as a rule, only valid parameter values are sent to the devices, bugs appear as a result of the tests.
')
The practice of using the developed project showed that the bugfix is on. However, to establish the cause of these bugs, it took more time to determine how often an incorrect situation arises, at which points in time, with what frequency. The simplest solution to this problem is to build graphs. Of course, in python there are matplotlib libraries, etc., but the best option is to draw the parameter changes using dashboards.
There are a large number of dashboards in the network: Graphite , Grafana , Diamond , etc. But our choice fell on Grafana.
Grafana is quite simple to install and use, beautiful, allows you to apply mathematical manipulations with data and display a large number of metrics.

This miracle was created by a Swedish man named Torkel. See guides for installation and use here .
With this system, you can easily see how any parameters have changed: temperature, pressure, battery charge and other characteristics. Among other things, you can see that over the night or several days, one of the parameters, which should keep the same value, has not changed.
It is very convenient to track the parameters of devices when conducting autotests. For example, there is a change in the polling cycle of the device with an interval of 10 minutes. In this case, the dashboard will give a clear and illustrative idea of when and how the survey cycle changed.
In the picture below you can see how the temperature and battery charge changed from time to time for one of our devices:
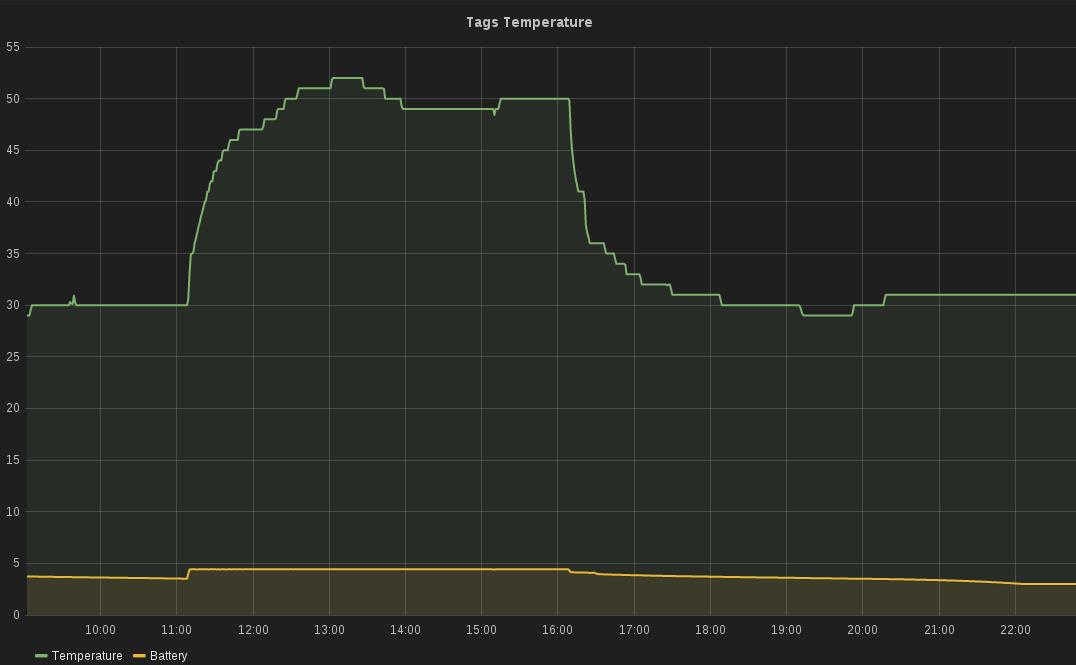
The graphs below show that with a sharp change in temperature readings changes the indication of the battery level.
The following is a clear graph of pressure changes:

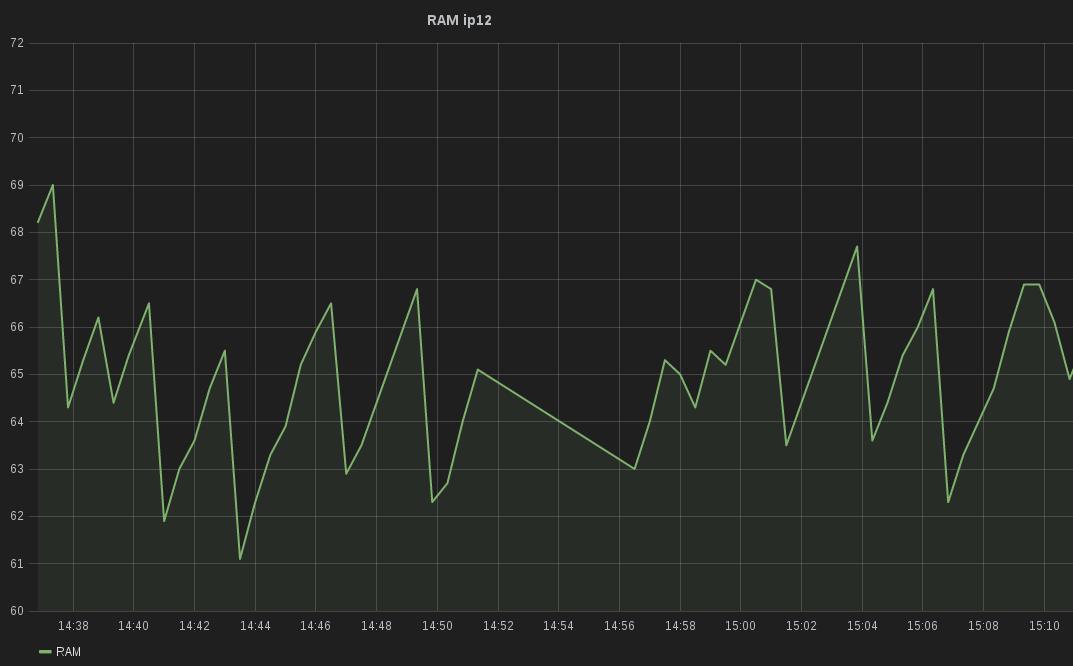
We use dashboards and to monitor the system load. The graph below shows the load of RAM of one of the servers.
In general, Grafana is a very convenient tool for monitoring different types of parameters, which will always come to the rescue.
In the next post from the testing department, we will use the example of one day in the life of a tester to show the specifics of work in our Quality Department.
As mentioned in previous posts, our company (RTL-Service) is engaged in a local positioning system. Before you - a new article from the testing department.
In the process of testing any objects (devices, server, client, ...) it is often necessary to know how the values of the parameters of these objects change over a period of time.
When setting device parameter values (signal transmission power, device polling cycle, and many others), there are situations when an enterprise engineer makes a mistake and sets an invalid parameter value. Errors are also possible during the development phase of the firmware, including an indication of an incorrect interval of permissible parameter values. To manually catch all the errors of this kind, you must try a huge number of different combinations of parameter values.
In our department, a project was written (in Python) to check the device firmware for the adequacy of the received parameter values. Within the framework of this project, requests for changing parameter values were constantly sent to the devices during the day. In this case, if a valid parameter value was sent, it was monitored that the device accepted the request and set the corresponding parameter value. If an invalid parameter value was sent to the device, then it was checked that the device rejected it and saved the “old” parameter value. Since alpha testing of the firmware, as a rule, only valid parameter values are sent to the devices, bugs appear as a result of the tests.
')
The practice of using the developed project showed that the bugfix is on. However, to establish the cause of these bugs, it took more time to determine how often an incorrect situation arises, at which points in time, with what frequency. The simplest solution to this problem is to build graphs. Of course, in python there are matplotlib libraries, etc., but the best option is to draw the parameter changes using dashboards.
There are a large number of dashboards in the network: Graphite , Grafana , Diamond , etc. But our choice fell on Grafana.
Grafana is quite simple to install and use, beautiful, allows you to apply mathematical manipulations with data and display a large number of metrics.
This miracle was created by a Swedish man named Torkel. See guides for installation and use here .
With this system, you can easily see how any parameters have changed: temperature, pressure, battery charge and other characteristics. Among other things, you can see that over the night or several days, one of the parameters, which should keep the same value, has not changed.
It is very convenient to track the parameters of devices when conducting autotests. For example, there is a change in the polling cycle of the device with an interval of 10 minutes. In this case, the dashboard will give a clear and illustrative idea of when and how the survey cycle changed.
In the picture below you can see how the temperature and battery charge changed from time to time for one of our devices:
The graphs below show that with a sharp change in temperature readings changes the indication of the battery level.
The following is a clear graph of pressure changes:
We use dashboards and to monitor the system load. The graph below shows the load of RAM of one of the servers.
In general, Grafana is a very convenient tool for monitoring different types of parameters, which will always come to the rescue.
In the next post from the testing department, we will use the example of one day in the life of a tester to show the specifics of work in our Quality Department.
Source: https://habr.com/ru/post/306406/
All Articles