What is big data, part 1
Big data is Big News, Big Importance and Big Business, but what is it really? What is big data? For those who live by them, everything is obvious, but I'm just stupid to ask such questions. But those who live by them think most people are stupid, right? Therefore, in the beginning I want to talk to those readers who, like me, are not in the subject. What is it all about? This week I plan to thoroughly investigate this issue, and, most likely, publish three long articles ( translator's note: translations of the following two parts will be released in the coming days ).
My PBS program “Triumph of the Nerds” is the story of a personal computer and its rise from 1975 to 1995. “Nerds 2.01: A Brief History of the Internet” (“Nerds 2.01: A Brief History of the Internet ") Is the story of the rise of its popularity from 1966 to 1998. But each issue was in fact about the influence of Moore's law on technology and society. Personal computers have become possible only when the cost of microprocessors has dropped to the amount available to the common man. It was impossible until the turning point when the market was ready for explosive growth.
')
 The commercial Internet, in turn, became possible only when the price of servers fell another two orders of magnitude, by the mid-1990s, which made dial-up economically viable and led to the next critical point. If you think in the same terms, big data is what happened when the cost of computing dropped another two orders of magnitude by 2005, leading to the most recent critical point. We pretend that this happened earlier, in 1998, but this is not so (this is part of the story). 2005 marked the advent of mobile and cloud computing, and the beginning of the era of big data. Just as it was shown in my two documentaries, we, the people, are again standing on the threshold of a new era in almost complete misunderstanding: how we got here or what all this means.
Personal computers have changed America, the Internet has changed the world, but Big Data transforms the world. They will rule the development of technology over the next hundred years.
Wherever you are, computers monitor you and record data about your activity, noting, first of all, what you are watching, reading, looking at or buying. If you go out in almost any city, then video surveillance is added to this: where are you, what are you doing, who or what is nearby? Your messages are partially heard, and sometimes even recorded. Everything that you do on the Internet - from comments on tweets to simple browsing - is never erased from history. This is partly due to national security. But the main goal of this technology is simply to make you buy more things, make you a more efficient consumer. The technology that allows you to collect and analyze data was invented for the most part in Silicon Valley by many technological startups.
Why are we in this position, and what will happen next? Technologies, of course, will continue to expand their horizons, but this time, instead of inventing the future and participating in progress, geeks will sail in the same boat as everyone else: new achievements like self-driving cars, universal translators and even computers developing other computers. will not arise through the human mind, but through the machines themselves. And blame it all Big data.
Big data is the accumulation and analysis of information to extract values.
Data is information about the state of something: who, what, why, where and why is playing spy games, how the disease spreads or how the popularity of the pop group changes. Data can be collected, stored and analyzed in order to understand what is happening: whether social media really launched the Arab Spring, whether DNA decoding can prevent diseases or who wins the election.
Although the data surrounded us in the past, we did not use them, mainly due to the high cost of storage and analysis. Being hunter-gatherers of the first 190,000 years of a reasonable person’s life, we didn’t collect data at all, since there was no way to store or even write. Writing appeared about 8,000 years ago, primarily as a way of storing data during the period of culture formation, when we wanted to record our stories, and later there was a need to keep lists of population, taxes and mortality.
Lists are usually binary — you are either in it, or you are not, you are alive or dead, pay taxes or not. Lists are needed for calculation, not calculation. Lists may contain semantic meaning, but not often. The need to understand the meaning of higher forces and phenomena led us from calculations to calculations.
 Thousands of years ago, the cost of recording and analyzing data for the public was so high that only religion could afford it. In an attempt to explain the mystical world, our ancestors began to look at the sky, notice the movement of stars and planets, and for the first time began to record this information.
Religion, which has already led to writing, then led to astronomy, and astronomy led to mathematics — all in search of the mystical meaning of the heavenly movement. For example, calendars were not invented, they were the result of summarizing the data.
Throughout history, data was used to account for taxes and population censuses, for general accounting. Take for example the "Book of the Last Judgment" of 1086 - in fact, the main tax base of Britain. Everywhere is hidden the term counting . Most of the data collected throughout history was recorded by counting. If it was necessary to consider a lot of information (more than a few observations needed for a scientific experiment), it was almost always associated with money or another expression of power (how many soldiers, how many taxpayers, how many male babies under two years of age in Bethlehem?). Each time you calculate, the result is a number, and numbers are easy to store by writing them down.
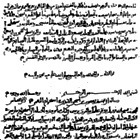 As soon as we began to accumulate knowledge and write them down, we had a natural need to hide them from others. This gave rise to codes, ciphers and statistical methods for hacking them. The ninth-century scientist Abu Yusuf al-Kindi wrote "A manuscript for decrypting encrypted messages," marking the beginning of statistics — the search for data values, cryptanalysis, and cracking of codes.
In his book, al-Kindi promoted a method currently called frequency analysis to help crack codes with an unknown key. Most codes were wildcard ciphers, where each letter was replaced by another. Knowing which letter corresponded to which one, the message can be easily deciphered. The idea of Al-Kindi was that if you know the frequency of use of letters in normal communication, then this frequency will go unchanged in a coded message.
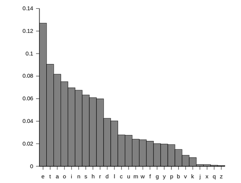 In English, the most frequent letters are E, T, A, and O (in that order). When a coded message is large enough, the most common letter should be an E, and so on. If you hit Q, it will almost always be U, etc. after it. Of course, except when the target language is not English.
The key to any frequency substitution task is knowledge of the relative frequency for any language, and that means counting letters in thousands of ordinary documents. This is a collection and analysis of sample data from 900 AD.
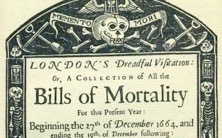 But only 800 years after al-Kindi, the collected data became available for wide public use. In London, weekly, starting in 1603, lists of mortality (“Bills of mortality”) were published to keep records of all registered deaths in the city (Drag your dead!). These weekly reports were later published in the annual issue, and here the fun begins. Although the lists were made simply for public knowledge, their value was revealed in the process of analyzing these pages after the plague of 1664–65. Experts were able to plot how the disease spread from infected areas throughout London, combining information with a map of a primitive city water supply and sewage system. The sources of infection (mosquitoes and rats) and how to stay away from them (to be rich, not poor) became clear from this data. This is how public health research began.
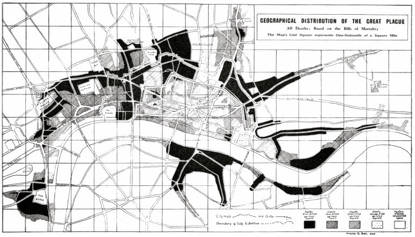
The main benefit of mortality lists was not in the information about the dead (just numbers), but in the metadata (data about the data), which showed where the victims lived, where they died, their age and type of work. The history of the plague 1664 can be traced by marking the metadata on the map.
Despite the fact that the death lists were considered complete reports on the plague, I doubt that they were accurate. Many deaths probably were not recorded or indicated for the wrong reasons. But the statistics led to one conclusion: the dynamics is clearly visible even if there is not enough data. When statistics began to develop in France in the 18th century as an independent discipline, it became clear that as much of the information as possible could be extracted from a random sample of data. We see this today when political sociologists predict election results based on small samples of random voters. At the same time, major errors that sometimes occur with researchers show that the sampling method is far from perfect.
Sampling and polling give the results we believe in , but a 100% sample like a census or election gives the results we know .
Data processing. Data storage is not at all like processing it. Libraries store data well, but access is difficult. You still need to find a book, open it, read it, but even after that the level of detail we can achieve is limited by our memory.
At the end of the 19th century, American statistician Hermann Hollerith conceived a system that would automatically collect data and record it with the help of holes on paper maps. Maps that can be mechanically sorted for retrieving values from data. This process is called Hollerith tabulation (“tabulating”). Hollerith received a patent for technology, and his Tabulating Machine Company, located in Washington, eventually turned into a modern International Business Machines (IBM).
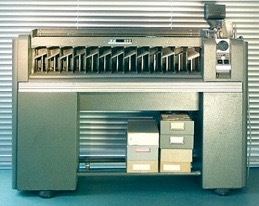 For decades, the main machine function of IBM has been sorting. Imagine each card was a customer account of an electric company. The machine facilitated work on the organization of the client base in alphabetical order, by last name, and sorted them by the date of invoicing, by amount of debt, by the presence or absence of debts, and so on. At that time, data processing implied sorting, and punch cards did an excellent job with this task. Of course, people are also capable of this job. But the machines save time, so they are used primarily to ensure that all bills are sent before the end of the month.
The first databases were a handful of such punched cards. And the electric company was easy to decide what should be on the map. Name and address, electricity consumption in the current billing period, the date when the bill should be sent and the current status of payment: do you pay your bills?
But what if you needed to add a new product or service? It would be necessary to add a new field with data on each card, including all existing cards. Such changes made mechanical sorters a curse. For the sake of greater flexibility in the 1950s, a new kind of database emerged that changed the world of business and travel.
Transaction processing American Airlines SABER reservation system was the first real-time automated system in the world. This is not only the first booking system, but the world's first computer system for interacting with operators in real time, where everything happened completely in the computer. Prelude to Big Data. It all worked when we were still manually tracking Russian bombers.
Before SABER, data processing always took place after events. Accounting systems looked at a quarter or a month ago and figured out how to present what has already happened. And this process lasted as long as necessary. But SABER was selling tickets for the future, based on information about places stored exclusively in the computer.
Imagine that SABER is a shoebox that contains all the tickets for all seats on AA 99 flight. Selling tickets from the shoebox will protect you from selling one seat twice, but what if you need to sell seats at the same time through agents in different offices throughout the country? This requires a computer system and terminals, which at that time did not exist. The founder of American Airlines S.P. Smith needed to fly on an airplane next to T. Watson from IBM to launch this process.
 A key moment in the history of SABER: IBM did not have a suitable computer to start the system, as the task was demanding of resources. So American Airlines became the first customer of the largest computers manufactured in those years. For the tasks of the airline did not write programs. Instead, computers in the first corporate data center in the world, in Tulsa, Oklahoma (he is still there), were focused exclusively on the sale of airline tickets, and could not do anything else. Programs appeared later.
American Airlines and SABER pulled IBM into the mainframe business. And the design of those first systems AA and IBM were engaged in jointly.
SABER has set the general direction for data-driven computing applications from the 1950s to the 1980s. Cashiers in the bank finally had computer terminals, but just like when booking air tickets, their terminals could perform only one task - banking - and the data of bank clients were usually stored on a punched card in 80 columns.
Moore's Law . When computers began to be used for data processing, their speed allowed them to delve into this data, revealing more meaning. The high cost of computers limited their use to such profitable areas as the sale of airline tickets. But the advent of computers with solid-state electronics in the 1960s marked the beginning of a steady increase in the power of computers and a reduction in their cost, which continues today. This is Moore's law. What American Airlines cost was $ 10 in 1955, by 1965 it was reduced to ten cents, by 1975 to one tenth of a cent and to one billion cent today.
The power of the entire computer system SABER in 1955 was less than the power of a modern mobile phone.
 The influence of Moore's law and, most importantly, the ability to reliably predict at what stage the cost of computers and their capabilities will be in ten or more years, allows you to apply computational power to cheaper fields of activity. This is what turned data processing into Big Data.
But for this to happen, we had to get away from the need to create a new computer every time we needed a new database. Instead of iron, software had to come to the fore. And the programs, in turn, should have become more open to modification, as the needs of the government and industry changed. The solution was a relational database management system. The concept was developed at IBM, but it was introduced to the world by a startup from Silicon Valley - Oracle Systems under the direction of Larry Ellison.
Allison launched Oracle in 1977 with a budget of $ 1,200. Now he (depending on when you read this) is the third richest person in the world and the prototype of the protagonist of the film "Iron Man".
Before Oracle, the data was tables - rows and columns. They were stored in the computer's memory, if there is enough space in it, or were recorded on a magnetic tape and read from it if there was not enough memory, which usually happened in the 70s. Such flat file databases were fast, but it was often not possible to change the logical links between these data. If there was a need to delete the record or change the variable, it was necessary to change everything and design a completely new database, which was then recorded on the tape.
For flat file databases, changes and search for meaning were difficult.
Ted Codd of IBM, an expat from England, a mathematician who worked in San Jose, California, began to think in the 1970s about something more advanced than a flat file base. In 1973, he wrote an article that described a new relational database model where it was possible to add and delete data, and important data links could be redefined on the fly. Where, prior to the Codd model, the payroll system was the payroll system and the inventory system was the inventory system, the relational approach separated the data from the application that processed them. Codd represented a common database that simultaneously had attributes for both the payment and inventory systems, and it could be changed as needed. And for the first time, the query language was present - a formal way to request data with flexible ways to manage this data.
, IBM , , Oracle.
 Oracle , , , . , IBM Microsoft, , Oracle . -, : , CRM, , -. - , . - — .
. , Oracle, , , -, « ». , . 1987 , 1991. , . , , , , , Oracle . (Structured Query Language SQL), . , - .
. , , . , , « ?» , « ?», : « »?
, , ? ? amazon.com . .
Amazon.com , - (stateless). ? Xerox PARC . NO MODES ( ). , , . : Ctrl, , , . , — , Xerox Alto . - Alto , World Wide Web, . «stateless».
Amazon, . — , . Amazon, , , . ( , ), , .
 Amazon , - , -.
, , - , , « ?». , , , , . — — .
Amazon Oracle $150 , , , . Amazon , , , . , .
, 1996 , - $3–5 , Amazon $150 , . ? .
, Amazon.com $347 , $59 .
, , , Oracle, SQL, — .
(Translation by Natalia Bass )
Source: https://habr.com/ru/post/305738/
All Articles