The best packages for machine learning in R, part 1
One of the most common questions faced by data processing and analysis specialists is “Which programming language is best used for solving machine learning problems?” The answer to this question always leads to a difficult choice between R, Python and MATLAB. Generally speaking, no one can give an objective answer, which programming language is better. Of course, the language you choose for machine learning depends on the limitations of the specific task and data, the preferences of the specialist himself and those machine learning methods that need to be applied. According to the survey about Kaggle users' favorite tool, 543 out of 1714 prefer to solve R data analysis problems.
Now in CRAN 8341 package is available. In addition to CRAN , there are other repositories with a large number of packages. The syntax for installing any of these is simple:
Here are a few packages that you can hardly do without as a data analyst:
If you need to decide what to do with the missing values, MICE is exactly what you need. When a problem of missing values arises, the most common way to solve it is to simply replace them: with zeros, average, fashion, etc. However, none of these methods are flexible and can lead to inconsistencies in the data.
')
MICE can help you replace missing values using a variety of techniques, depending on the data you are working with.
Let's look at an example of using MICE.

So, we have created a random data block, intentionally introducing several missing values into it. Now you can look at the work of MICE and stop worrying about their account.
In the MICE example, we used the default values, but you can read about each of the parameters and change them to suit your requirements.
2. Package
The
The
rpart is an abbreviation that stands for Recursive Partitioning and Regression Trees (recursive partition and regression trees). Using rpart, you can apply both regression and classification. If we talk about syntax, it is quite simple:
Let's look at the

Let's say our goal is to predict species on a decision tree; This can be implemented with a single line of code:
Here you can see the separation of different vertices and the predicted class.
To predict based on a new dataset, you can use the simple function
3.
The
Let's build a tree using the same example as above.
Here is what the constructed tree will look like:

This package also has a prediction function; it is good to use it to predict classes based on new input data.
4.
It is possible to facilitate the construction of prediction models due to special built-in functions for splitting data, selecting important features, preprocessing data, assessing the importance of variables, and setting up the model through resampling and visualization.
The
After installing the
To build prediction models,
The
In short, it is a must-have R package that will satisfy all your requirements for building prediction models.
Now in CRAN 8341 package is available. In addition to CRAN , there are other repositories with a large number of packages. The syntax for installing any of these is simple:
install.packages(“Name_Of_R_Package”) .Here are a few packages that you can hardly do without as a data analyst:
dplyr, ggplot2, reshape2 . Of course, this is not a complete list. In this article we will focus more on the packages used in machine learning.1. MICE package - take care of missing values
If you need to decide what to do with the missing values, MICE is exactly what you need. When a problem of missing values arises, the most common way to solve it is to simply replace them: with zeros, average, fashion, etc. However, none of these methods are flexible and can lead to inconsistencies in the data.
')
MICE can help you replace missing values using a variety of techniques, depending on the data you are working with.
Let's look at an example of using MICE.
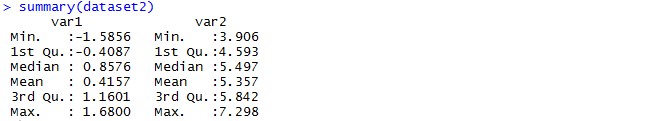
dataset <- data.frame(var1=rnorm(20,0,1), var2=rnorm(20,5,1)) dataset[c(2,5,7,10),1] <- NA dataset[c(4,8,19),2] <- NA summary(dataset) So, we have created a random data block, intentionally introducing several missing values into it. Now you can look at the work of MICE and stop worrying about their account.
install.pckages(“mice”) require(mice) dataset2 <- mice(dataset) dataset2<-complete(dataset2) summary(dataset2) In the MICE example, we used the default values, but you can read about each of the parameters and change them to suit your requirements.
2. Package rpart : let's divide the data
The
rpart package in the R language is used to construct classification and regression models using a two-step procedure, and the result is represented in the form of binary trees. The easiest way to build a regression or classification tree using rpart is to call the function plot() . By itself, the function plot() may not give a fairly beautiful result, so there is an alternative - prp() - a powerful and flexible function. prp() in the rpart.plot package rpart.plot often called the real Swiss knife for building regression trees.The
rpart() function allows you to establish a relationship between the dependent and independent variables to show the variance of the dependent variable based on the independent ones. For example, if an online training company wants to know how sales (dependent variable) are affected by promotion in social networks, newspapers, referral links, word of mouth, etc., there are several functions in rpart that can help with the analysis of this phenomenon.rpart is an abbreviation that stands for Recursive Partitioning and Regression Trees (recursive partition and regression trees). Using rpart, you can apply both regression and classification. If we talk about syntax, it is quite simple:
rpart(formula, data=, method=,control=) Here, the formula contains a combination of dependent and independent variables; data is the name of the data array, method depends on the target, i.e. for a classification tree, this will be a class; control depends on your requirements, for example, you need a variable with a minimum value to separate the vertices.Let's look at the
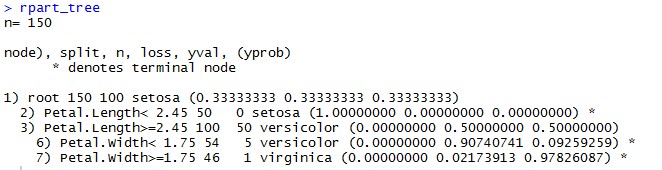
iris dataset, which looks like this:Let's say our goal is to predict species on a decision tree; This can be implemented with a single line of code:
rpart_tree <- rpart(formula = Species~., data=iris, method = 'class') summary(rpart_tree) plot(rpart_tree) Here is what a built tree looks like:Here you can see the separation of different vertices and the predicted class.
To predict based on a new dataset, you can use the simple function
predict(tree_name,new_data) , which will predict(tree_name,new_data) predictable classes as a result.3. PARTY : let's divide the data again
The
PARTY package in R is used for recursive separation and displays continuous improvement of ensemble methods. PARTY is another package for building decision trees based on the conditional inference algorithm. ctree() is the main function of the PARTY package, it is widely used and reduces training time and possible deviations.PARTY has a syntax similar to other predictive analytics functions in R, i.e. ctree(formula,data) The function will build a decision tree, taking the default values for numerous arguments, you can change them if necessary.Let's build a tree using the same example as above.
party_tree <- ctree(formula=Species~. , data = iris) plot(party_tree) Here is what the constructed tree will look like:
This package also has a prediction function; it is good to use it to predict classes based on new input data.
4. CARET : Classification And REgression Training (classification and regression training)
CARET - Classification And REgression Training (classification and regression training) is designed to combine training and forecasting models. There are several algorithms in the package that are suitable for different tasks. A data analyst cannot always say exactly which algorithm is best for solving a particular task. The CARET package allows CARET to choose the optimal parameters for the algorithm using controlled experiments. The cross-search method implemented in this package searches for parameters by combining various methods for evaluating model performance. After going through all the possible combinations, the cross-search method finds the combination that gives the best results.It is possible to facilitate the construction of prediction models due to special built-in functions for splitting data, selecting important features, preprocessing data, assessing the importance of variables, and setting up the model through resampling and visualization.
The
CARET package is one of the best in R. The developers of this package understood how difficult it is to choose the most suitable algorithm for each task. There are cases when a particular model is used, and there are doubts about the quality of the data, but still the problem most often turns out to be in the chosen algorithm.After installing the
CARET package, CARET can execute names(getModelInfo()) and see a list of 217 available methods.To build prediction models,
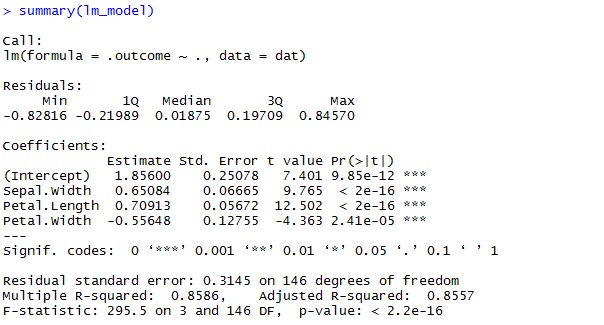
CARET uses the train() function. Its syntax is: train(formula, data, method) Here method is the prediction model you are trying to build. Let's use the iris data array and the linear regression model to predict Sepal.Length. Lm_model <- train(Sepal.Length~Sepal.Width + Petal.Length + Petal.Width, data=iris, method = “lm”) summary(lm_model) The
CARET package not only builds models, but also breaks the data into test and training, makes the necessary transformations, etc.In short, it is a must-have R package that will satisfy all your requirements for building prediction models.
Source: https://habr.com/ru/post/305692/
All Articles