Ruby Memory Troubleshooting Guide

Surely there are lucky Ruby developers who have never suffered from memory problems. But everyone else has to spend an incredible amount of energy to figure out why memory usage has gone out of control and eliminate the causes. Fortunately, if you have a fairly modern version of Ruby (starting with 2.1), then you have access to great tools and techniques for solving common problems. It seems to me that memory optimization can bring joy and satisfaction, but I can be alone in my opinion.
As with all forms of optimization, it is possible that this will lead to more complex code. So it’s not worth it if you don’t get measurable and significant benefits.
All the procedures described below are performed using canonical MRI Ruby 2.2.4, but other versions 2.1+ should work in the same way.
')
This is not a memory leak!
When a memory problem arises, only one thing comes to mind first - a leak. For example, you can see in a web application that after starting a server, repeated calls to the same function consume more and more memory each time. Of course, there are indeed leaks, but I’m ready to argue that there are many more problems that look like leaks, but they are not.
Consider a fictional example: over and over again we will create and drop a large array of hashes. Here is the part of the code that will be used in various examples in this article:
# common.rb require "active_record" require "active_support/all" require "get_process_mem" require "sqlite3" ActiveRecord::Base.establish_connection( adapter: "sqlite3", database: "people.sqlite3" ) class Person < ActiveRecord::Base; end def print_usage(description) mb = GetProcessMem.new.mb puts "#{ description } - MEMORY USAGE(MB): #{ mb.round }" end def print_usage_before_and_after print_usage("Before") yield print_usage("After") end def random_name (0...20).map { (97 + rand(26)).chr }.join end Build an array:
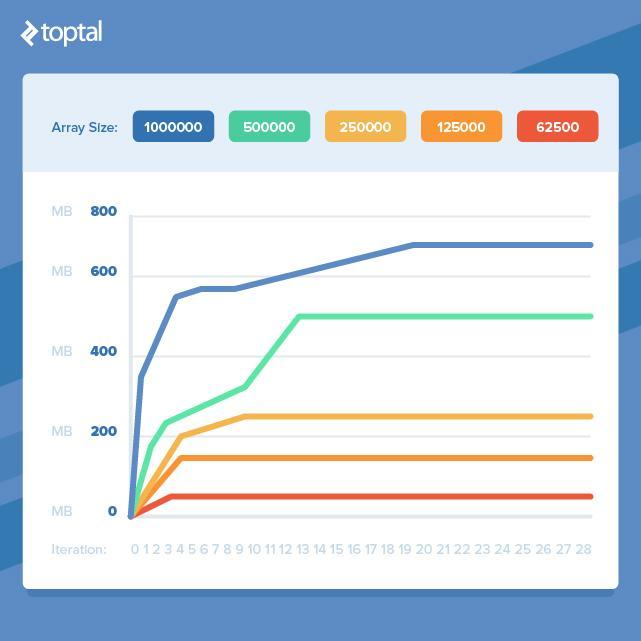
# build_arrays.rb require_relative "./common" ARRAY_SIZE = 1_000_000 times = ARGV.first.to_i print_usage(0) (1..times).each do |n| foo = [] ARRAY_SIZE.times { foo << {some: "stuff"} } print_usage(n) end get_process_mem is a convenient way to get information about the memory used by the current Ruby process. We see the behavior described above: a gradual increase in memory consumption.
$ ruby build_arrays.rb 10 0 - MEMORY USAGE(MB): 17 1 - MEMORY USAGE(MB): 330 2 - MEMORY USAGE(MB): 481 3 - MEMORY USAGE(MB): 492 4 - MEMORY USAGE(MB): 559 5 - MEMORY USAGE(MB): 584 6 - MEMORY USAGE(MB): 588 7 - MEMORY USAGE(MB): 591 8 - MEMORY USAGE(MB): 603 9 - MEMORY USAGE(MB): 613 10 - MEMORY USAGE(MB): 621 But if you perform more iterations, consumption growth will stop.
$ ruby build_arrays.rb 40 0 - MEMORY USAGE(MB): 9 1 - MEMORY USAGE(MB): 323 ... 32 - MEMORY USAGE(MB): 700 33 - MEMORY USAGE(MB): 699 34 - MEMORY USAGE(MB): 698 35 - MEMORY USAGE(MB): 698 36 - MEMORY USAGE(MB): 696 37 - MEMORY USAGE(MB): 696 38 - MEMORY USAGE(MB): 696 39 - MEMORY USAGE(MB): 701 40 - MEMORY USAGE(MB): 697 This suggests that we are not dealing with a leak. Either the leak is so small that we do not notice it compared to the rest of the memory used. But it is not clear why memory consumption grows after the first iteration. Yes, we create a large array, but then correctly reset it to zero and begin to create a new one of the same size. Is it not possible to take the same memory that was used by the previous array?
Not.
In addition to setting up the garbage collector, you cannot control the time it starts. In our example of
build_arrays.rb we see that new memory allocations are made before the garbage collector cleans up our old, dropped objects.Do not worry if you find an unexpected increase in memory consumption by your application. There can be many reasons for this, not just leaks.
I must point out that we are not talking about some kind of nightmare memory management characteristic of Ruby. But the question as a whole is related to all languages used by garbage collectors. To verify this, I reproduced the above example on Go and got a similar result. True, it uses Ruby libraries, which could be the cause of this memory problem.
Divide and rule
So, if we need to work with large amounts of data, then we are doomed to lose a lot of RAM? Fortunately, this is not the case. If we take the previous example and reduce the size of the array, we will find that the memory consumption will even out earlier.
This means that if we can break our work into smaller fragments and process it to eliminate the simultaneous use of a large number of objects, we will avoid a strong increase in memory consumption. Unfortunately, for this, you often have to take clean and beautiful code and turn it into a more cumbersome one, which does the same thing, but more efficiently in terms of memory.
Isolating memory hot spots
Often in the code, the source of the memory problem is not as obvious as in the
build_arrays.rb example. You must first isolate the cause and only then begin to study it, because erroneous conclusions about the cause of the problem can easily be made.
I usually use two approaches to identify memory problems, often combining:
- I leave the code unchanged and wrap it in the profiler;
- I track the memory usage of the process, removing / adding different parts of the code that may be causing the problem.
Here, as a profiler, I will use memory_profiler ( ruby-prof is also popular), and for monitoring I'll take derailed_benchmarks , which has some great features that are typical of Rails.
Here is a sample code that uses a lot of memory. It is not clear on the fly at what stage it is consumed the most:
# people.rb require_relative "./common" def run(number) Person.delete_all names = number.times.map { random_name } names.each do |name| Person.create(name: name) end records = Person.all.to_a File.open("people.txt", "w") { |out| out << records.to_json } end With get_process_mem, you can quickly find out what is the most memory used to create
Person records. # before_and_after.rb require_relative "./people" print_usage_before_and_after do run(ARGV.shift.to_i) end Result:
$ ruby before_and_after.rb 10000 Before - MEMORY USAGE(MB): 37 After - MEMORY USAGE(MB): 96 There are several places in this code that can take a lot of memory: creating a large array of strings, calling
#to_a to create a large array of Active Record objects (not the best idea, but this is for demonstration) and serializing an array of Active Record objects.Perform code profiling to understand where memory allocations take place:
# profile.rb require "memory_profiler" require_relative "./people" report = MemoryProfiler.report do run(1000) end report.pretty_print(to_file: "profile.txt") Please note that
run here is fed ten times less than in the previous example. The profiler itself consumes a lot of memory, and this can lead to its exhaustion during the profiling of code that has already occupied a large amount.The file is quite long, it includes the allocation and retention of memory and objects in the gem, files, as well as levels of accommodation. The real abundance of information in which there are a couple of interesting parts:
allocated memory by gem ----------------------------------- 17520444 activerecord-4.2.6 7305511 activesupport-4.2.6 2551797 activemodel-4.2.6 2171660 arel-6.0.3 2002249 sqlite3-1.3.11 ... allocated memory by file ----------------------------------- 2840000 /Users/bruz/.rvm/gems/ruby-2.2.4/gems/activesupport-4.2.6/lib/activ e_support/hash_with_indifferent_access.rb 2006169 /Users/bruz/.rvm/gems/ruby-2.2.4/gems/activerecord-4.2.6/lib/active _record/type/time_value.rb 2001914 /Users/bruz/code/mem_test/people.rb 1655493 /Users/bruz/.rvm/gems/ruby-2.2.4/gems/activerecord-4.2.6/lib/active _record/connection_adapters/sqlite3_adapter.rb 1628392 /Users/bruz/.rvm/gems/ruby-2.2.4/gems/activesupport-4.2.6/lib/activ e_support/json/encoding.rb Most distributions occur within Active Record. This seems to indicate either instantiating all the objects in the
records array, or serializing with #to_json . Next, we can test the memory usage without a profiler, removing suspicious places. We cannot disable the extraction of records , so let's start with serialization.# File.open("people.txt", "w") { |out| out << records.to_json }Result:
$ ruby before_and_after.rb 10000 Before: 36 MB After: 47 MB It seems that this is where the most memory is consumed: the ratio between before and after is 81%. You can see what happens if we stop forcing to create a large archive of records.
# records = Person.all.to_a records = Person.all # File.open("people.txt", "w") { |out| out << records.to_json } Result:
$ ruby before_and_after.rb 10000 Before: 36 MB After: 40 MB Memory consumption is also reduced, although an order of magnitude less than when serialization is disabled. Now we know the main culprit, and we can decide on optimization.
Although this is a made-up example, the approaches described here are applicable to real-world problems. The results of profiling may not give a clear result and a specific source of the problem, and besides, they can be interpreted incorrectly. So it is better to additionally check the actual memory usage, including and disabling parts of the code.
Next, we look at some common situations where memory usage becomes a problem, and find out what optimizations can be done.
Deserialization
Memory problems often arise when deserializing large amounts of data from XML, JSON, or other data serialization formats. Methods like
JSON.parse or Hash.from_xml from Active Support are extremely convenient, but if there is a lot of data, a giant structure can be loaded into memory.If you have control over the data source, you can limit the amount of information received by adding filtering or support for loading by parts. But if the source is external or you cannot control it, then you can use the stream deserializer. In the case of XML, you can take Ox , and for JSON you can use yajl-ruby . Apparently, they work about the same.
The fact that you have limited memory does not mean that you cannot parse large XML or JSON documents safely. Stream deserializers allow you to gradually extract what you need, while maintaining low memory consumption.
Here is an example of parsing a 1.7 MB XML file using
Hash#from_xml . # parse_with_from_xml.rb require_relative "./common" print_usage_before_and_after do # From http://www.cs.washington.edu/research/xmldatasets/data/mondial/mondial-3.0.xml file = File.open(File.expand_path("../mondial-3.0.xml", __FILE__)) hash = Hash.from_xml(file)["mondial"]["continent"] puts hash.map { |c| c["name"] }.join(", ") end $ ruby parse_with_from_xml.rb Before - MEMORY USAGE(MB): 37 Europe, Asia, America, Australia/Oceania, Africa After - MEMORY USAGE(MB): 164 111 MB per file 1.7 MB! Absolutely inappropriate ratio. But the version with streaming parser.
# parse_with_ox.rb require_relative "./common" require "ox" class Handler < ::Ox::Sax def initialize(&block) @yield_to = block end def start_element(name) case name when :continent @in_continent = true end end def end_element(name) case name when :continent @yield_to.call(@name) if @name @in_continent = false @name = nil end end def attr(name, value) case name when :name @name = value if @in_continent end end end print_usage_before_and_after do # From http://www.cs.washington.edu/research/xmldatasets/data/mondial/mondial-3.0.xml file = File.open(File.expand_path("../mondial-3.0.xml", __FILE__)) continents = [] handler = Handler.new do |continent| continents << continent end Ox.sax_parse(handler, file) puts continents.join(", ") end $ ruby parse_with_ox.rb Before - MEMORY USAGE(MB): 37 Europe, Asia, America, Australia/Oceania, Africa After - MEMORY USAGE(MB): 37 Memory consumption increases slightly, and now we can handle much larger files. But a compromise could not be avoided: now we have 28 lines of processing code, which was not needed before. This increases the likelihood of errors, so in the production of this part must be further tested.
Serialization
As we saw in the chapter on isolating hot spots in memory consumption, serialization can lead to large losses. Here is the key part of the
people.rb example people.rb . # to_json.rb require_relative "./common" print_usage_before_and_after do File.open("people.txt", "w") { |out| out << Person.all.to_json } end If we run it with a database of 100,000 entries, we get:
$ ruby to_json.rb Before: 36 MB After: 505 MB Here the problem with
#to_json is that it creates an object instance for each record, and then encodes it in JSON. You can significantly reduce memory consumption by generating JSON record by record so that there is only one record object at a time. It seems that none of the popular Ruby JSON libraries can do this, and it is usually recommended to manually create a JSON string. A good API for this is provided by gem json-write-stream , and then our example can be converted: # json_stream.rb require_relative "./common" require "json-write-stream" print_usage_before_and_after do file = File.open("people.txt", "w") JsonWriteStream.from_stream(file) do |writer| writer.write_object do |obj_writer| obj_writer.write_array("people") do |arr_writer| Person.find_each do |people| arr_writer.write_element people.as_json end end end end end Once again, the optimization required to write more code, but the result is worth it:
$ ruby json_stream.rb Before: 36 MB After: 56 MB Be lazy
Starting with Ruby 2.0, there is a great opportunity to do lazy enumerators (lazy enumerator). This makes it possible to greatly reduce memory consumption when invoking an enumerator's chain of methods. Let's start with the non-lazy code:
# not_lazy.rb require_relative "./common" number = ARGV.shift.to_i print_usage_before_and_after do names = number.times .map { random_name } .map { |name| name.capitalize } .map { |name| "#{ name } Jr." } .select { |name| name[0] == "X" } .to_a end Result:
$ ruby not_lazy.rb 1_000_000 Before: 36 MB After: 546 MB 
At each stage of the chain, iteration is performed on all elements and a new array is created that has the following method in the chain, and so on. Let's see what happens when we do it in a lazy way, simply adding the
lazy call to the resulting enumerator: # lazy.rb require_relative "./common" number = ARGV.shift.to_i print_usage_before_and_after do names = number.times.lazy .map { random_name } .map { |name| name.capitalize } .map { |name| "#{ name } Jr." } .select { |name| name[0] == "X" } .to_a end Result:
$ ruby lazy.rb 1_000_000 Before: 36 MB After: 52 MB Finally an example, giving us a huge gain in memory consumption without adding a lot of code! Please note that if we don’t need to accumulate the results at the end, for example, if each item has been saved to the database and can be forgotten, then memory will be spent even less. To get the enumerator result, just add the final
force call at the end of the chain.It should also be noted that the first is called
times , and then lazy , because the first consumes very little memory, just returning the enumerator, which generates an integer at each call. So if you can use an enumerator instead of an array at the beginning of the chain, this is also a plus, reducing memory consumption.It is convenient to keep everything in huge arrays and collections (map), but in real situations it is allowed only in rare cases.
You can create an enumerable for lazy data processing, for example, when working with data divided into pages. Instead of requesting all the pages and putting them into one large array, you can output them through an enumerator, which remarkably hides all the pagination details. For example:
def records Enumerator.new do |yielder| has_more = true page = 1 while has_more response = fetch(page) response.records.each { |record| yielder record } page += 1 has_more = response.has_more end end end Conclusion
We described Ruby's memory usage, looked at a few basic tools for tracking memory problems, and looked at common situations and optimization methods. The considered situations do not claim to be comprehensive and illustrate the most diverse problems that I personally encountered. However, the main result of the article is an attempt to think about how the code affects memory consumption.
Source: https://habr.com/ru/post/305426/
All Articles