Announcement of the public beta version of NGINX Amplify
We are pleased to introduce the beta of NGINX Amplify, our new monitoring tool for NGINX and NGINX Plus . Using NGINX Amplify, you can monitor and control NGINX and the applications it serves. The new tool will allow you to quickly solve problems with the performance and availability of individual services and infrastructure in general. Currently it includes a highly customizable dashboard with an alert mechanism, as well as a system of automatic recommendations for optimizing performance and improving security.
You can learn more and see NGINX Amplify in action by registering for an online webinar , which will be held on July 13 at 20:00 Moscow time.
')
Also, you can start using NGINX Amplify for free right now after registering .

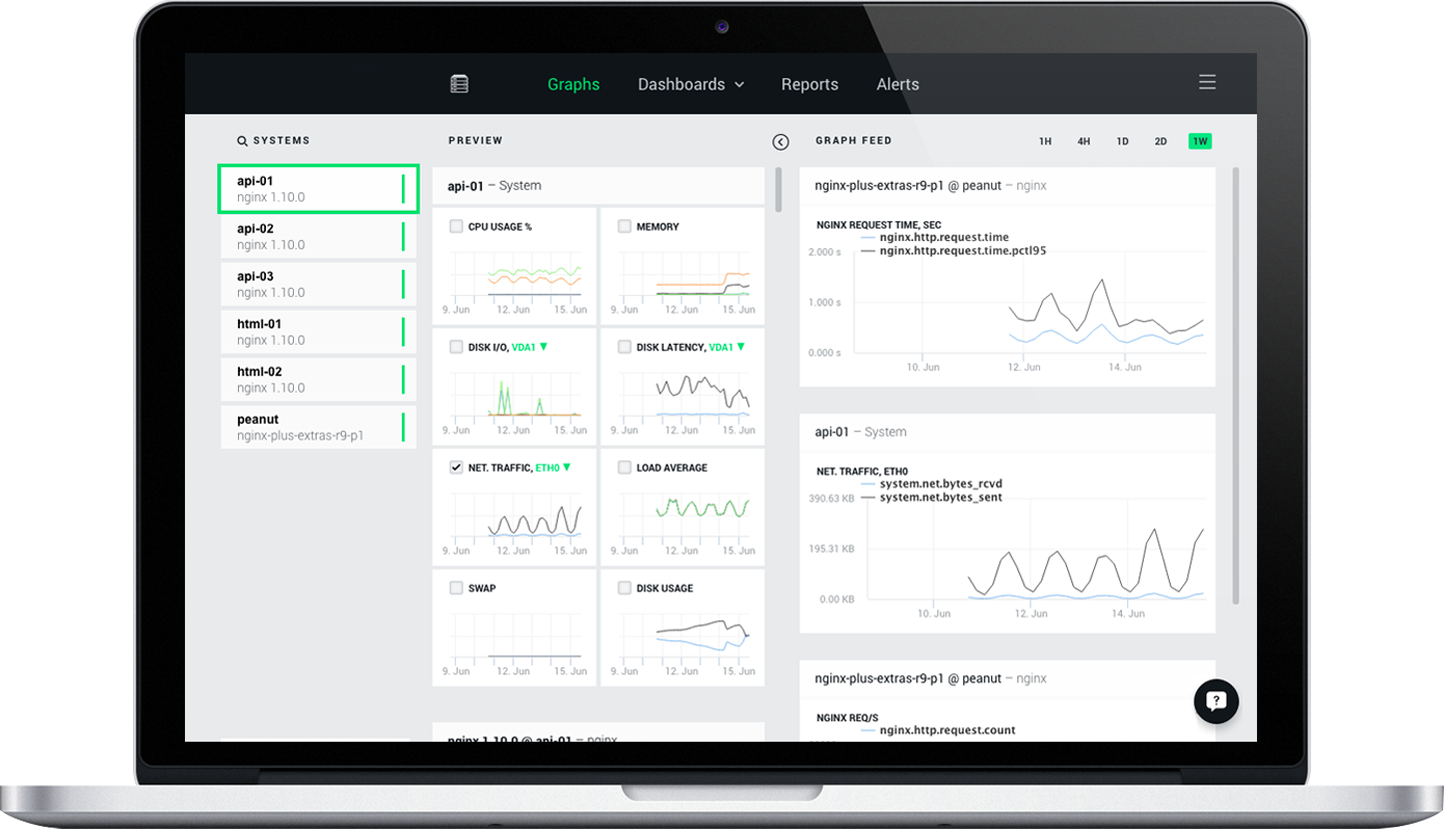
Easy access to key performance indicators in the custom NGINX Amplify dashboard
Installation is simple and will not take more than 5 minutes. With NGINX Amplify you will get:
- Safety and Optimization Guidelines - NGINX Amplify thoroughly analyzes your NGINX configuration and advises changes to improve performance and security. Each recommendation contains the line number of the cited directive, a description of the problem and how to fix it.
- Real-Time Monitoring - NGINX Amplify is the unified dashboard of all your NGINX servers. It collects hundreds of different metrics from NGINX, log files and the operating system, providing a flexible customizable interface for displaying them (in the picture above). Metrics can be aggregated from a whole cluster of NGINX servers for an overall assessment or filtered down to a unique interface. Monitoring works with both the free version of NGINX and the commercial one, NGINX Plus, where additional metrics are available to users.
- Customizable alerts - NGINX Amplify sends a message when the system needs attention. Any metric collected in NGINX Amplify may be a criterion for sending alerts. For example, a message can be generated when the number of errors with 5xx codes exceeds the limit you set.
Considering our unique position as a web server, proxy and balancer for web services, we believe that NGINX Amplify is an excellent addition to the existing tools for monitoring accessibility and performance. NGINX Amplify works using a small open source agent that is installed on each server with NGINX. The agent independently collects various metrics for analysis and visualization. This data is combined with the information that is collected by NGINX (or NGINX Plus ) in order to present a complete picture of how your web service functions.
We invite all NGINX and NGINX Plus users to register and benefit from the ability to analyze and better control their web services. By joining the NGINX Amplify open beta, in a few minutes you will receive visualization of key indicators and actionable tips to improve the performance and security of your services.
Closed beta test results
NGINX Amplify has been available for private testing since last November. NGINX enthusiasts and those who had the greatest need for this kind of monitoring were the first to join beta testing. And with the transition to the phase of public beta, we are counting on the rapid growth of the user base.
Here is what the first users say about NGINX Amplify:
“... [in one case] our connection to the network suffered and the servers were cut off from the Internet for a short time. Our own monitoring did not notice the problem, and if NGINX Amplify had not detected or notified us, we would not even know about this fact. ”
“The Reports page is useful for its quick overview of server settings, and static analysis helped us identify missing configuration parameters.”
“NGINX Amplify helped me quickly solve problems thanks to the Static analysis section on the Reports page.”
Learn more about the features of NGINX Amplify.
Performance and safety recommendations
NGINX Amplify performs static analysis of your NGINX configuration. The Reports page contains recommendations for what can be changed to improve performance and security. Each tip contains the name of the configuration file and the line number where the directive is located, explains the potential problem and suggests a solution.

NGINX Amplify analyzes your NGINX configuration and gives suggestions for improvement.
The first example in the snapshot provides advice on how to improve the configuration in order to avoid non-obvious behavior in cases where the request contains an unknown host name or does not contain it at all.
NGINX Amplify also detects settings that can adversely affect performance. For example, a complete shutdown of buffering responses from proxied servers can degrade performance, while disabling buffering to disk, on the contrary, can improve performance. Users often confuse these two settings and turn off full buffering for no apparent reason. NGINX Amplify finds such settings and explains what they are intended for.
NGINX Amplify further identifies potential security issues in the NGINX configuration and provides recommendations for resolving them. For example, NGINX Amplify may prompt you to restrict access to the status page.
Real time monitoring
With NGINX Amplify, you can display all necessary metrics on a single panel on the Dashboards tab (dashboard). Among the indicators available to you:
- Individual metrics - for example, the amount of CPU time used by each server;
- Aggregated metrics - such as total bandwidth across all servers with NGINX;
- Metrics related to application performance, including response time.
NGINX Amplify saves NGINX monitoring data for a week, so you can do a retrospective analysis.

In NGINX Amplify you can create your own dashboard with the necessary indicators
NGINX Plus collects additional metrics related to backend performance. NGINX Plus users benefit from the visualization of these metrics in NGINX Amplify and the ability to view them over previous periods of time:
- Load on each backend, including requests, responses and bandwidth;
- The performance of each backend, including the number of errors and how often the server experienced problems;
- Hours, traffic and other critical information.
Alerts
You can set up alerts on the Alerts page, so NGINX Amplify will alert you when the system is out of order. NGINX Amplify collects a wide range of metrics from the system, which can be used as criteria for generating alerts.

Receive messages when the system has problems
One of the alerts in the snapshot is configured so that NGINX Amplify will send an email to
me@example.com when the processor is busy for more than 95% for 10 minutes or more, which can be a signal that the server is overloaded. You can specify any mailing address, for example, redirect the message to the PagerDuty service. After the initial notification, NGINX Amplify will send a digest every 30 minutes for all detected errors until all problems have been fixed.Summary
NGINX is one of the most critical components in the service infrastructure of your services. NGINX Amplify helps you to track down that NGINX and your applications are functioning properly, including at peak load. We invite everyone to register today for a free open beta test and leave your feedback using the Intercom button in the lower right corner after entering NGINX Amplify.
Source: https://habr.com/ru/post/305384/
All Articles