Guilloche
Guilloches are characteristic patterns on money and securities. They are beautiful, and at the same time they combine noticeable complexity with internal simplicity - when it seems that you are about to catch the principle, but it eludes you every time. Perhaps this is the definition of beauty.
Since guilloches were used as a means of protecting securities from counterfeiting, everything related to their use was classified and information had to be collected bit by bit.
The name itself comes from the surname of the French engineer Guylot (Guillot), about which there is no information left. It is possible that this is generally a purely mythical figure.
Guilloches were originally used to engrave wavy lines on watch cases, Faberge eggs, and similar items that require strict geometric decorations. They were performed by some kind of lathe, in which the cutter was not rigidly fixed, but described the figures around the rotating workpiece.
')
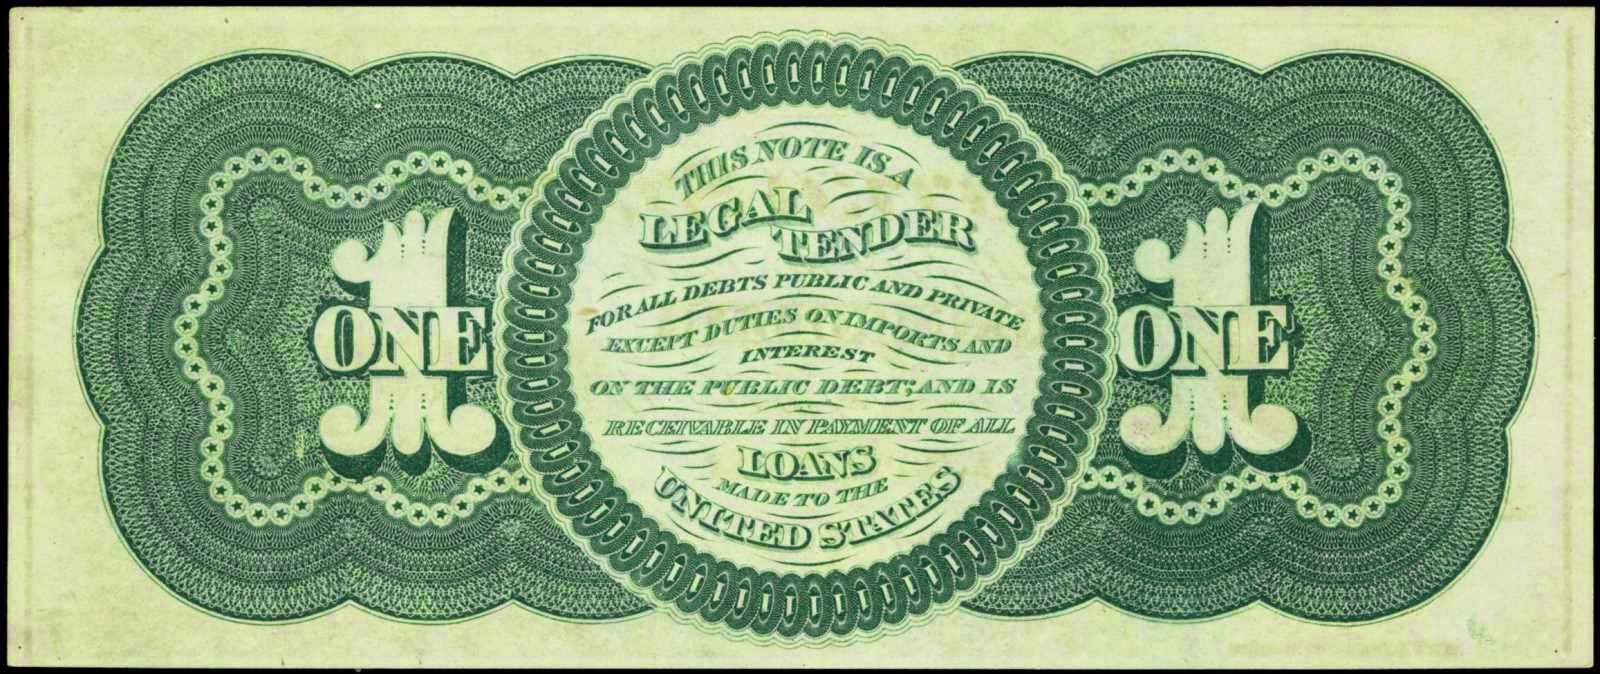
Around the middle of the 19th century, someone had the idea to adapt such a machine to generate complex patterns on a typographic plate. Most likely, it was the Americans, because on their money the guilloches appeared first of all - at the issue of 1862, and very quickly became one of the main design elements.
Gradually, they were borrowed by almost all developed countries - except for France, which adhered to the exceptionally pictorial manner of drawing banknotes, without being distracted by mechanical things.
The guilloches were first printed on Russian money in the 1892 edition.

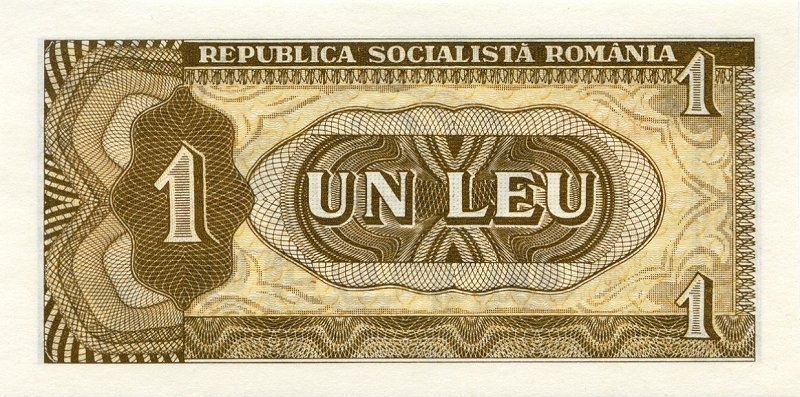
If we look at the patterns on the money of different countries, we can see that, despite the general principle, they are quite different. From this we can conclude that each developed the corresponding machines independently. The correlation is also noticeable - the more developed a country is, the better its guilloches are. For an example, just look at the Romanian money from the times of Ceausescu, where parts from a tractor seem to be used for the guilloche machine.
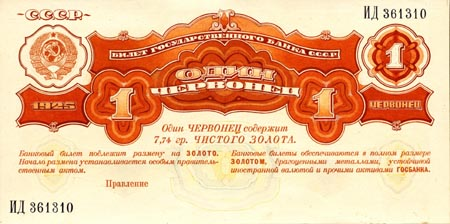
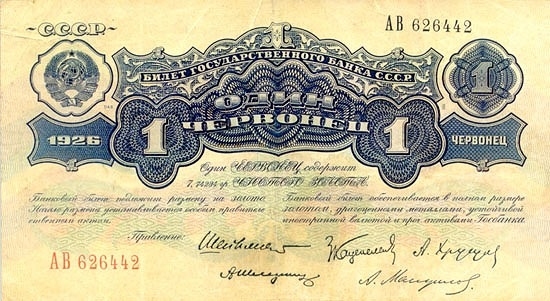
Creating a guilloche was a tricky business — so complex that it was done by individuals who had the special profession of the guillocher. According to some information, it can be understood that the guillochers drew guilloches according to the artist’s sketch - this can be seen from the example given of the outline and the finished banknote of 1 chervonets of 1926. I would not be surprised if they did this by mechanically fitting the parts, or even sorting out the car all over again.
Now the guilloches are out of fashion, because they can only resist drawing money with their hands - try to draw all these small curves with ink. When using optical copying, they are useless - the scanner is just the same as reading: patterns or portraits. So, modern guilloche banknotes usually no longer exist or they modestly stick out somewhere in the corner as a tribute to tradition.
Calculate the algorithm for drawing guilloches is extremely difficult - although in appearance they seem quite simple. Many sources write that this is just a complicated version of a spirograph with several wheels, but I doubt it very much. It is easy to repeat a multi-wheel spirograph on a computer, but the resulting patterns firstly do not resemble guilloches at all, and secondly they cannot be fitted to predetermined contours.
It is clear that the guilloche is a family of sinusoids that are shifted in phase relative to each other and distorted depending on the external contours so as not to cross their boundaries. This is obvious - but it is not at all obvious exactly how mathematically the contours affect sinusoids.
In fact, the principle of constructing patterns is quite simple, but somewhat strange. They are counted by points, and simple algebraic operations on three curves (an internal, external contour and a sinusoid, creeping between them) are not enough - one has to solve equations to determine the intersection of a line and a curve.
Actually, at each point we set the point of a sine wave, but each time it is different - as if modulated by the current state of the limiting circuits.
How exactly the necessary calculations were performed on machine tools, beyond my understanding.
So, the principle of drawing. We start with the horizontal guilloche, because it is simpler. Attention to the screen.

The contours bounding our guilloche are highlighted in green. We consider them to be lower and upper and calculate the value of the guilloche point in the abscissa t.
First of all, we find points PB and PT - points of contours at t. At the same time we calculate in this place the vectors of the direction of the curves.
Now find a midpoint between the lower and upper contour. The drawing of our beautiful curve will be counted from it. We can just take a point, the average between PB and PT, and we can still multiply it by a certain coefficient 0..1, which shows in what proportion the lower and upper contours should be taken into account. Then we can slightly shift the guilloche up and down between the contours in order to achieve more beautiful shapes.
Calculate at this point the direction vector as the average between the vectors at points PB and PT. We find a perpendicular for it.
Let us calculate the value of the most ordinary sine wave at the point t (assuming that it starts at the point 0.0 and moves along the ordinate axis to the right).
Now distort this sinusoid as follows: move the current value of its argument (t, 0) to the Mid point, its X axis will make the "average vector", and the Y axis, respectively, perpendicular to it. Then its current point will be at RP.
It remains only to modulate the amplitude of this sinusoid. Calculate the distance Mid - IP, that is, the distance from the midpoint to the first point of intersection of the perpendicular with the contour. Which contour to take, upper or lower, we will determine by the value of the initial sinusoid - it is located above or below the ordinate axis. The figure shows the case when the value of the reference sine wave is greater than zero and we use the upper contour.
Now scale the Mid-RP, considering the Mid-IP distance as a unit, and set this value aside along the new ordinate axis, i.e. on the perpendicular. We get a GP point - it will be the desired point of the guilloche.
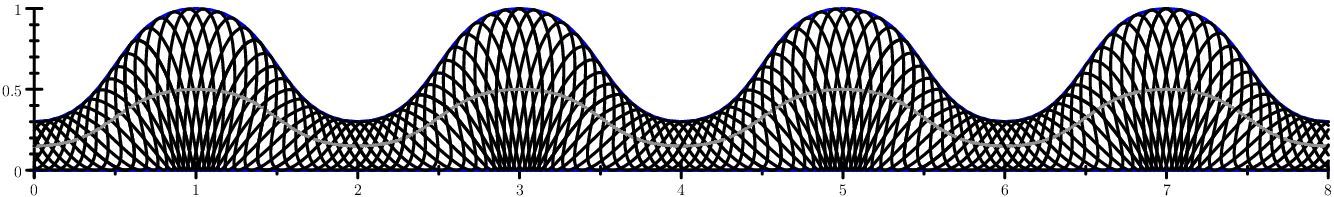
Let's move on to programming. Here is the Asymptote horizontal guilloche drawing program:
But the result of her work. Gracefully.
With circular guilloche - just those that usually appear on the money - it becomes more complicated. The principle remains the same, but ...
1. Instead of Cartesian coordinates you have to work in polar
2. The curves become capricious and start behaving badly. With more or less complex contours at some points, a situation arises when the perpendicular does not intersect with the desired contour at all. Obviously, in such cases, and requires many years of experience guillotine.
So, the program. Note that in it the contours, by analogy with the previous program, are called upper and lower, although in reality they are external and internal.
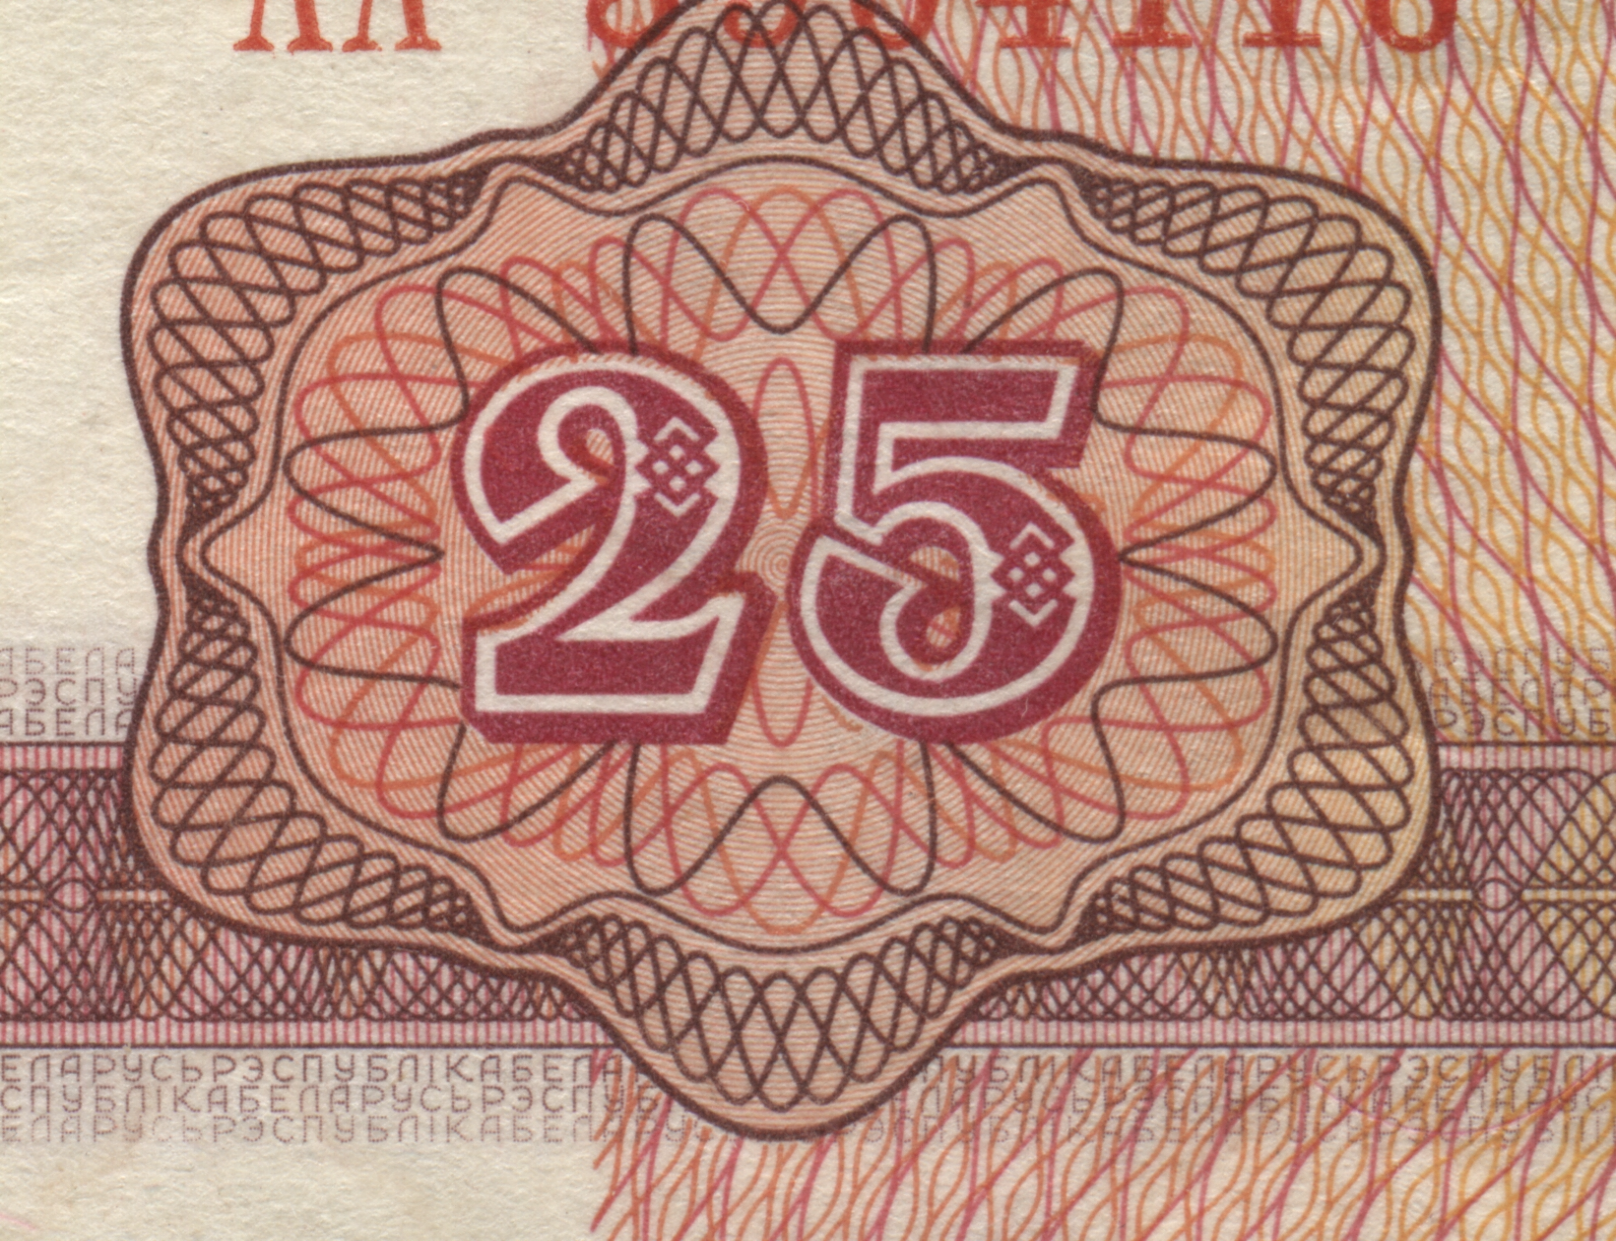
The result is something like an outlet with a coupon of 25 Belarusian rubles in 1992. You can make more similar, if you carefully draw the middle line (see the second picture).


Some lines in our figure turned out with notches - this is due to the lack of accuracy of calculations. To some extent, they can be fixed by putting in the draw statement a calculation of not 10,000, but 10,000 points.
What else can come up with guilloche?
Firstly, if you look closely at the Belarusian version, it is noticeable that the local patterns still change their frequency - they become thicker and less frequent. How to take into account the frequency in my program - I never thought of it.
Secondly, guilloches openly suggest to be saved as Bezier curves — they are very well approximated. But for this you need to understand how they behave - where they have vertices, where the inflection points are. It is somehow silly to calculate this from a set of points, but how to approach a question mathematically, for example, considering the derivative, is not clear.
If a highly respected public has any thoughts on this, please share.
PS The images in the article are scaled so as not to spoil the overall look of the page. You can open them separately and view with better resolution.
Since guilloches were used as a means of protecting securities from counterfeiting, everything related to their use was classified and information had to be collected bit by bit.
The name itself comes from the surname of the French engineer Guylot (Guillot), about which there is no information left. It is possible that this is generally a purely mythical figure.
Guilloches were originally used to engrave wavy lines on watch cases, Faberge eggs, and similar items that require strict geometric decorations. They were performed by some kind of lathe, in which the cutter was not rigidly fixed, but described the figures around the rotating workpiece.
')
Around the middle of the 19th century, someone had the idea to adapt such a machine to generate complex patterns on a typographic plate. Most likely, it was the Americans, because on their money the guilloches appeared first of all - at the issue of 1862, and very quickly became one of the main design elements.
Gradually, they were borrowed by almost all developed countries - except for France, which adhered to the exceptionally pictorial manner of drawing banknotes, without being distracted by mechanical things.
The guilloches were first printed on Russian money in the 1892 edition.
If we look at the patterns on the money of different countries, we can see that, despite the general principle, they are quite different. From this we can conclude that each developed the corresponding machines independently. The correlation is also noticeable - the more developed a country is, the better its guilloches are. For an example, just look at the Romanian money from the times of Ceausescu, where parts from a tractor seem to be used for the guilloche machine.
Creating a guilloche was a tricky business — so complex that it was done by individuals who had the special profession of the guillocher. According to some information, it can be understood that the guillochers drew guilloches according to the artist’s sketch - this can be seen from the example given of the outline and the finished banknote of 1 chervonets of 1926. I would not be surprised if they did this by mechanically fitting the parts, or even sorting out the car all over again.
Now the guilloches are out of fashion, because they can only resist drawing money with their hands - try to draw all these small curves with ink. When using optical copying, they are useless - the scanner is just the same as reading: patterns or portraits. So, modern guilloche banknotes usually no longer exist or they modestly stick out somewhere in the corner as a tribute to tradition.
Calculate the algorithm for drawing guilloches is extremely difficult - although in appearance they seem quite simple. Many sources write that this is just a complicated version of a spirograph with several wheels, but I doubt it very much. It is easy to repeat a multi-wheel spirograph on a computer, but the resulting patterns firstly do not resemble guilloches at all, and secondly they cannot be fitted to predetermined contours.
It is clear that the guilloche is a family of sinusoids that are shifted in phase relative to each other and distorted depending on the external contours so as not to cross their boundaries. This is obvious - but it is not at all obvious exactly how mathematically the contours affect sinusoids.
In fact, the principle of constructing patterns is quite simple, but somewhat strange. They are counted by points, and simple algebraic operations on three curves (an internal, external contour and a sinusoid, creeping between them) are not enough - one has to solve equations to determine the intersection of a line and a curve.
Actually, at each point we set the point of a sine wave, but each time it is different - as if modulated by the current state of the limiting circuits.
How exactly the necessary calculations were performed on machine tools, beyond my understanding.
So, the principle of drawing. We start with the horizontal guilloche, because it is simpler. Attention to the screen.
The contours bounding our guilloche are highlighted in green. We consider them to be lower and upper and calculate the value of the guilloche point in the abscissa t.
First of all, we find points PB and PT - points of contours at t. At the same time we calculate in this place the vectors of the direction of the curves.
Now find a midpoint between the lower and upper contour. The drawing of our beautiful curve will be counted from it. We can just take a point, the average between PB and PT, and we can still multiply it by a certain coefficient 0..1, which shows in what proportion the lower and upper contours should be taken into account. Then we can slightly shift the guilloche up and down between the contours in order to achieve more beautiful shapes.
Calculate at this point the direction vector as the average between the vectors at points PB and PT. We find a perpendicular for it.
Let us calculate the value of the most ordinary sine wave at the point t (assuming that it starts at the point 0.0 and moves along the ordinate axis to the right).
Now distort this sinusoid as follows: move the current value of its argument (t, 0) to the Mid point, its X axis will make the "average vector", and the Y axis, respectively, perpendicular to it. Then its current point will be at RP.
It remains only to modulate the amplitude of this sinusoid. Calculate the distance Mid - IP, that is, the distance from the midpoint to the first point of intersection of the perpendicular with the contour. Which contour to take, upper or lower, we will determine by the value of the initial sinusoid - it is located above or below the ordinate axis. The figure shows the case when the value of the reference sine wave is greater than zero and we use the upper contour.
Now scale the Mid-RP, considering the Mid-IP distance as a unit, and set this value aside along the new ordinate axis, i.e. on the perpendicular. We get a GP point - it will be the desired point of the guilloche.
Let's move on to programming. Here is the Asymptote horizontal guilloche drawing program:
import graph; import wave; size(1000,1000); xaxis(ticks=Ticks); yaxis(ticks=Ticks); defaultpen(2); var zero = (0,0); typedef pair pairf(real x); /////////////////////////////////////////// // , (0,0)--v pair orthogonal(pair v) { return unit((-vy,vx)); } // x,path(x) pair[] pt_and_dir(path p, real x) { var t = times(p,x)[0]; return new pair[]{point(p,t), dir(p,t)}; } // , t pairf between(path top, path bottom, real topk=0.5, real phase, real omega) { return new pair(real t) { // var pdt = pt_and_dir(top,t); var pdb = pt_and_dir(bottom,t); // "" var mid = topk*pdt[0] + (1-topk)*pdb[0]; // draw(mid,gray); // , var ort = orthogonal(topk*pdt[1] + (1-topk)*pdb[1]); // , var f = sin(phase+omega*t); // , var rp = rotate(degrees(atan2(ort.y,ort.x)-pi/2),zero) * (0,f); // // var ipath = rp.y >= 0 ? top : bottom; var inter = intersections(ipath,mid,mid+ort); var interp = sequence(new pair(int i) {return point(ipath,inter[i]); }, inter.length); interp = sort(interp, new bool(pair a, pair b) {return abs(mid.xa.x) < abs(mid.xb.x); }); var ip = interp[0]; // " " var r = sqrt((mid.x-ip.x)*(mid.x-ip.x)+(mid.y-ip.y)*(mid.y-ip.y)); // return mid+r*rp; }; } // void repeat(int n, path top, path bottom, real topk, real freq) { var step = 2pi/n; for (var i: sequence(0,n)) { draw(graph(between(top,bottom, topk, i*step, freq), 0,8, 500)); } } // - - path top = shift(0,0.3)*(4*make_wave(1.4, (+1,+0.7),(+1,-0.7) )); // - path bottom = (0,0)--(8,0); draw(top, blue); draw(bottom, blue); // 9 "" 11, repeat(9, top, bottom, 0.5, 11); But the result of her work. Gracefully.
With circular guilloche - just those that usually appear on the money - it becomes more complicated. The principle remains the same, but ...
1. Instead of Cartesian coordinates you have to work in polar
2. The curves become capricious and start behaving badly. With more or less complex contours at some points, a situation arises when the perpendicular does not intersect with the desired contour at all. Obviously, in such cases, and requires many years of experience guillotine.
So, the program. Note that in it the contours, by analogy with the previous program, are called upper and lower, although in reality they are external and internal.
import graph; import wave; size(1000,1000); xaxis(ticks=Ticks); yaxis(ticks=Ticks); defaultpen(5); var zero = (0,0); typedef pair pairf(real x); typedef pair[] pairaf(real t); /////////////////////////////////////////// // pair orthogonal(pair v) { return unit((-vy,vx)); } // pair cart(real a, real r) { return (r*cos(a), r*sin(a)); } // - real atan2p(pair v) { var a = atan2(vy,vx); return a<0 ? a+2pi : a; } // real distance(pair a, pair b) { return sqrt((ax-bx)*(ax-bx)+(ay-by)*(ay-by)); } // p a pair[] pt_and_dir(path p, real a) { var ii = intersections(p,zero--cart(a,100)); if (ii.length==0) { write(p); write(a); } var t = ii[0]; return new pair[]{point(p,t[0]), dir(p,t[0])}; } // , midpoint, pairf between(path top, path bottom, pairaf midpoint, real phase, real omega) { return new pair(real t) { var b = midpoint(t); var mid = b[0]; draw(mid,green); var mid_dir = b[1]; var f = sin(phase+omega*t); var angle = (degrees(atan2p(mid_dir))+180) % 360; var rp = rotate(angle,zero) * (0,f); // - ? var ipath = distance(mid+rp,zero) > distance(mid,zero) ? top : bottom; // var inter = intersections(ipath,mid,mid+rp); // - . . , // if (inter.length==0) { draw(mid--mid+rp,magenta,Arrow); return mid; } // var interp = sequence(new pair(int i) {return point(ipath,inter[i]); }, inter.length); interp = sort(interp, new bool(pair a, pair b) {return distance(mid,a) < distance(mid,b); }); var ip = interp[0]; var r = distance(mid,ip); return mid + r*rp; }; } // , pairf between(path top, path bottom, path base, real phase, real omega) { pairaf mf = new pair[](real t) { return pt_and_dir(base, t); }; return between(top, bottom, mf, phase, omega); } // , pairf between(path top, path bottom, real topk=0.5, real phase, real omega) { pairaf midpoint = new pair[](real t) { var pdt = pt_and_dir(top,t); var pdb = pt_and_dir(bottom,t); var mid = topk*pdt[0] + (1-topk)*pdb[0]; var mid_dir = topk*pdt[1] + (1-topk)*pdb[1]; return new pair[]{mid, mid_dir}; }; return between(top, bottom, midpoint, phase, omega); } // ( ) void repeat(int n, path top, path bottom, real topk, real freq) { var step = 2pi/n; for (var i: sequence(0,n-1)) { draw(graph(between(top,bottom, topk, i*step, freq), 0, 2pi, 500)); } } // - , void repeat(int n, path top, path bottom, path base, real freq) { var step = 2pi/n; for (var i: sequence(0,n-1)) { draw(graph(between(top,bottom,base, i*step, freq), 0, 2pi, 500)); } } // - . , , // SVG path top = (458.43,237.715)..controls (468.922,264.461) and (481.563,290.133)..(466.797,322.145) ..controls (438.688,358.184) and (392.762,345.094)..(362.438,351.945) ..controls (354.488,353.742) and (350.508,354.398)..(342.07,358.234) ..controls (338.023,360.074) and (333.797,358.609)..(329.125,358.598) ..controls (324.457,358.582) and (319.348,360.02)..(315.824,363.094) ..controls (306.16,371.52) and (294.707,387.746)..(278.176,400.949) ..controls (261.645,414.152) and (250.875,417.965)..(236.914,417.996) ..controls (222.957,418.023) and (213.074,414.152)..(196.543,400.949) ..controls (180.012,387.746) and (168.559,371.52)..(158.895,363.094) ..controls (155.371,360.02) and (150.262,358.582)..(145.594,358.598) ..controls (140.922,358.609) and (136.695,360.074)..(132.648,358.234) ..controls (124.211,354.398) and (120.23,353.742)..(112.281,351.945) ..controls (81.957,345.094) and (36.0313,358.184)..(7.92188,322.145) ..controls (-6.84375,290.133) and (5.79688,264.461)..(16.2891,237.715) ..controls (19.1992,230.289) and (11.7227,218.836)..(11.7227,209.773) ..controls (11.7227,200.711) and (19.1992,188.906)..(16.2891,181.48) ..controls (5.79688,154.734) and (-6.84375,129.063)..(7.92188,97.0508) ..controls (36.0313,61.0078) and (81.957,74.0977)..(112.281,67.2461) ..controls (120.23,65.4531) and (124.211,64.7969)..(132.648,60.9609) ..controls (136.695,59.1211) and (140.922,60.582)..(145.594,60.5977) ..controls (150.262,60.6094) and (155.371,59.1719)..(158.895,56.1016) ..controls (168.559,47.6719) and (180.012,31.4492)..(196.543,18.2461) ..controls (213.074,5.03906) and (222.957,1.16797)..(236.914,1.19922) ..controls (250.875,1.22656) and (261.645,5.03906)..(278.176,18.2461) ..controls (294.707,31.4492) and (306.16,47.6719)..(315.824,56.1016) ..controls (319.348,59.1719) and (324.457,60.6094)..(329.125,60.5977) ..controls (333.797,60.582) and (338.023,59.1211)..(342.07,60.9609) ..controls (350.508,64.7969) and (354.488,65.4531)..(362.438,67.2461) ..controls (392.762,74.0977) and (438.688,61.0078)..(466.797,97.0508) ..controls (481.563,129.063) and (468.922,154.734)..(458.43,181.48) ..controls (455.52,188.906) and (462.996,200.238)..(463.055,209.359) ..controls (463.113,218.48) and (455.52,230.289)..(458.43,237.715) --cycle; path bottom = (435.121,232.246)..controls (424.465,250.848) and (436.73,269.879)..(418,294.242) ..controls (399.266,318.602) and (368.48,321.363)..(355.004,331.102) ..controls (341.531,340.84) and (349.316,349.461)..(338.301,353.699) ..controls (327.289,357.934) and (311.055,338.211)..(297.848,342.762) ..controls (277.797,349.668) and (257.313,362.477)..(235.926,362.551) ..controls (214.543,362.629) and (196.012,350.156)..(175.961,343.25) ..controls (162.75,338.699) and (146.52,358.422)..(135.504,354.188) ..controls (124.492,349.949) and (132.277,341.328)..(118.805,331.59) ..controls (105.328,321.852) and (74.5391,319.09)..(55.8086,294.73) ..controls (37.0742,270.367) and (49.3438,251.336)..(38.6875,232.734) ..controls (33.918,224.414) and (17.0078,213.824)..(17.0078,209.363) ..controls (17.0078,204.902) and (33.9258,194.051)..(38.6953,185.727) ..controls (49.3555,167.129) and (37.082,148.094)..(55.8242,123.734) ..controls (74.5625,99.375) and (105.359,96.6094)..(118.84,86.875) ..controls (132.32,77.1367) and (124.531,68.5117)..(135.547,64.2773) ..controls (146.566,60.043) and (162.805,79.7617)..(176.016,75.2148) ..controls (196.078,68.3086) and (214.613,55.832)..(236.008,55.9102) ..controls (257.398,55.9883) and (277.891,68.7969)..(297.953,75.7031) ..controls (311.164,80.2539) and (327.402,60.5313)..(338.418,64.7656) ..controls (349.438,69.0039) and (341.648,77.625)..(355.129,87.3633) ..controls (368.609,97.0977) and (399.406,99.8633)..(418.145,124.223) ..controls (436.887,148.586) and (424.613,167.617)..(435.273,186.219) ..controls (440.043,194.539) and (456.961,205.215)..(456.926,209.535) ..controls (456.887,213.859) and (439.891,223.926)..(435.121,232.246) --cycle; // top = scale(1/10)*top; bottom = scale(1/10)*bottom; // var min = min(top); var max = max(top); top=shift(-(max.x-min.x)/2, -(max.y-min.y)/2)*top; min = min(bottom); max = max(bottom); bottom=shift(-(max.x-min.x)/2-min.x, -(max.y-min.y)/2-min.y)*bottom; draw(top, blue); draw(bottom, blue); // 4 repeat(4, top, bottom, 0.5, 18); The result is something like an outlet with a coupon of 25 Belarusian rubles in 1992. You can make more similar, if you carefully draw the middle line (see the second picture).
Some lines in our figure turned out with notches - this is due to the lack of accuracy of calculations. To some extent, they can be fixed by putting in the draw statement a calculation of not 10,000, but 10,000 points.
What else can come up with guilloche?
Firstly, if you look closely at the Belarusian version, it is noticeable that the local patterns still change their frequency - they become thicker and less frequent. How to take into account the frequency in my program - I never thought of it.
Secondly, guilloches openly suggest to be saved as Bezier curves — they are very well approximated. But for this you need to understand how they behave - where they have vertices, where the inflection points are. It is somehow silly to calculate this from a set of points, but how to approach a question mathematically, for example, considering the derivative, is not clear.
If a highly respected public has any thoughts on this, please share.
PS The images in the article are scaled so as not to spoil the overall look of the page. You can open them separately and view with better resolution.
Source: https://habr.com/ru/post/305354/
All Articles