Fear of high rates, or how to optimize the budget

When I first started working with Yandex.Market, I had one problem: I was afraid to use high stakes. I am sure that many of you know this.
There were several reasons:
')
• The desire of customers to be within the agreed budget.
• Fear that the entire budget will “twist” in one day.
As a result, an understanding emerged that this work needs to be systematized so that it is as clear as possible. About how I decided for myself this problem, and will be discussed today. Let's talk not only about the Market, but also about other sites. Let's get started
The essence of the problem:
When you and a client agree on a budget of 100,000 rubles, consider it as follows:
Budget: 100,000 rubles
Period: 30 days
Daily budget: 3 333 rubles
However, after the launch of the client’s RC, we begin to observe the following picture from the daily budget
1 day - 1 200 rubles.
2 day - 2 400 rub.
3 day - 1 900 rub.
4 day - 2 300 rub.
5 day - 2 900 rubles.
What is it fraught with?
• Budget is used inefficiently.
• Monthly targets will be stretched for a longer period (as well as the budget), while there is a possibility that they will not be achieved even after it ends.
In what cases can such a situation arise?
• New Product;
• limited demand;
• the presence of overlapping requests from other topics that need to be avoided.
If the client is hosted on Yandex.Market:
• customer goods have no cards;
• Minimum rates for all product cards are used.
What tools did I use?
• OWOX - to integrate data from other sites (a free account is enough);
• Google Analytics - for data aggregation;
• Google SpreadSheets (Tables) - for visualization;
• Google Analytics add-on for Google Spreadsheets.
The process itself:
I propose to consider all the settings on one of the last clients that we set up.
First of all, it is necessary to integrate the data with which we will work.
To do this, go to Google Analytics, select the “Administrator” section and in the “Resource” section - “Import Data”:
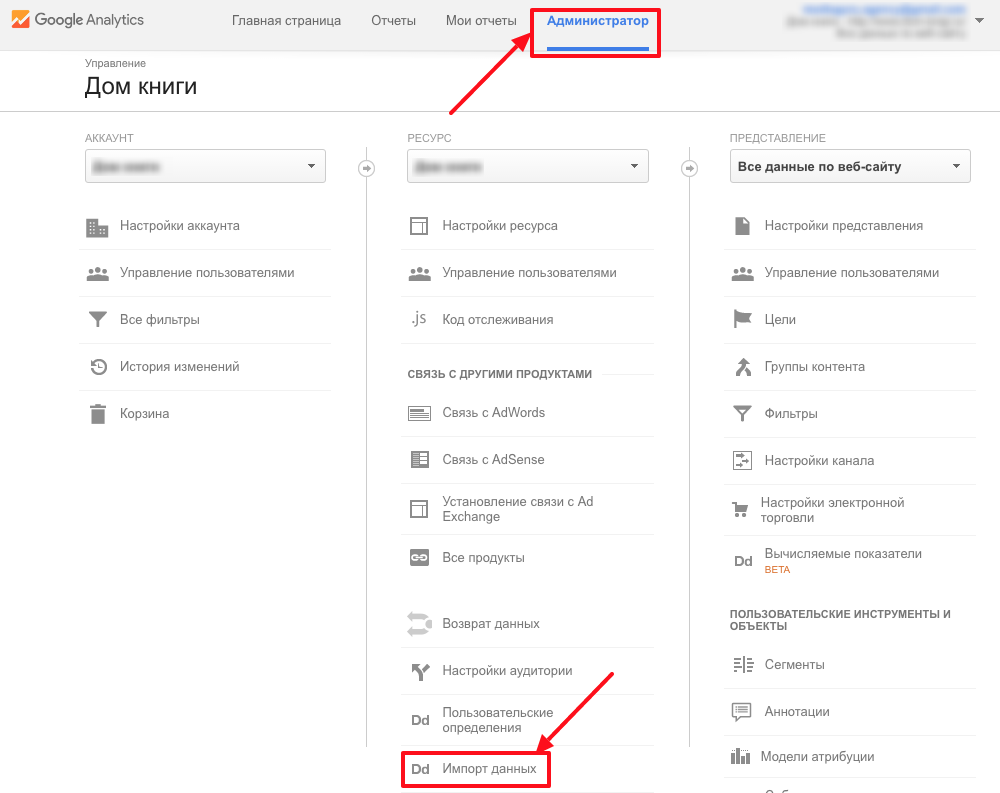
In the window that opens, click the "Create a data set" button:

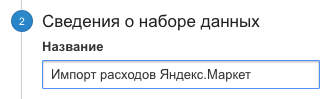
At the bottom, select the item “Cost data”.

In the next paragraph, enter the desired name:
You also need to select the views in which this data will be displayed:

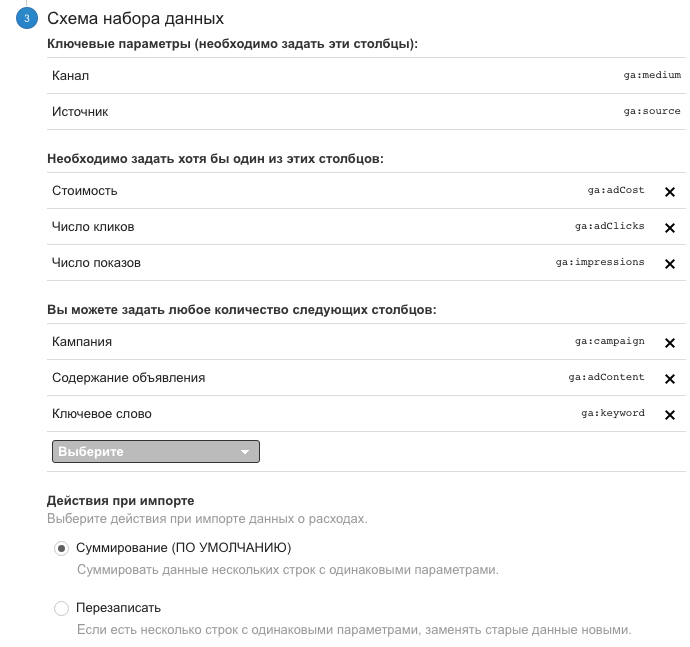
In the last (third) step, select the following data set scheme:
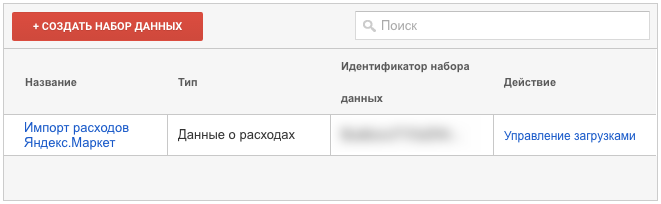
Click “Save” so that our entry appears in the list of sets:
With Google Analytics, that's it.
Now that we have where to import the data, we go into OWOX and in the interface, click the "Create a stream" button:

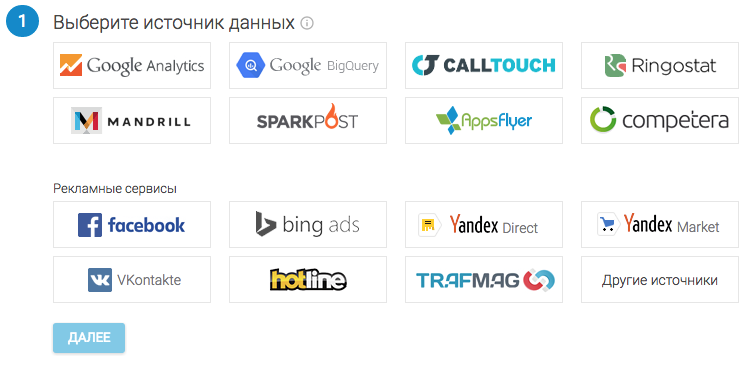
In the next step, you need to select a data source (in our case, this is Yandex.Market) and click the “Next” button.
On the next page, you need to add a Yandex.Market account. If you have not started it yet, click the “Add” button.
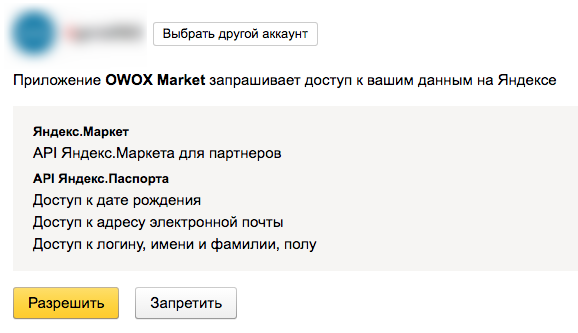
In a popup window, OWOX will ask you for permission to access the data.
In this case, you must be logged in under the account of the owner of the online store.
After adding, feel free to click "Next."
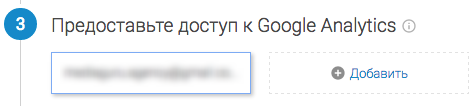
The next step is Google Analytics. If the account is running, choose it, if not - add, the principle is the same.
Step 4 - adding a resource to Google Analytics, where data from the Market will be imported.
The easiest way to find it by name. In the data, select the set that we created at the very beginning in Google Analytics.

At the last step, you need to configure the VAT, select the view where the data will be sent, and click "Create."

From this point on, data will begin to pull in Google Analytics. You should not wait for an instant download, the data is usually loaded for four hours, but sometimes the process takes up to 2-3 days.
For our purposes, we will use Google Spreadsheets. Go to their settings.
First you need to create a file in Google Spreadsheets.
docs.google.com/spreadsheets
IMPORTANT!
The account under which you create the file must be linked to Google Analytics of the resource of interest.
Next, go in steps to not miss anything.
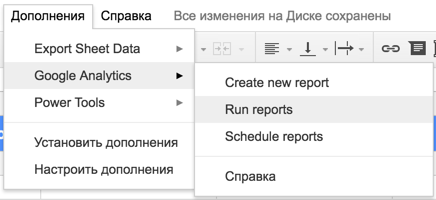
1. Install the Google Analytics add-on if you do not already have it. To do this, go to the menu - “Add-ons” -> “Install Add-ons”. Find GA on the first page or through search and install.
2. Create a configuration file for our report. Moving on: Add-ons -> GA -> Create new report.
The following sequence of actions is as follows:
2.1 Select a name. That is how the new report sheet will be called.
2.2 We select one by one an account, a resource and a presentation in Google Analytics, from which reports will be built. The presentation must be the same in which you set up the integration of expenses, otherwise they will not be reflected.
2.3 Choose indicators:
+ Users - users
+ Clicks - clicks
+ Transactions - transactions
+ Cost - cost
+ Cost per Transaction - Transaction Cost
+ Total Value - Order amount
+ Quantity - the number of goods purchased
If you need additional indicators, add. Listed is enough for the task.
2.4 Selecting parameters: Date (Date) and Source / Medium (Source / Channel)

Click Create Report.
A new sheet will appear in the document called Report Configuration, in which all necessary characteristics for the reports are set:
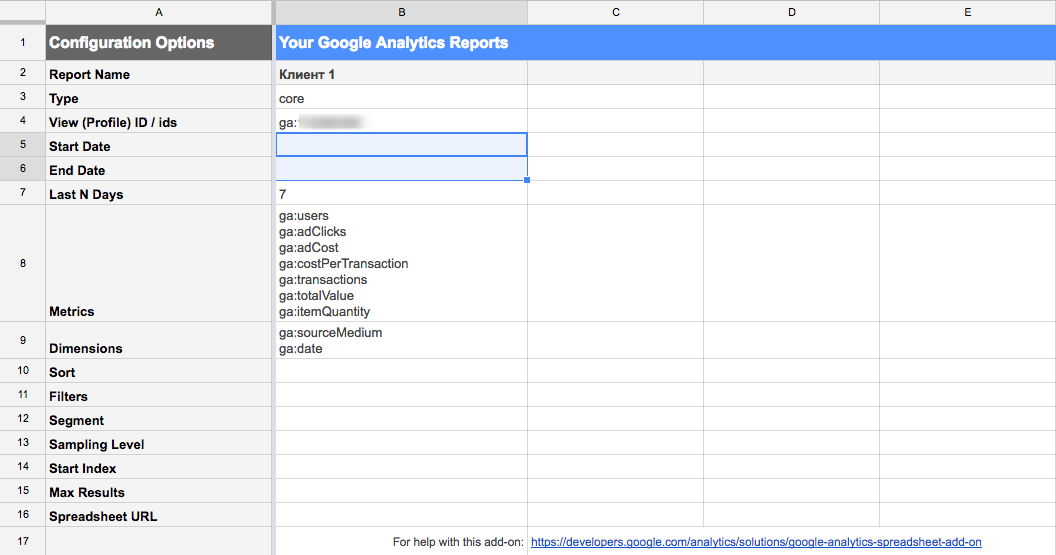
3. Edit the resulting report.
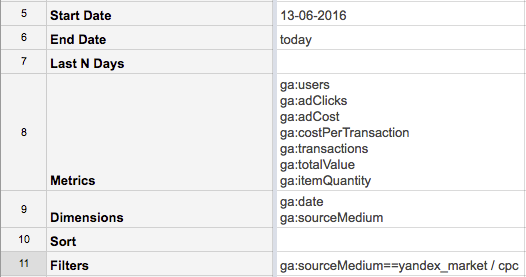
3.1 In the Start Date field we write the date from which the budget allocation report begins. As an option, this could be the start of an advertising campaign.
Writing format: 06/13/2016.
3.2 In the “End Date” field we write “today”.
3.3 The “Last N Days” field is cleared.
3.4 In the "Dimensions" field, you must put ga: date in the first place.
3.5 In the field “Filters” we add filter by source / channel: ga: sourceMedium == yandex_market / cpc
In the end, it should turn out like this:
4. Now we go:
Add-ons -> GA -> Schedule Reports.
In the window that opens, check the “Enable reports to run automatically” checkbox so that the reports are generated automatically, and select the time - every hour (every hour).
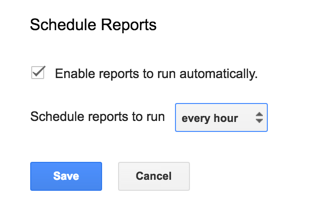
Click "Save" to save.
5. Settings are ready, it's time to generate a report:
Add-ons -> GA -> Run Reports
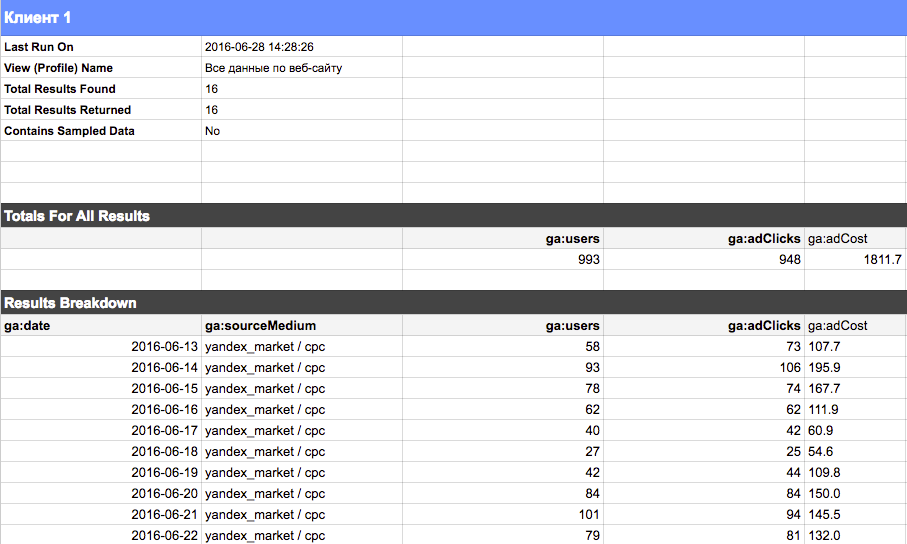
Report is ready:
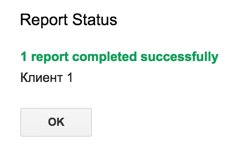
He looked unsightly:
6. Why is it necessary to create an additional sheet to work with this data?
• Changes made on this sheet will be lost after the next data update.
• Costs in their original form will not work, because the data is transmitted in text format, therefore, they need to be converted
For these reasons, create a new sheet, where we organize the data obtained.
Create columns:
• Date
• Transactions
• Number of goods
• CPO
• Revenue
• Costs / Forecast
• Projected Balance
• Monthly budget
• Number of days
7. For each column we use individual formulas:
Date, Transaction, Number of goods. Select the appropriate column / cell in the generated report for each data type:
= IF ('Customer 1'! A22 = ""; "No Data"; 'Customer 1'! A22)
As can be seen from the formula, we take the data from the page of the finished report and stretch the formula for the settlement period (usually a month - 30 days).
If there is no data yet, we will see the value, “No Data”.
Monthly budget:
This field sets the amount that is credited to the client's account ie net of VAT and commissions. Take care of this so that the money on your account does not run out before 30 days.
Costs / Forecast:
= IF (VALUE (SUBSTITUTE ('Client 1'! D16; "."; ",")) = 0; $ D $ 2 / $ E $ 2; VALUE (SUBSTITUTE ('Client 1'! D16; "."; " , ")))
In the formula, the following logic:
1. Points in the cost of the Republic of Kazakhstan are replaced by commas.
2. The cost of the RK per day is converted to a number.
3. If the cost per day is 0, then the costs are projected based on dividing the budget by the number of days.
4. If the value is greater than zero, the value is displayed.
Costs / Forecast amount:
The amount of the previous column.
CPO, Revenue:
= if (VALUE (SUBSTITUTE ('Client1'! G16; "."; ",")) = 0; 0; VALUE (SUBSTITUTE ('Client1'! G16; "."; ",")))
The formula is similar to the previous one, except that if, according to the given condition, there is no value, then 0 is substituted into the cell.
Days:
= COUNTA (A2: A31)
We count the number of filled rows in the first column.
The residue is:
= D2-SUM (B2: B31)
Subtract from the budget the sum of current costs and projected.
If you added transactions / CPO and other columns you need, you can also add and tighten them here in one of the ways.
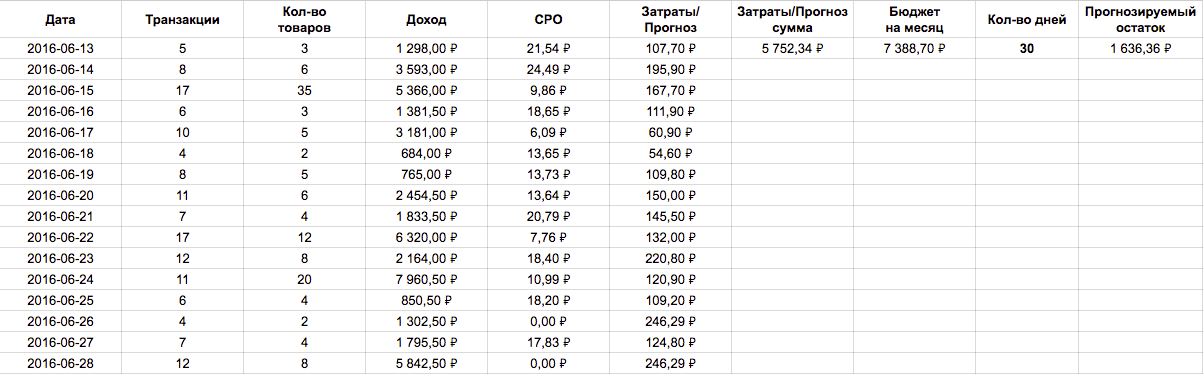
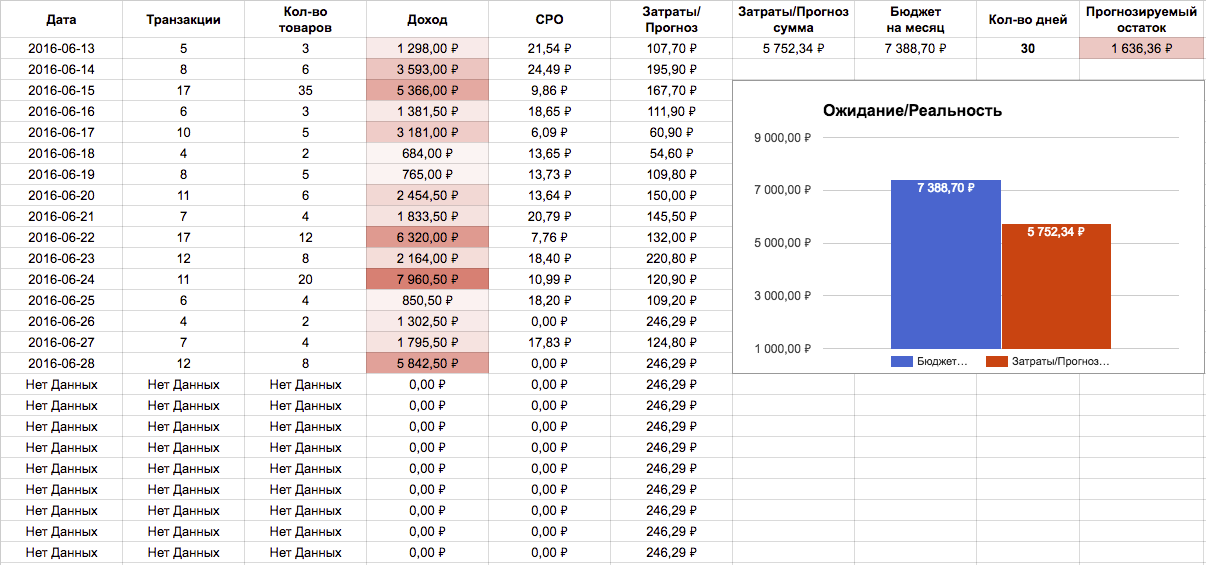
As a result, you should have a table similar to this:
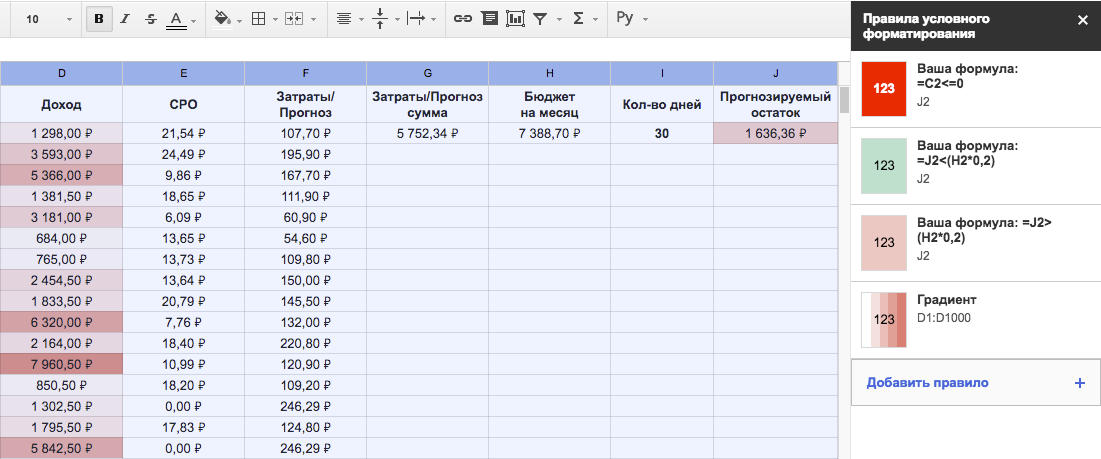
We recommend adding conditional formatting so that the extra data will not distract you or, on the contrary, be highlighted.
This can be done through the menu Format -> Conditional Formatting.
For example, in this way:
Finally, we turn to what it was all about.
The column “Predicted Balance” tells us that even if we continue to lead the Republic of Kazakhstan within the framework of a pre-calculated daily limit (budget for a month / number of days), then at the end of the period there will be 1,514.87 rubles.
When this amount is in front of our eyes, we see that it is possible to get additional traffic and additional conversions for the client, if this money is used effectively.
For greater clarity, it is best to use a graph.
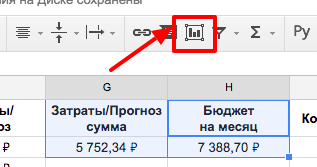
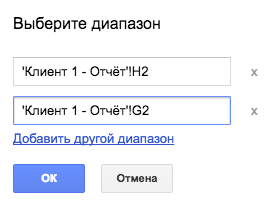
Select the cells with the heading and the value “Costs / Forecast amount” (similarly for “Monthly budget”) using ctrl on Windows or cmd on mac OS and click on the “Insert diagram” button:
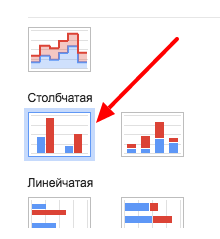
In the opened window on the left, select “Columnar”, then click “Insert”:
Then edit the chart for yourself, I did the following:
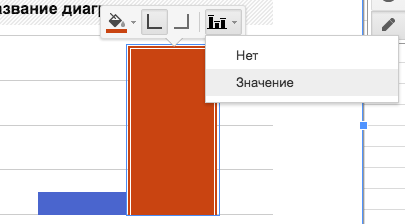
1. Added values to the graphs to immediately see the amount.
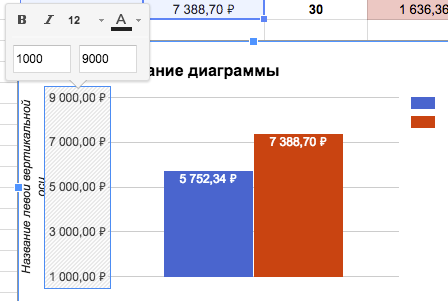
2. Expanded the minimum and maximum values to make the gap clearer.
3. Swapped the columns in the settings.
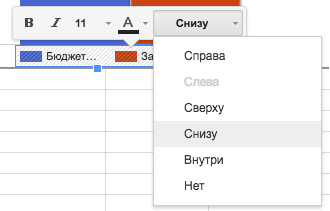
4. The location of the legend is chosen from below.
5. Hide the lateral axes and adjust the size of the window itself.
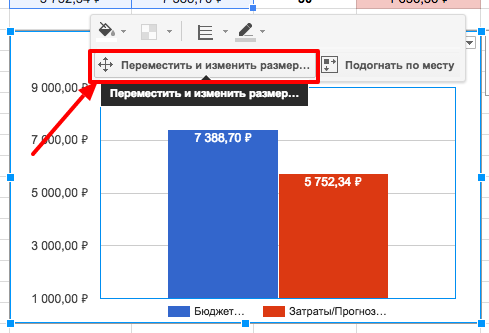
The finished version is as follows:
By the way, you can put together such reports on clients in a separate file, deleting all sheets with settings and leaving only the most important thing.
Formula:
= IMPORTRANGE ("166BYHk3-2Snvp4ix6shbhH_JKIHXwqWnmGrt0FAqd4k"; "Client 1! A1: M33")
166BYHk3-2Snvp4ix6shbhH_JKIHXwqWnmGrt0FAqd4k - key from the file link
Client 1! A1: M33 - sheet and range to import
This will only copy data without formatting and without charts.
Now you can effectively manage the budget if you see that there is an opportunity for an experiment. In this case, the statistics on transactions, income and CPO will clearly show you about the correctness of your actions or incorrectness: P
Author: Pavel Mrykin, specialist in contextual advertising agency automation
Source: https://habr.com/ru/post/304392/
All Articles