The implementation of interactive diagrams using OOP on the example of the prototype editor of UML diagrams. Part 1
Software developers often have to face the need to create two-dimensional interactive graphic components. Programmers who were previously accustomed to working only with data processing algorithms face great difficulties when such problems occur, unless you can do with some very primitive solution, such as a static image with predefined "active" areas. The non-standard task of many frightens and forces them to look for ready-made tools and libraries for drawing graphs. But no matter how multifunctional a library is, it will be something missing in it to solve exactly your problem.
In this article, we will examine in detail the creation from scratch of a component with interactive, drag-and-drop elements in an object-oriented development environment. As an example, we will build a prototype UML editor.
The list of tasks requiring the implementation of interactive graphics is quite extensive. It can be
- and so on and so forth. Although the appearance of all these diagrams is different, in all cases you need to implement some general requirements. Here they are:
The importance of the possibility of "dragging" items should be emphasized. If your task includes the need to visualize graphs, you need to remember: none of the numerous algorithms for automatically locating graph nodes on a plane can provide a solution that is completely satisfactory in all cases, and for the convenience of the user, manual rearrangement of graph nodes is simply necessary.
What are the "ingredients" needed to prepare this "dish"? In this article, we will show general principles that can be applied in any development environment when all four key conditions are met:
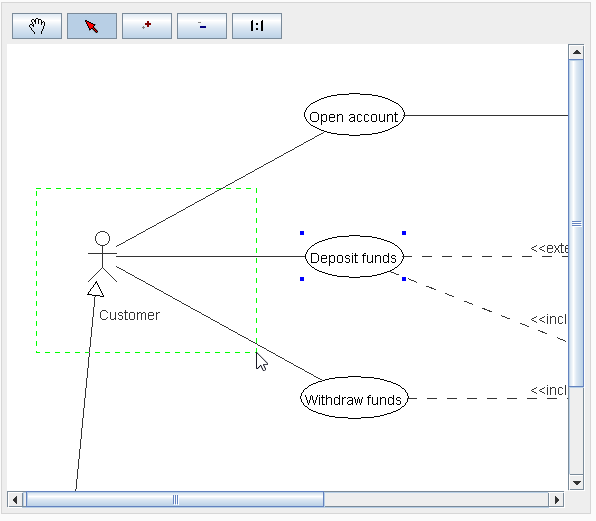
Our illustrative example is a prototype of the UML Use Case-diagrams editor, we will use the beautiful diagram from this manual . The source code of our example is available at https://github.com/inponomarev/graphexample and can be compiled using Maven. If you want to learn more about the principles outlined in the article, I strongly recommend that you download these sources and study them along with the article.
The example is built in Java 8 with the standard Swing library. However, there is nothing Java-specific in the principles outlined. We first implemented the principles outlined here in Delphi (Windows applications), and then in Google Web Toolkit (web applications with graphics output on HTML Canvas). If the above four conditions are met, the proposed example can be converted to another development environment.
')
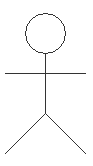
In general, drawing some kind of scheme on the screen using the methods of displaying graphic primitives is a task that is not difficult. Stick, stick, cucumber (with a similar exercise in the BASIC language once upon a time I first became acquainted with programming):
But so far our “little man” has not “come to life”: he cannot be singled out, scaled, moved on the canvas, he does not know how to interact with the society of other “little men”. So you need to write the code responsible for all these operations. For a simple picture, this seems simple, however, as the complexity of what we want to get, we are waiting for problems.
An attempt to solve the problem "in the forehead" with the complication of procedures is doomed to failure due to the rapid complication of the source code, the amount of which will grow like an avalanche as the diagram becomes more complex. However, the use of object-oriented development, the universal principle of "divide and conquer", as well as design patterns give us powerful enough tools to gracefully deal with the problems listed and implement the necessary functionality.
So, we proceed to the decision.
Let's start by breaking down the task into small pieces by building a hierarchical list of what we need to draw.
First, draw a picture that we want to get, on a blackboard or on paper:
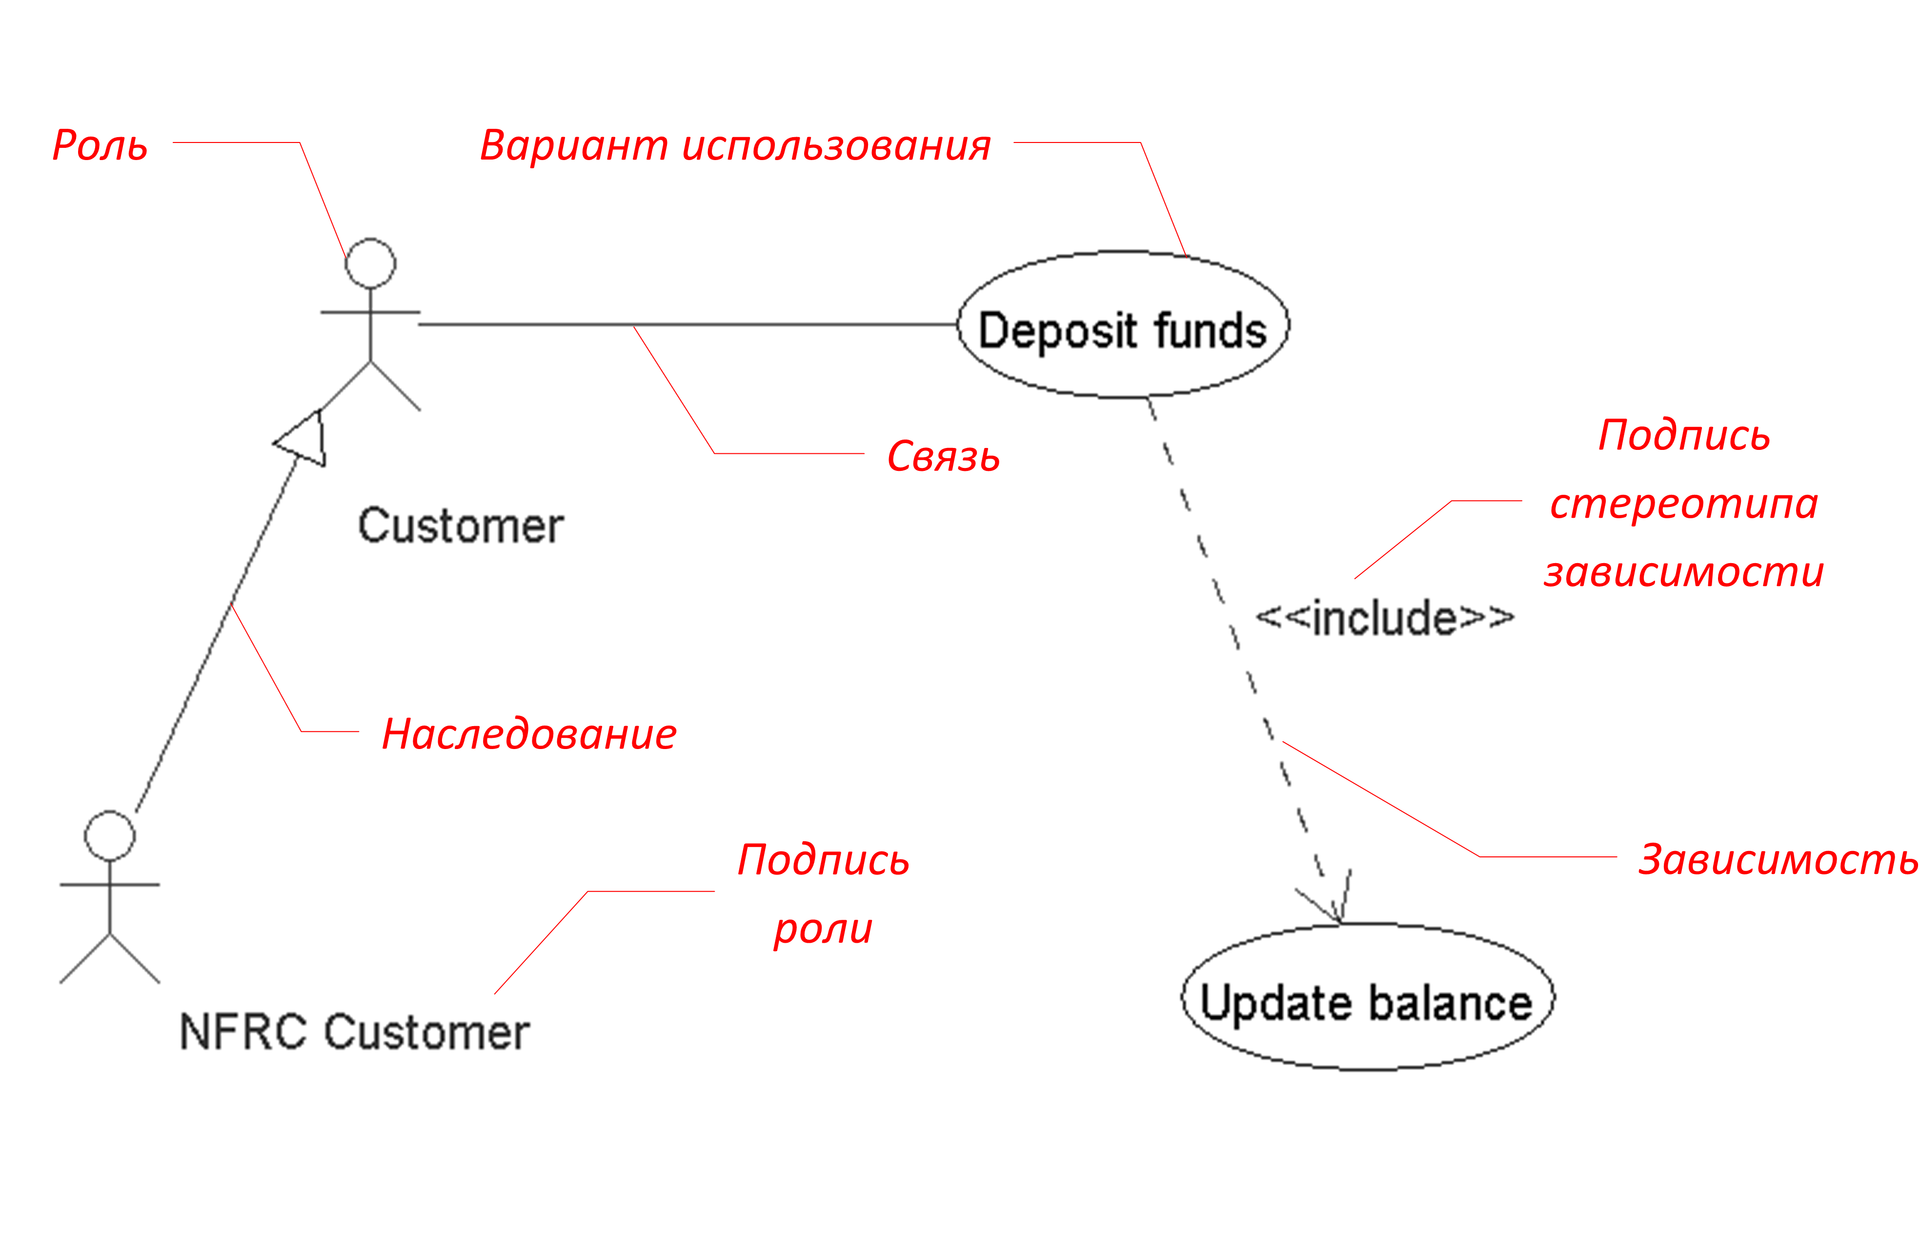
And build the following hierarchy:
Our example is, in fact, very simple, so the hierarchy was shallow. The more complex the picture, the wider and deeper the hierarchy will be.
Please note that some items are in italics . These are the objects in the diagram that we want to make selected and moved using the mouse cursor.
Each of the points in this hierarchy will correspond to a drawing class, and the hierarchical relationship between them allows the Composite pattern to be used — the “linker”, which (I quote the book “Design Patterns” ) “assembles objects into tree structures to represent part-whole hierarchies, allows… uniformly to treat individual and composite objects ". That is, doing exactly what we need.
On the class diagram, our system has the following form:
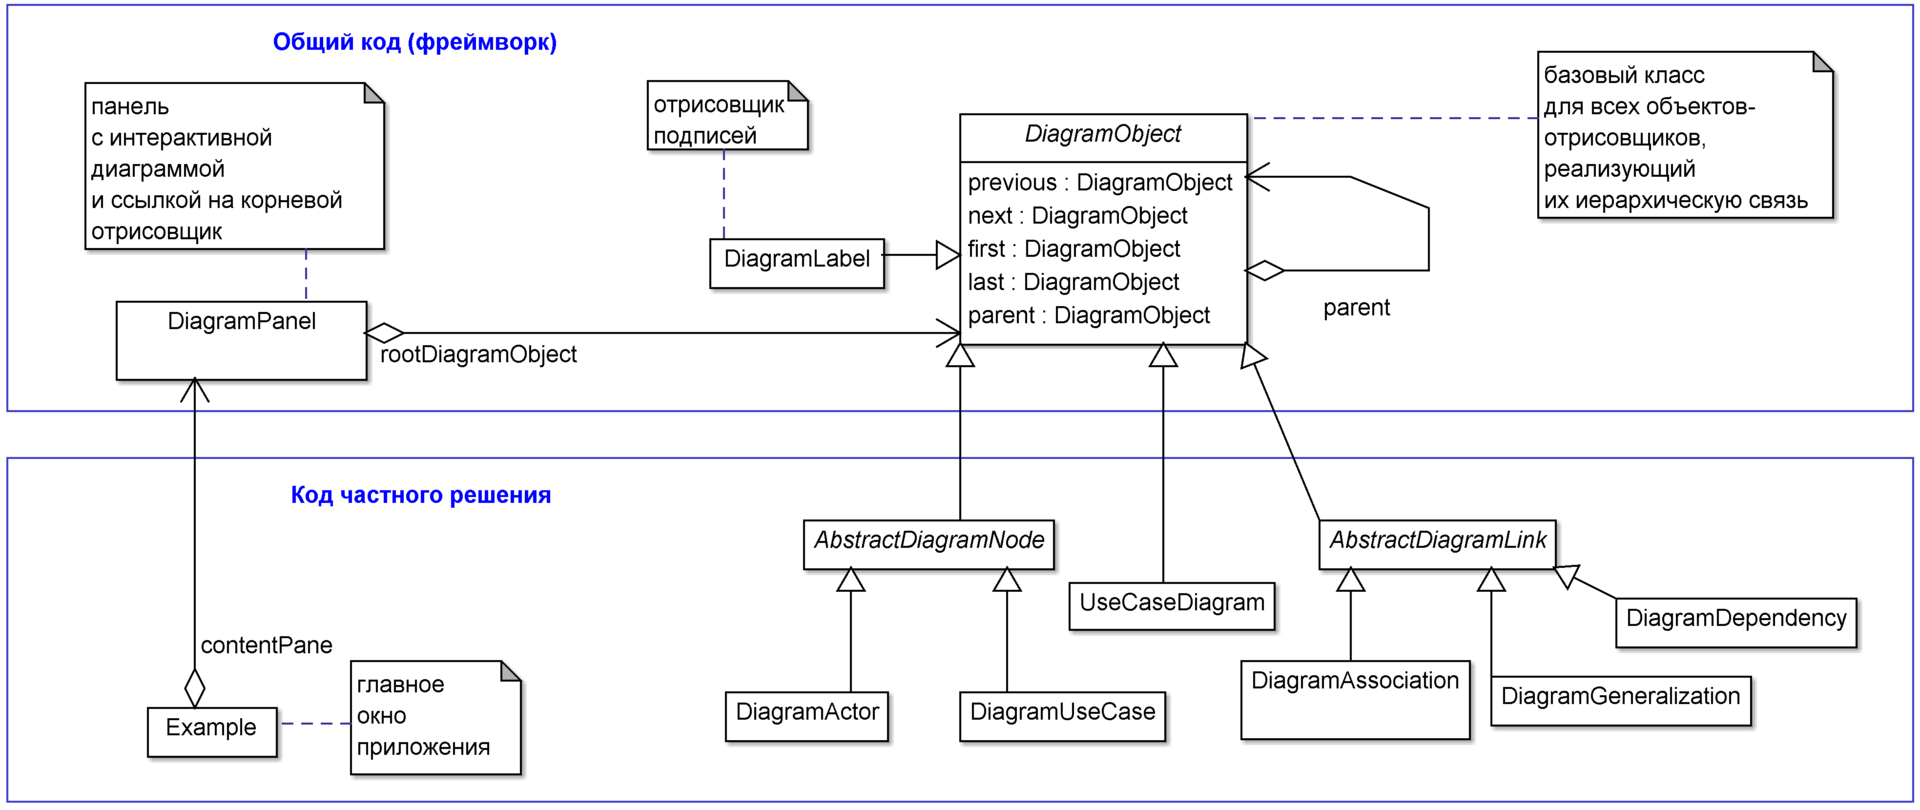
At the top of the class diagram are two classes (DiagramPanel and DiagramObject), which “do not know anything” about the specifics of the diagram being drawn and form a framework on the basis of which diagrams of various types can be made. DiagramPanel (in our case, this is the heir to the javax.swing.JPanel class) is a visual component of the interface responsible for displaying the diagram and its interaction with the user. The DiagramPanel object contains a link to the DiagramObject - the root drawing object corresponding to the highest level of the drawing hierarchy (in our case it will be an instance of the UseCaseDiagram class).
DiagramObject is the base class of all drawing objects, which implements their hierarchy through the Composite pattern and much more, which will be discussed further.
At the bottom is an example of using the framework. The Example class (the successor of javax.swing.JFrame) is the main application window, which in our example contains an instance of DiagramPanel as one single component. All other classes are descendants of DiagramObject. They correspond to the tasks in the hierarchical drawing list. Please note that the inheritance hierarchy of these classes and the drawing hierarchy are different hierarchies!
The rendering hierarchy, as described above, looks like this:
Next we describe in detail the device of the DiagramObject and DiagramPanel classes and how they should be used.
The DiagramObject class is designed so that inside each of its instances there is a doubly linked list of subordinate renderers. This is achieved with the help of the variables previous, next, first and last, which allow to refer to the neighboring elements in lists and hierarchy. When objects are instantiated, we get something like this:
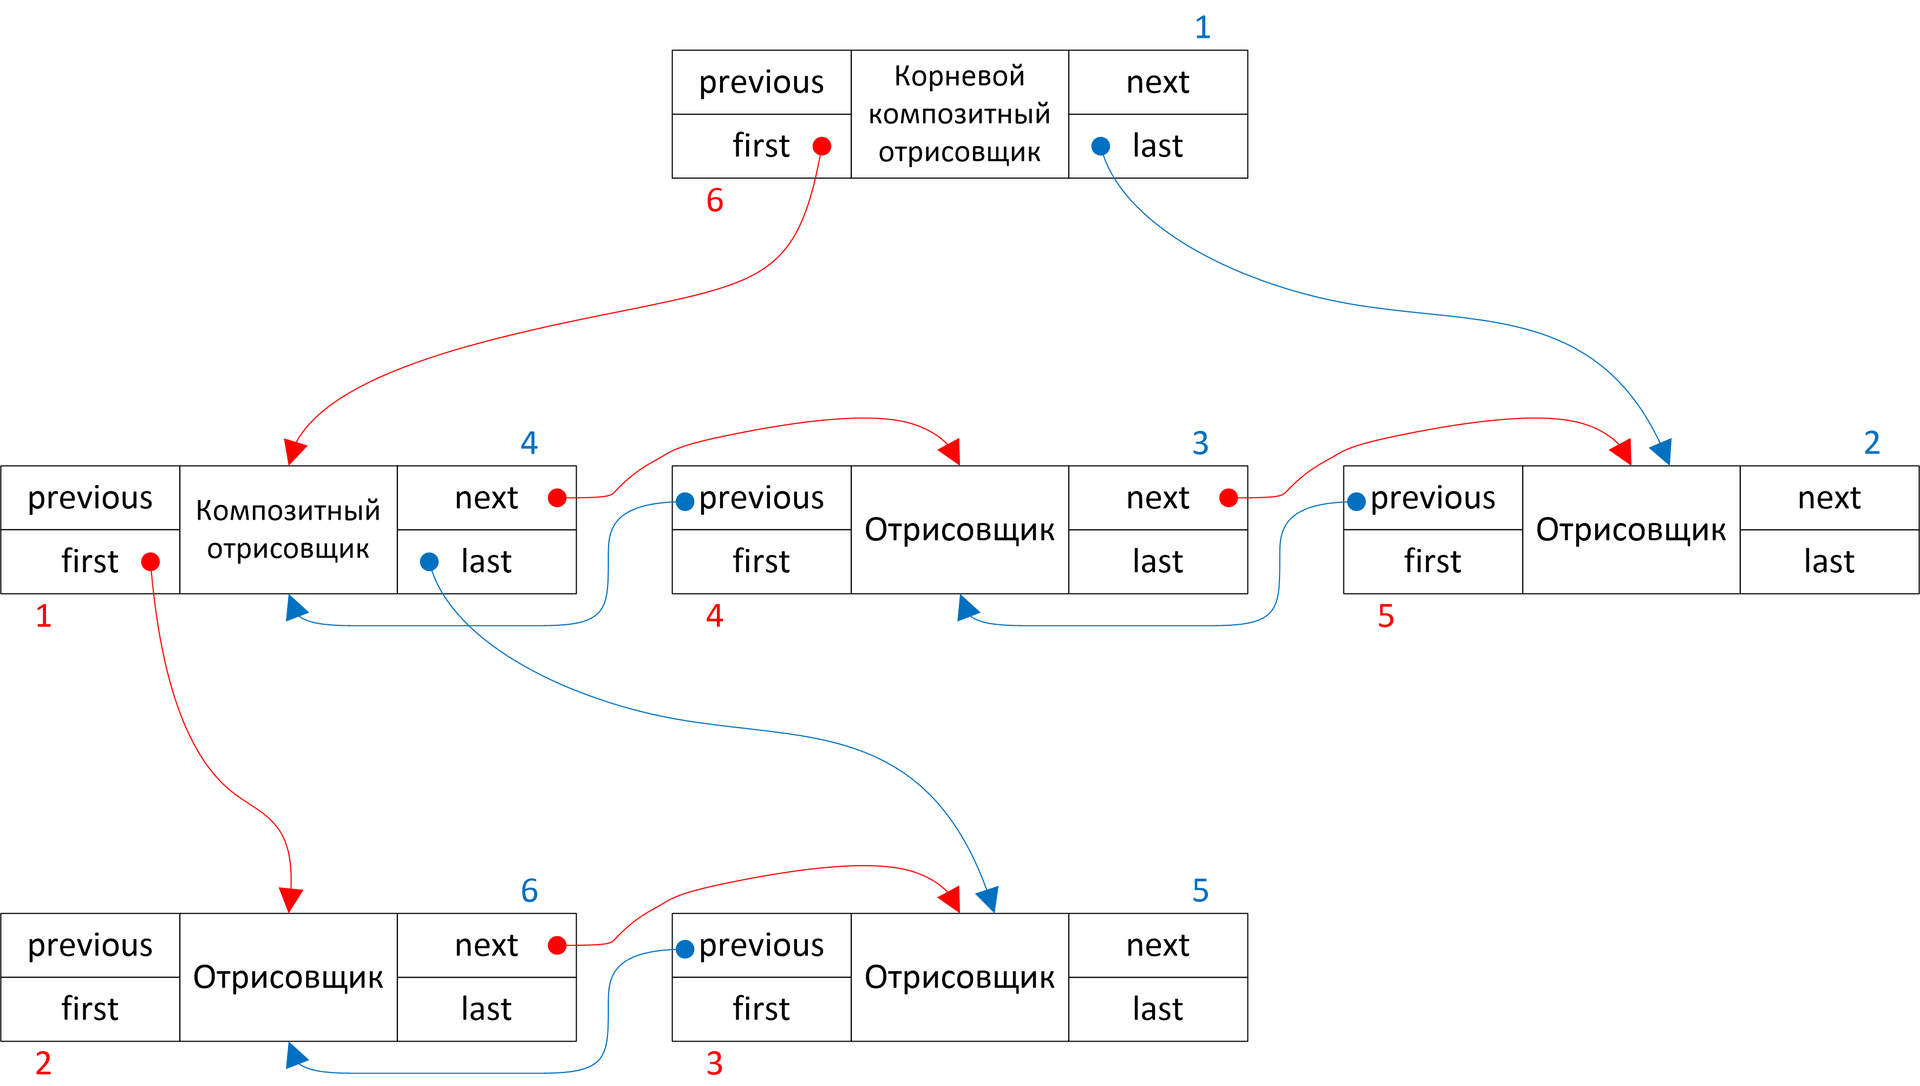
This data structure, similar to a simple doubly linked list, is good in that we can assemble the hierarchy we need in O (N) time, and in O (1) time, if necessary, and modify it by deleting a given element or inserting a new one into the list after which -or specified item. Access to the elements of this structure is of interest to us only sequential, corresponding to a tree-by-depth walkthrough, which is achieved by passing through the links. The movement along the red arrows corresponds to a round trip, and along the blue arrows - the round trip.
To add a new object to the internal DiagramObject list, use the addToQueue method (DiagramObject subObj):
In order to collect the desired picture, it remains only to instantiate the necessary number of necessary drawing devices and combine them into a queue in the right order. In our example, most of this work takes place in the UseCaseDiagram class constructor:
In real life, of course, this is not the case: instead of “stitching into the code” the process of creating drawing objects, you will need to transfer the data model of your system to the root class constructor. By traversing the objects of this model already in cycles, you will create a renderer. For example, for each instance of the class Actor associated with the current diagram (corresponding to the “role” in your “UML document model”), you must instantiate an object of the DiagramActor drawing class.
It is convenient when the renderers store references to the corresponding model objects. It is more convenient to transfer these links directly in the form of the parameters of the designers of renderers. In our example, instead of them, world coordinates of objects and their parameters, such as name and stereotype, are transmitted.
Since we have used the term “world coordinates”, we need to clarify what it is in our case. Our “world coordinates” are the coordinates of the chart objects on “imaginary graph paper”, on which the whole diagram fits, which has a origin in the upper left corner and does not undergo any scaling. World coordinates coincide with screen ones if the scale of the picture is 1: 1 and the scroll bars are in their minimum positions. The world coordinate, in contrast to the screen, is not an integer type, but takes the value with a floating point. This is to prevent pixelization of the image while increasing its scale. For example, although at a scale of 1: 1, the value of world coordinate 0.3 is indistinguishable from zero screen pixels, at a scale of 100: 1 it turns into 30 screen pixels.
It is convenient to calculate and store the model of the diagram in world coordinates, since they are not dependent on such short-term user actions as zooming and scrolling.
To translate world coordinates into screen classes, the DiagramObject class contains important methods scaleX (...), scaleY (...) and simply scale (...). The first two apply a scale factor to the world coordinate and take into account the shift of the horizontal and vertical scroll bars, respectively. The latter method, scale (...), applies a scale factor, but does not take into account the shift: it is necessary to calculate not the position, but the size (for example, the width of a rectangle or the radius of a circle).
To draw the diagram, the draw (Graphics canvas, double aDX, double aDY, double scale) method of the root DiagramObject is called. Its parameters are:
This method implements the Template Method design pattern (template method) and looks like this:
That is, the draw (...) method:
Thus, the invariant part of the algorithm is implemented in the draw (...) method, and the variable part (the actual drawing) is implemented in the successor classes, which is the essence of the Template Method pattern.
The purpose of the saveCanvasSetup () and restoreCanvasSetup () methods is to save the state of the drawing context, so that each of the drawing objects receives it in an “untouched” form. If these methods are not used, and in one of the heirs of the renderers, for example, the color of the ink is changed to red, then everything that will be drawn further will be painted in red. The implementation of these methods depends on your development environment and the possibilities provided by the drawing engine. In Delphi and Java Swing, for example, you need to save a lot of context parameters, and HTML Canvas2D specifically for this purpose has ready save () and restore () methods that immediately save the entire context state to a special stack.
Here is the internalDraw method in the DiagramActor class (compare with the “naive example” we started with):
At the point (mX, mY) is the middle of the object. Since the origin of the coordinates of the “naive example” is in the upper left corner, they must be shifted by half the width and half of the height of the object. The “naive example” did not take into account the need to scale and shift the image, but we take this into account by converting world coordinates to screen using the methods scaleX (...), scaleY (...) and scale (...).
The DiagramActor and DiagramUseCase objects are completely “independent”, their positions are entirely determined by the internal state stored in the fields mX and mY. At the same time, all sorts of connecting arrows of their own state do not have - their position on the screen is completely determined by the positions of the objects they connect, they are completely “not independent”, they pass along a straight line connecting the centers of the objects:
And separately you should pay attention to the signatures to the objects. In their internal state, they do not store absolute coordinates, but an offset relative to the parent drawing object, so they behave semi-independently:
Having dealt with the drawing, we proceed to the question of how the diagram “understands” the object we clicked on. It turns out that the task of defining an object under the mouse cursor is very similar to the task of drawing and is in a certain sense symmetrical to it.
First, we note that for each given object of the diagram, it is not difficult to write a method that determines, by the coordinates of the mouse cursor, whether the cursor is over this object or not.
For example, for the DiagramActor we are talking about getting into a rectangular area:
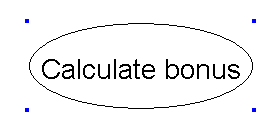
For DiagramUseCase we are talking about getting into an area that looks like an ellipse:
Now, if we want to determine the object that the cursor is currently over, we can use the sequential iteration method to call internalTestHit for each of the chart objects, and the first one that returns true will be the required object. Only this should be done in the reverse order of rendering (moving along the blue arrows in the illustration showing the data structure)! If the mouse cursor is in the area where several objects intersect, the search in the reverse order will ensure that the cursor hits the object drawn later than the others, that is, visually located “above the others”.
Here is how it is implemented in another DiagramObject template method:
The DiagramPanel object calls the testHit method of the root drawing object. During its execution, a recursion occurs that performs a traversal of the drawing tree in depth in the direction opposite to the drawing direction. The first object found is returned: this will be the “highest” object from the user's point of view, which is under the mouse cursor.
The object under the mouse cursor may be only an integral part of a larger object and not have an independent value. If we want to perform some operation on an object and clicked on its part, then the operation still needs to be performed on the parent object. Correct context can be shown with the help of delegation - reception associated with the use of the Composite pattern (see the book on Design Patterns). In our example, we use delegation to get the object's tooltip: for example, if the user hovers the mouse cursor over the Actor's signature, he receives the same hint as when the cursor is actually pointing at the Actor.
The idea is very simple: the getHint () method of the DiagramObject class does the following: if its own implementation of the internalGetHint () method is able to return a hint string, then it is returned as well. If it is not able, then the parent (in the drawing hierarchy) object is accessed - can it perform the getHint () method operation? In the event that it is also “not taken”, the “transfer of responsibility” will continue to the very root drawing object. In addition to the delegation mechanism, we reapply the Template Method pattern:
The DiagramObject heirs can override the following methods — their use in the DiagramPanel class will become clear from the following:
And finally, another important functionality implemented at the DiagramObject level that can be redefined in its successors is the selection drawing, that is, a graphic label by which the user can understand that the object is in the selected state. By default, these are four blue square dots in the corners of the object:
Pay attention to the integer (and therefore, in screen coordinates) parameters dX, dY and to the setXORMode () call that switches the rendering context to “XOR mode”: in this mode, to erase the previously drawn image, just draw it again . , Drag&Drop : , «» , , , dX, dY :
, internalDrawSelection DiagramObject, ( drag&drop) - .
, DrawObject. DiagramPanel, , , drag&drop. , , https://github.com/inponomarev/graphexample Maven.
In this article, we will examine in detail the creation from scratch of a component with interactive, drag-and-drop elements in an object-oriented development environment. As an example, we will build a prototype UML editor.
Formulation of the problem
Basic solution requirements
The list of tasks requiring the implementation of interactive graphics is quite extensive. It can be
- conventional equipment diagrams (installations, conveyors, transport systems) on which the operation status of the nodes is displayed, “at the click of the mouse” the user wants to receive additional information or enter control commands,
- analytical graphs (histograms, bubble charts), “at the click of a mouse” on which elements the user wants to receive information, or the user wants to directly “drag” elements with the mouse, changing the picture in the right direction to find out the necessary numerical indicators,
- visual analysis of data represented in the form of graphs (for example: relationships between legal entities in the database), the user wants to “drag” the elements of the graph manually in order to finally insert the resulting image into the printed report,
- all means of visual modeling / designing of any of the blocks, in particular, all CASE-tools,
- and so on and so forth. Although the appearance of all these diagrams is different, in all cases you need to implement some general requirements. Here they are:
- The picture should consist of discrete elements of different graphic complexity,
- The picture should be scalable and scrollable, i.e. the user should be able to see any of the fragments of the diagram using a larger scale, using the zoom and scroll bars,

- Some of the elements of the picture must be “clickable”, i.e. the system must at each moment “understand” what element the mouse pointer is pointing at, be able to show tooltips for them,
- Some of the “clickable” elements should be “selectable”, i.e. the user should be able to “put a selection” on the element by a mouse click, the selection of a group of elements should be available with the Shift key pressed and using the “rectangular lasso”. With selected objects, depending on the task, some actions or changes in properties can be performed.
- Some of the “clickable” elements should be “draggable”, i.e. the user should be able to move one element or a group of selected elements with the mouse:
The importance of the possibility of "dragging" items should be emphasized. If your task includes the need to visualize graphs, you need to remember: none of the numerous algorithms for automatically locating graph nodes on a plane can provide a solution that is completely satisfactory in all cases, and for the convenience of the user, manual rearrangement of graph nodes is simply necessary.
What are the "ingredients" needed to prepare this "dish"? In this article, we will show general principles that can be applied in any development environment when all four key conditions are met:
- Object Oriented Programming Language.
- The availability of the object “canvas” (Canvas), with the possibility of drawing graphic primitives (lines, arcs, polygons, etc.).
- Components that implement manageable scroll bars.
- Availability of mouse event handling.
Our illustrative example is a prototype of the UML Use Case-diagrams editor, we will use the beautiful diagram from this manual . The source code of our example is available at https://github.com/inponomarev/graphexample and can be compiled using Maven. If you want to learn more about the principles outlined in the article, I strongly recommend that you download these sources and study them along with the article.
The example is built in Java 8 with the standard Swing library. However, there is nothing Java-specific in the principles outlined. We first implemented the principles outlined here in Delphi (Windows applications), and then in Google Web Toolkit (web applications with graphics output on HTML Canvas). If the above four conditions are met, the proposed example can be converted to another development environment.
')
The difficulties of the "naive" approach
In general, drawing some kind of scheme on the screen using the methods of displaying graphic primitives is a task that is not difficult. Stick, stick, cucumber (with a similar exercise in the BASIC language once upon a time I first became acquainted with programming):
canvas.drawOval(10, 0, 10, 10); canvas.drawLine(15, 10, 15, 25); canvas.drawLine(5, 15, 25, 15); canvas.drawLine(5, 35, 15, 25); canvas.drawLine(25, 35, 15, 25); But so far our “little man” has not “come to life”: he cannot be singled out, scaled, moved on the canvas, he does not know how to interact with the society of other “little men”. So you need to write the code responsible for all these operations. For a simple picture, this seems simple, however, as the complexity of what we want to get, we are waiting for problems.
- With the complexity of the picture, the length of the “drawing procedure” increases. For a complex scheme, the procedure becomes very long and confusing.
- The code that draws the picture itself “by magic” does not set a criterion by which it would be possible to determine the object currently selected by the mouse cursor. We have to write a separate procedure that defines the object over which the mouse cursor is located, and at the same time, we must constantly synchronize the drawing procedure code and the object recognition procedures.
- Along with the complexity of the drawing procedure, the complexity of the recognition procedure increases.
An attempt to solve the problem "in the forehead" with the complication of procedures is doomed to failure due to the rapid complication of the source code, the amount of which will grow like an avalanche as the diagram becomes more complex. However, the use of object-oriented development, the universal principle of "divide and conquer", as well as design patterns give us powerful enough tools to gracefully deal with the problems listed and implement the necessary functionality.
So, we proceed to the decision.
Task decomposition Class structure
Let's start by breaking down the task into small pieces by building a hierarchical list of what we need to draw.
First, draw a picture that we want to get, on a blackboard or on paper:
And build the following hierarchy:
- The whole diagram
- Roles (Actors)
- Role signatures
- Use Cases
- Inheritance (generalizations)
- Associations
- Dependencies (dependencies)
- Signatures of dependency stereotypes
- Roles (Actors)
Our example is, in fact, very simple, so the hierarchy was shallow. The more complex the picture, the wider and deeper the hierarchy will be.
Please note that some items are in italics . These are the objects in the diagram that we want to make selected and moved using the mouse cursor.
Each of the points in this hierarchy will correspond to a drawing class, and the hierarchical relationship between them allows the Composite pattern to be used — the “linker”, which (I quote the book “Design Patterns” ) “assembles objects into tree structures to represent part-whole hierarchies, allows… uniformly to treat individual and composite objects ". That is, doing exactly what we need.
On the class diagram, our system has the following form:
At the top of the class diagram are two classes (DiagramPanel and DiagramObject), which “do not know anything” about the specifics of the diagram being drawn and form a framework on the basis of which diagrams of various types can be made. DiagramPanel (in our case, this is the heir to the javax.swing.JPanel class) is a visual component of the interface responsible for displaying the diagram and its interaction with the user. The DiagramPanel object contains a link to the DiagramObject - the root drawing object corresponding to the highest level of the drawing hierarchy (in our case it will be an instance of the UseCaseDiagram class).
DiagramObject is the base class of all drawing objects, which implements their hierarchy through the Composite pattern and much more, which will be discussed further.
At the bottom is an example of using the framework. The Example class (the successor of javax.swing.JFrame) is the main application window, which in our example contains an instance of DiagramPanel as one single component. All other classes are descendants of DiagramObject. They correspond to the tasks in the hierarchical drawing list. Please note that the inheritance hierarchy of these classes and the drawing hierarchy are different hierarchies!
The rendering hierarchy, as described above, looks like this:
- UseCaseDiagram - whole diagram,
- DiagramActor - the role
- Label - the role signature,
- DiagramUseCase - use case,
- DiagramGeneralization - inheritance,
- DiagramAssociation - communication,
- DiagramDependency - dependency,
- Label - the signature of the dependence stereotype.
- DiagramActor - the role
Next we describe in detail the device of the DiagramObject and DiagramPanel classes and how they should be used.
Class DiagramObject and its heirs
Data structure
The DiagramObject class is designed so that inside each of its instances there is a doubly linked list of subordinate renderers. This is achieved with the help of the variables previous, next, first and last, which allow to refer to the neighboring elements in lists and hierarchy. When objects are instantiated, we get something like this:
This data structure, similar to a simple doubly linked list, is good in that we can assemble the hierarchy we need in O (N) time, and in O (1) time, if necessary, and modify it by deleting a given element or inserting a new one into the list after which -or specified item. Access to the elements of this structure is of interest to us only sequential, corresponding to a tree-by-depth walkthrough, which is achieved by passing through the links. The movement along the red arrows corresponds to a round trip, and along the blue arrows - the round trip.
To add a new object to the internal DiagramObject list, use the addToQueue method (DiagramObject subObj):
if (last!=null)) { last.next = subObj; subObj.previous = last; } else { first = subObj; subObj.previous = null; } subObj.next = null; subObj.parent = this; last = subObj; In order to collect the desired picture, it remains only to instantiate the necessary number of necessary drawing devices and combine them into a queue in the right order. In our example, most of this work takes place in the UseCaseDiagram class constructor:
DiagramActor a1 = new DiagramActor(70, 150, "Customer"); addToQueue(a1); DiagramActor a2 = new DiagramActor(50, 350, "NFRC Customer"); addToQueue(a2); DiagramActor a3 = new DiagramActor(600, 50, "Bank Employee"); addToQueue(a3); … DiagramUseCase uc1 = new DiagramUseCase(250, 50, "Open account"); addToQueue(uc1); DiagramUseCase uc2 = new DiagramUseCase(250, 150, "Deposit funds"); addToQueue(uc2); … addToQueue(new DiagramAssociation(a1, uc1)); addToQueue(new DiagramAssociation(a1, uc2)); … addToQueue(new DiagramDependency(uc2, uc5, DependencyStereotype.EXTEND)); addToQueue(new DiagramDependency(uc2, uc6, DependencyStereotype.INCLUDE)); … addToQueue(new DiagramGeneralization(a2, a1)); In real life, of course, this is not the case: instead of “stitching into the code” the process of creating drawing objects, you will need to transfer the data model of your system to the root class constructor. By traversing the objects of this model already in cycles, you will create a renderer. For example, for each instance of the class Actor associated with the current diagram (corresponding to the “role” in your “UML document model”), you must instantiate an object of the DiagramActor drawing class.
It is convenient when the renderers store references to the corresponding model objects. It is more convenient to transfer these links directly in the form of the parameters of the designers of renderers. In our example, instead of them, world coordinates of objects and their parameters, such as name and stereotype, are transmitted.
World and screen coordinates
Since we have used the term “world coordinates”, we need to clarify what it is in our case. Our “world coordinates” are the coordinates of the chart objects on “imaginary graph paper”, on which the whole diagram fits, which has a origin in the upper left corner and does not undergo any scaling. World coordinates coincide with screen ones if the scale of the picture is 1: 1 and the scroll bars are in their minimum positions. The world coordinate, in contrast to the screen, is not an integer type, but takes the value with a floating point. This is to prevent pixelization of the image while increasing its scale. For example, although at a scale of 1: 1, the value of world coordinate 0.3 is indistinguishable from zero screen pixels, at a scale of 100: 1 it turns into 30 screen pixels.
It is convenient to calculate and store the model of the diagram in world coordinates, since they are not dependent on such short-term user actions as zooming and scrolling.
To translate world coordinates into screen classes, the DiagramObject class contains important methods scaleX (...), scaleY (...) and simply scale (...). The first two apply a scale factor to the world coordinate and take into account the shift of the horizontal and vertical scroll bars, respectively. The latter method, scale (...), applies a scale factor, but does not take into account the shift: it is necessary to calculate not the position, but the size (for example, the width of a rectangle or the radius of a circle).
Diagram drawing from the DiagramObject point of view. Independent, semi-independent and dependent objects
To draw the diagram, the draw (Graphics canvas, double aDX, double aDY, double scale) method of the root DiagramObject is called. Its parameters are:
- canvas - drawing context
- aDX, aDY - scroll bar positions
- scale - scale (1.0 - for scale 1: 1, more / less - for increase / decrease).
This method implements the Template Method design pattern (template method) and looks like this:
this.canvas = canvas; this.scale = scale; dX = aDX; dY = aDY; saveCanvasSetup(); internalDraw(canvas); restoreCanvasSetup(); DiagramObject curObj = first; while (assigned(curObj)) { curObj.draw(canvas, aDX, aDY, scale); curObj = curObj.next; } That is, the draw (...) method:
- remembers the parameters in the object fields (they are then repeatedly used by different methods),
- saves with saveCanvasSetup () all settings of the rendering context (color, pens, font size, etc.),
- calls the internalDraw () method, which at the DiagramObject level does nothing, and in its successors is overridden by the object's drawing procedure,
- restores using restoreCanvasSetup () settings that could be broken after executing internalDraw,
- runs through all its sub-objects in turn and calls the draw method for each of them.
Thus, the invariant part of the algorithm is implemented in the draw (...) method, and the variable part (the actual drawing) is implemented in the successor classes, which is the essence of the Template Method pattern.
The purpose of the saveCanvasSetup () and restoreCanvasSetup () methods is to save the state of the drawing context, so that each of the drawing objects receives it in an “untouched” form. If these methods are not used, and in one of the heirs of the renderers, for example, the color of the ink is changed to red, then everything that will be drawn further will be painted in red. The implementation of these methods depends on your development environment and the possibilities provided by the drawing engine. In Delphi and Java Swing, for example, you need to save a lot of context parameters, and HTML Canvas2D specifically for this purpose has ready save () and restore () methods that immediately save the entire context state to a special stack.
Here is the internalDraw method in the DiagramActor class (compare with the “naive example” we started with):
static final double ACTOR_WIDTH = 25.0; static final double ACTOR_HEIGHT = 35.0; @Override protected void internalDraw(Graphics canvas) { double mX = getmX(); double mY = getmY(); canvas.drawOval(scaleX(mX + 10 - ACTOR_WIDTH / 2), scaleY(mY + 0 - ACTOR_HEIGHT / 2), scale(10), scale(10)); canvas.drawLine(scaleX(mX + 15 - ACTOR_WIDTH / 2), scaleY(mY + 10 - ACTOR_HEIGHT / 2), scaleX(mX + 15 - ACTOR_WIDTH / 2), scaleY(mY + 25 - ACTOR_HEIGHT / 2)); canvas.drawLine(scaleX(mX + 5 - ACTOR_WIDTH / 2), scaleY(mY + 15 - ACTOR_HEIGHT / 2), scaleX(mX + 25 - ACTOR_WIDTH / 2), scaleY(mY + 15 - ACTOR_HEIGHT / 2)); canvas.drawLine(scaleX(mX + 5 - ACTOR_WIDTH / 2), scaleY(mY + 35 - ACTOR_HEIGHT / 2), scaleX(mX + 15 - ACTOR_WIDTH / 2), scaleY(mY + 25 - ACTOR_HEIGHT / 2)); canvas.drawLine(scaleX(mX + 25 - ACTOR_WIDTH / 2), scaleY(mY + 35 - ACTOR_HEIGHT / 2), scaleX(mX + 15 - ACTOR_WIDTH / 2), scaleY(mY + 25 - ACTOR_HEIGHT / 2)); } At the point (mX, mY) is the middle of the object. Since the origin of the coordinates of the “naive example” is in the upper left corner, they must be shifted by half the width and half of the height of the object. The “naive example” did not take into account the need to scale and shift the image, but we take this into account by converting world coordinates to screen using the methods scaleX (...), scaleY (...) and scale (...).
The DiagramActor and DiagramUseCase objects are completely “independent”, their positions are entirely determined by the internal state stored in the fields mX and mY. At the same time, all sorts of connecting arrows of their own state do not have - their position on the screen is completely determined by the positions of the objects they connect, they are completely “not independent”, they pass along a straight line connecting the centers of the objects:
And separately you should pay attention to the signatures to the objects. In their internal state, they do not store absolute coordinates, but an offset relative to the parent drawing object, so they behave semi-independently:
Detecting the object under the mouse cursor
Having dealt with the drawing, we proceed to the question of how the diagram “understands” the object we clicked on. It turns out that the task of defining an object under the mouse cursor is very similar to the task of drawing and is in a certain sense symmetrical to it.
First, we note that for each given object of the diagram, it is not difficult to write a method that determines, by the coordinates of the mouse cursor, whether the cursor is over this object or not.
For example, for the DiagramActor we are talking about getting into a rectangular area:
protected boolean internalTestHit(double x, double y) { double dX = x - getmX(); double dY = y - getmY(); return dY > -ACTOR_HEIGHT / 2 && dY < ACTOR_HEIGHT / 2 && dX > -ACTOR_WIDTH / 2 && dX < ACTOR_WIDTH / 2; } For DiagramUseCase we are talking about getting into an area that looks like an ellipse:
protected boolean internalTestHit(double x, double y) { double dX = 2 * getScale() * (x - getmX()) / (width + 2 * MARGIN / getScale()); double dY = 2 * (y - getmY()) / HEIGHT; return dX * dX + dY * dY <= 1; } Now, if we want to determine the object that the cursor is currently over, we can use the sequential iteration method to call internalTestHit for each of the chart objects, and the first one that returns true will be the required object. Only this should be done in the reverse order of rendering (moving along the blue arrows in the illustration showing the data structure)! If the mouse cursor is in the area where several objects intersect, the search in the reverse order will ensure that the cursor hits the object drawn later than the others, that is, visually located “above the others”.
Here is how it is implemented in another DiagramObject template method:
public final DiagramObject testHit(int x, int y) { DiagramObject result; DiagramObject curObj = last; while (assigned(curObj)) { result = curObj.testHit(x, y); if (assigned(result)) return result; curObj = curObj.previous; } if (internalTestHit(x / scale + dX, y / scale + dY)) result = this; else { result = null; } return result; } The DiagramPanel object calls the testHit method of the root drawing object. During its execution, a recursion occurs that performs a traversal of the drawing tree in depth in the direction opposite to the drawing direction. The first object found is returned: this will be the “highest” object from the user's point of view, which is under the mouse cursor.
Defining the current context under the mouse cursor
The object under the mouse cursor may be only an integral part of a larger object and not have an independent value. If we want to perform some operation on an object and clicked on its part, then the operation still needs to be performed on the parent object. Correct context can be shown with the help of delegation - reception associated with the use of the Composite pattern (see the book on Design Patterns). In our example, we use delegation to get the object's tooltip: for example, if the user hovers the mouse cursor over the Actor's signature, he receives the same hint as when the cursor is actually pointing at the Actor.
The idea is very simple: the getHint () method of the DiagramObject class does the following: if its own implementation of the internalGetHint () method is able to return a hint string, then it is returned as well. If it is not able, then the parent (in the drawing hierarchy) object is accessed - can it perform the getHint () method operation? In the event that it is also “not taken”, the “transfer of responsibility” will continue to the very root drawing object. In addition to the delegation mechanism, we reapply the Template Method pattern:
public String getHint() { StringBuilder hintStr = new StringBuilder(); if (internalGetHint(hintStr)) return hintStr.toString(); else if (assigned(parent)) return parent.getHint(); else { return ""; } } protected boolean internalGetHint(StringBuilder hintStr) { return false; } DiagramObject Helper Methods
The DiagramObject heirs can override the following methods — their use in the DiagramPanel class will become clear from the following:
- boolean isCollectable () - whether it will be possible to capture an object using a "lasso" (rectangular selection). Used by the DiagramPanel mechanisms, which will be discussed further
- boolean isMoveable () - whether the object is moved with the help of Drag and Drop. In our example, the diagram nodes (Actor and UseCase) are movable and captured with a lasso, and the connecting lines (Association, Generalization, Dependency) are not.
- double getMinX (), getMinY (), getMaxX (), getMaxY () - world coordinates of the leftmost, highest, rightmost and lowest point of the object. First, you need to work correctly rectangular selection (to select an object, you need to capture it entirely), and secondly, they are used in the default implementation of the method internalDrawSelection () to draw a selection of an object at its corners.
- final int minX (), minY (), maxX (), maxY () is the same, but already translated into screen coordinates (not redefinable methods).
Drawing selection
And finally, another important functionality implemented at the DiagramObject level that can be redefined in its successors is the selection drawing, that is, a graphic label by which the user can understand that the object is in the selected state. By default, these are four blue square dots in the corners of the object:
private static final int L = 4; protected void internalDrawSelection(Graphics canvas, int dX, int dY) { canvas.setColor(Color.BLUE); canvas.setXORMode(Color.WHITE); canvas.fillRect(minX() + dX - L, minY() + dY - L, L, L); canvas.fillRect(maxX() + dX, minY() + dY - L, L, L); canvas.fillRect(minX() + dX - L, maxY() + dY, L, L); canvas.fillRect(maxX() + dX, maxY() + dY, L, L); canvas.setPaintMode(); } Pay attention to the integer (and therefore, in screen coordinates) parameters dX, dY and to the setXORMode () call that switches the rendering context to “XOR mode”: in this mode, to erase the previously drawn image, just draw it again . , Drag&Drop : , «» , , , dX, dY :
, internalDrawSelection DiagramObject, ( drag&drop) - .
* * *
, DrawObject. DiagramPanel, , , drag&drop. , , https://github.com/inponomarev/graphexample Maven.
Source: https://habr.com/ru/post/303794/
All Articles