Oracle cloud services for IT monitoring
Oracle cloud services for IT monitoring
Oracle's new cloud services for IT monitoring provide effective monitoring of the performance of business applications in real time and allow you to answer a number of questions: how quickly web pages open, what errors occur, what is their cause. The monitoring platform also makes it possible to efficiently find the causes of various problems through the analysis of log files and ensure the planning of IT landscape resources: measure the load on databases and application servers, evaluate and predict the actual use of CPU, I / O, memory resources.

')
In January 2016, Oracle introduced a group of new services under the general title Management Cloud, including Application Performance Monitoring, Log Analytics and IT Analytics. First of all, they are intended for the service of operating the IT infrastructure, application administrators, IT architects, IT managers. Of course, users have a question: what about our Enterprise Manager - a unified platform for monitoring and managing IT infrastructure? The fact is that Enterprise Manager is certainly a very powerful system, an indispensable tool in monitoring individual components, such as a database, server, software and hardware, etc. But when it comes to localizing a problem, finding it in a business application consisting of many components, from a variety of databases, from a variety of application servers that are installed on different physical and virtual servers, specialized tools are needed. By the way, it is important to understand that Oracle Management Cloud tools work in the Oracle Public Cloud, but in close integration with the local Enterprise Manager.
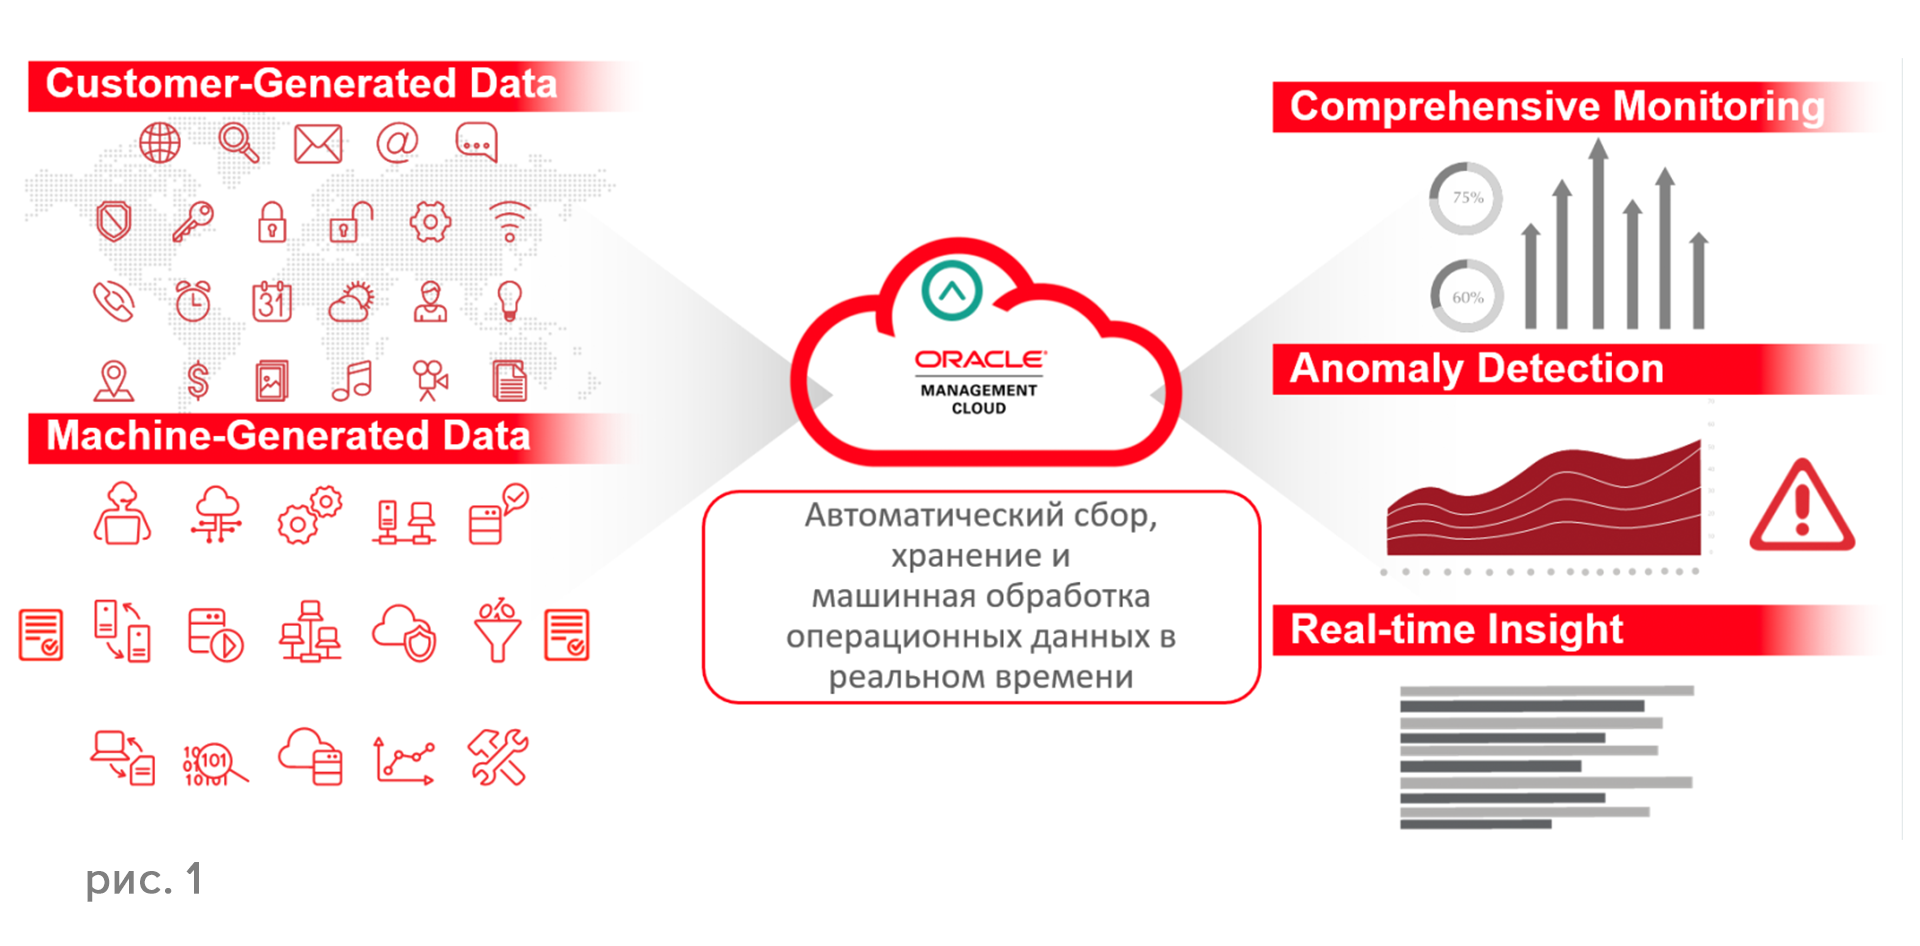
Key features of Oracle Management Cloud tools: monitoring of web applications at the end-user level and infrastructure components, assistance in capacity planning and resources for IT organizations, analysis of metrics and events, aggregation of log data, automated detection of anomalies and root causes of incidents. The source data for the monitoring tools are log files, user-generated data, machine data, trace files, performance metrics, diagnostic data from the EM repository, trace data, audit logs, etc. (Figure 1).
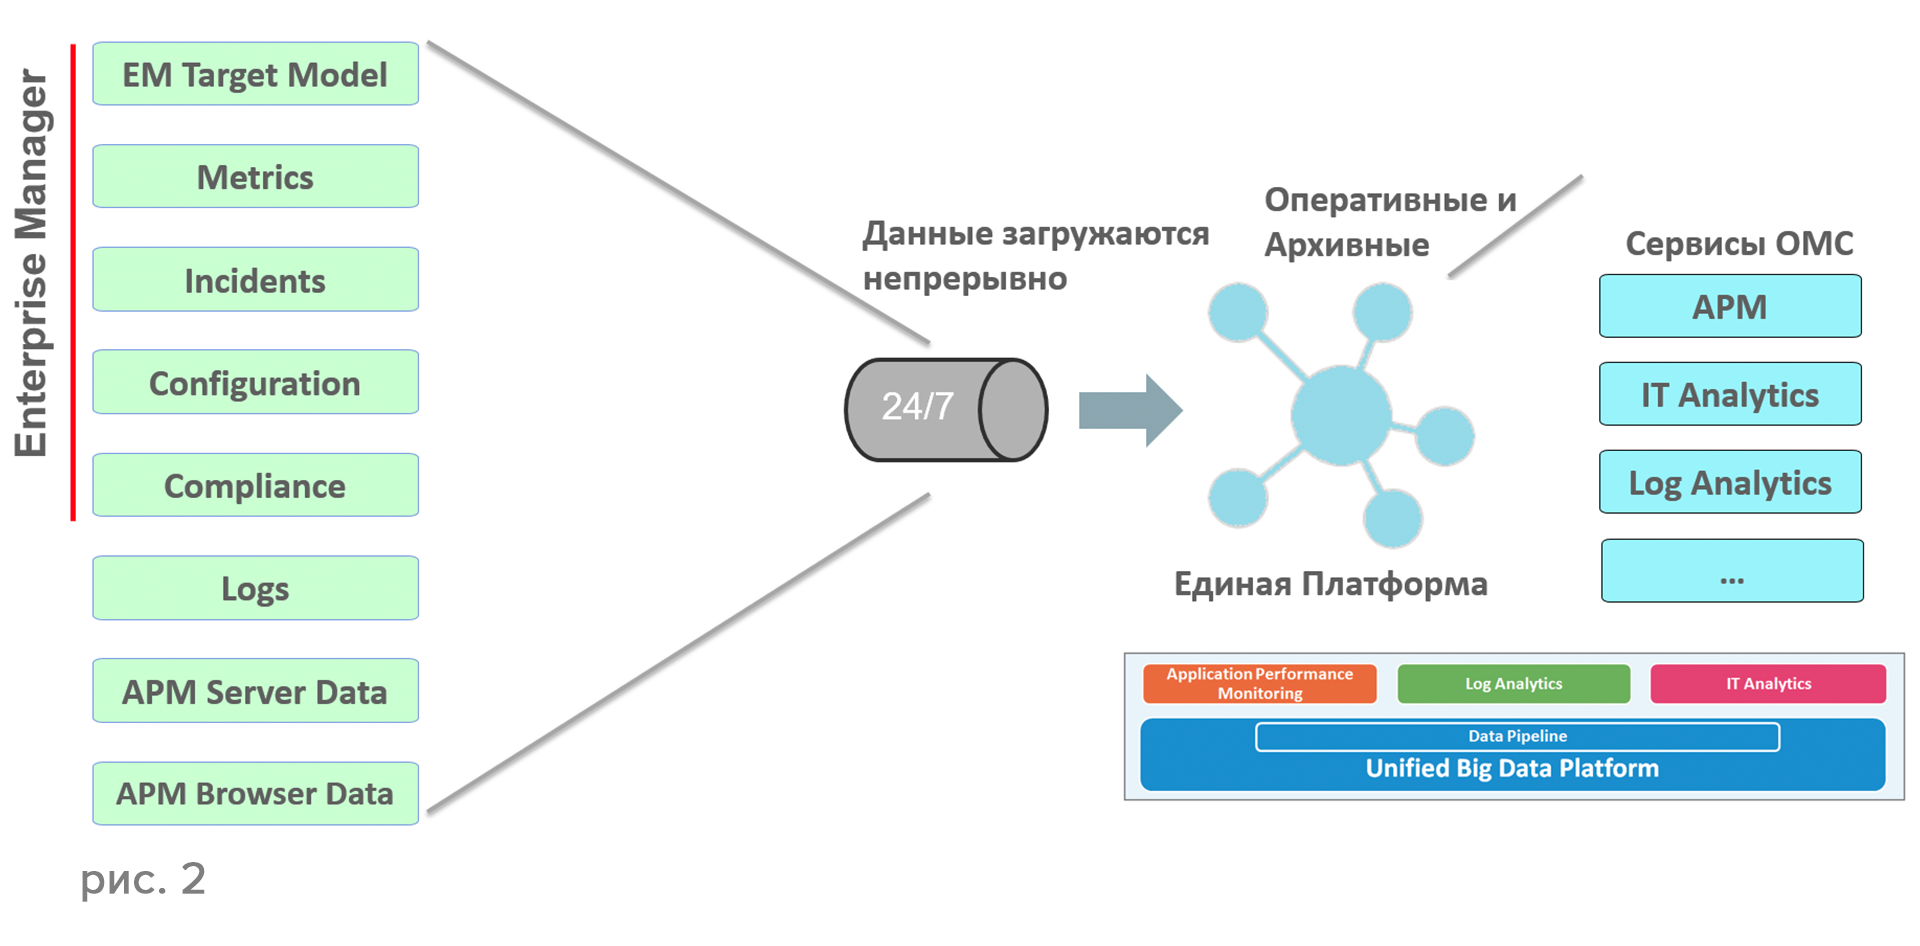
An important data source for Oracle Management Cloud is the Enterprise Manager repository data (Figure 2).
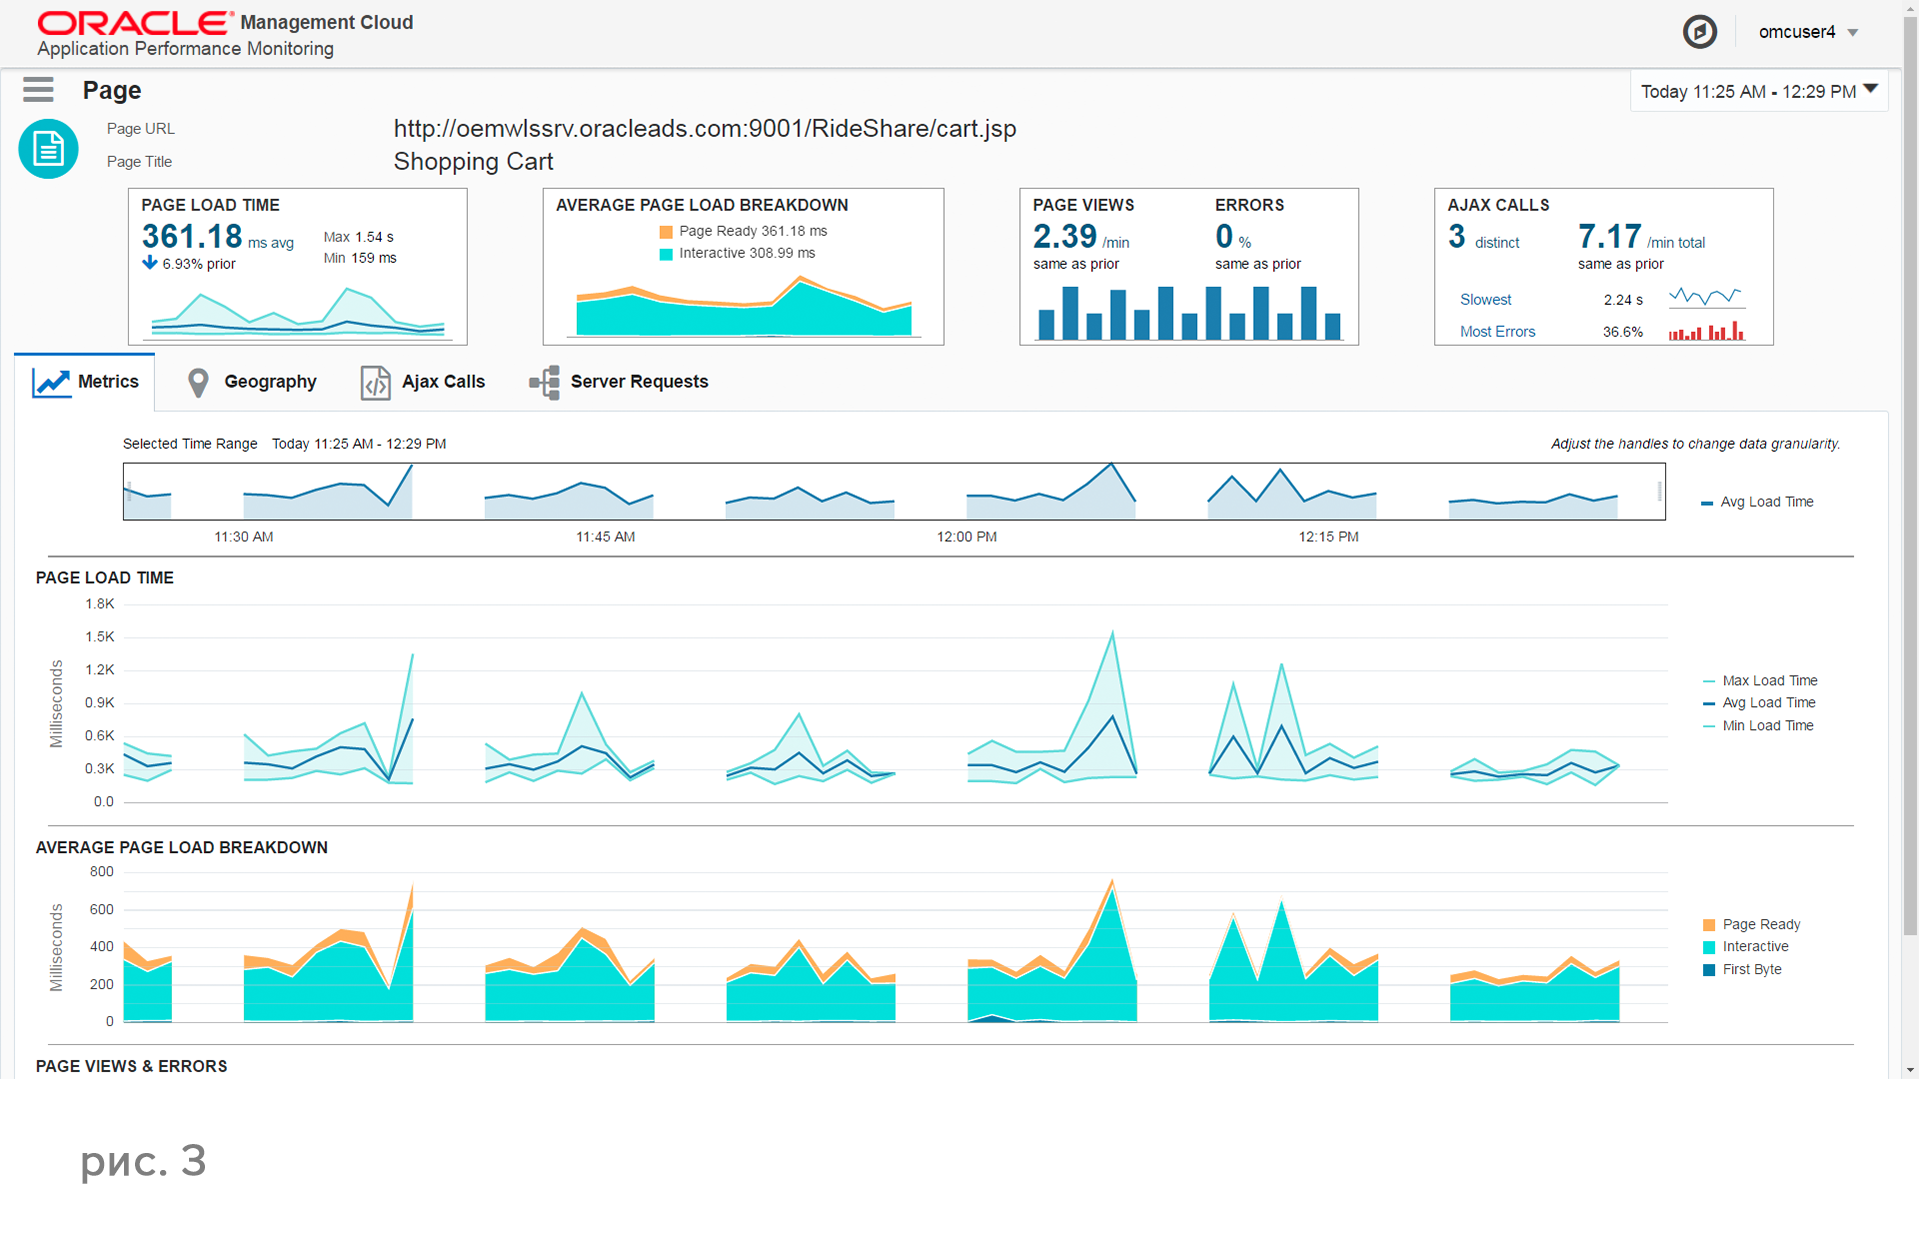
The Application Performance Monitoring service (Figure 3) is designed to monitor web applications built on Oracle WebLogic or Apache Tomcat. APM's objectives are to “profile” a web application at various levels: from the end user to the infrastructure, help in finding the root causes of incidents, providing a single interface for the maintenance service and developers, and, of course, proactively monitoring the experience of the end users; The Application Performance Monitoring service allows you to determine how the end user interacts with your web application. At the same time, APM allows performing contextual downward analysis of application performance from the user level, visualizing interaction of application modules and, if necessary, switching to the “lower” level in order to analyze possible related infrastructure problems.
Operational Services and developers have a single source of information in the face of Application Performance Monitoring for real-life performance diagnostics down to the code and SQL query level. Developers get access to valuable diagnostic data and work in conjunction with the maintenance service - they complement each other, this ensures quick problem resolution, and the quality of maintenance (DevOps) is improved.
The Application Performance Monitoring service is based on the code instrumentation method (a similar technology is used, for example, in the Oracle DBMS). Special agents tool the application and webpage code by measuring performance and transferring metrics to the public cloud through a proxy server in safe mode.
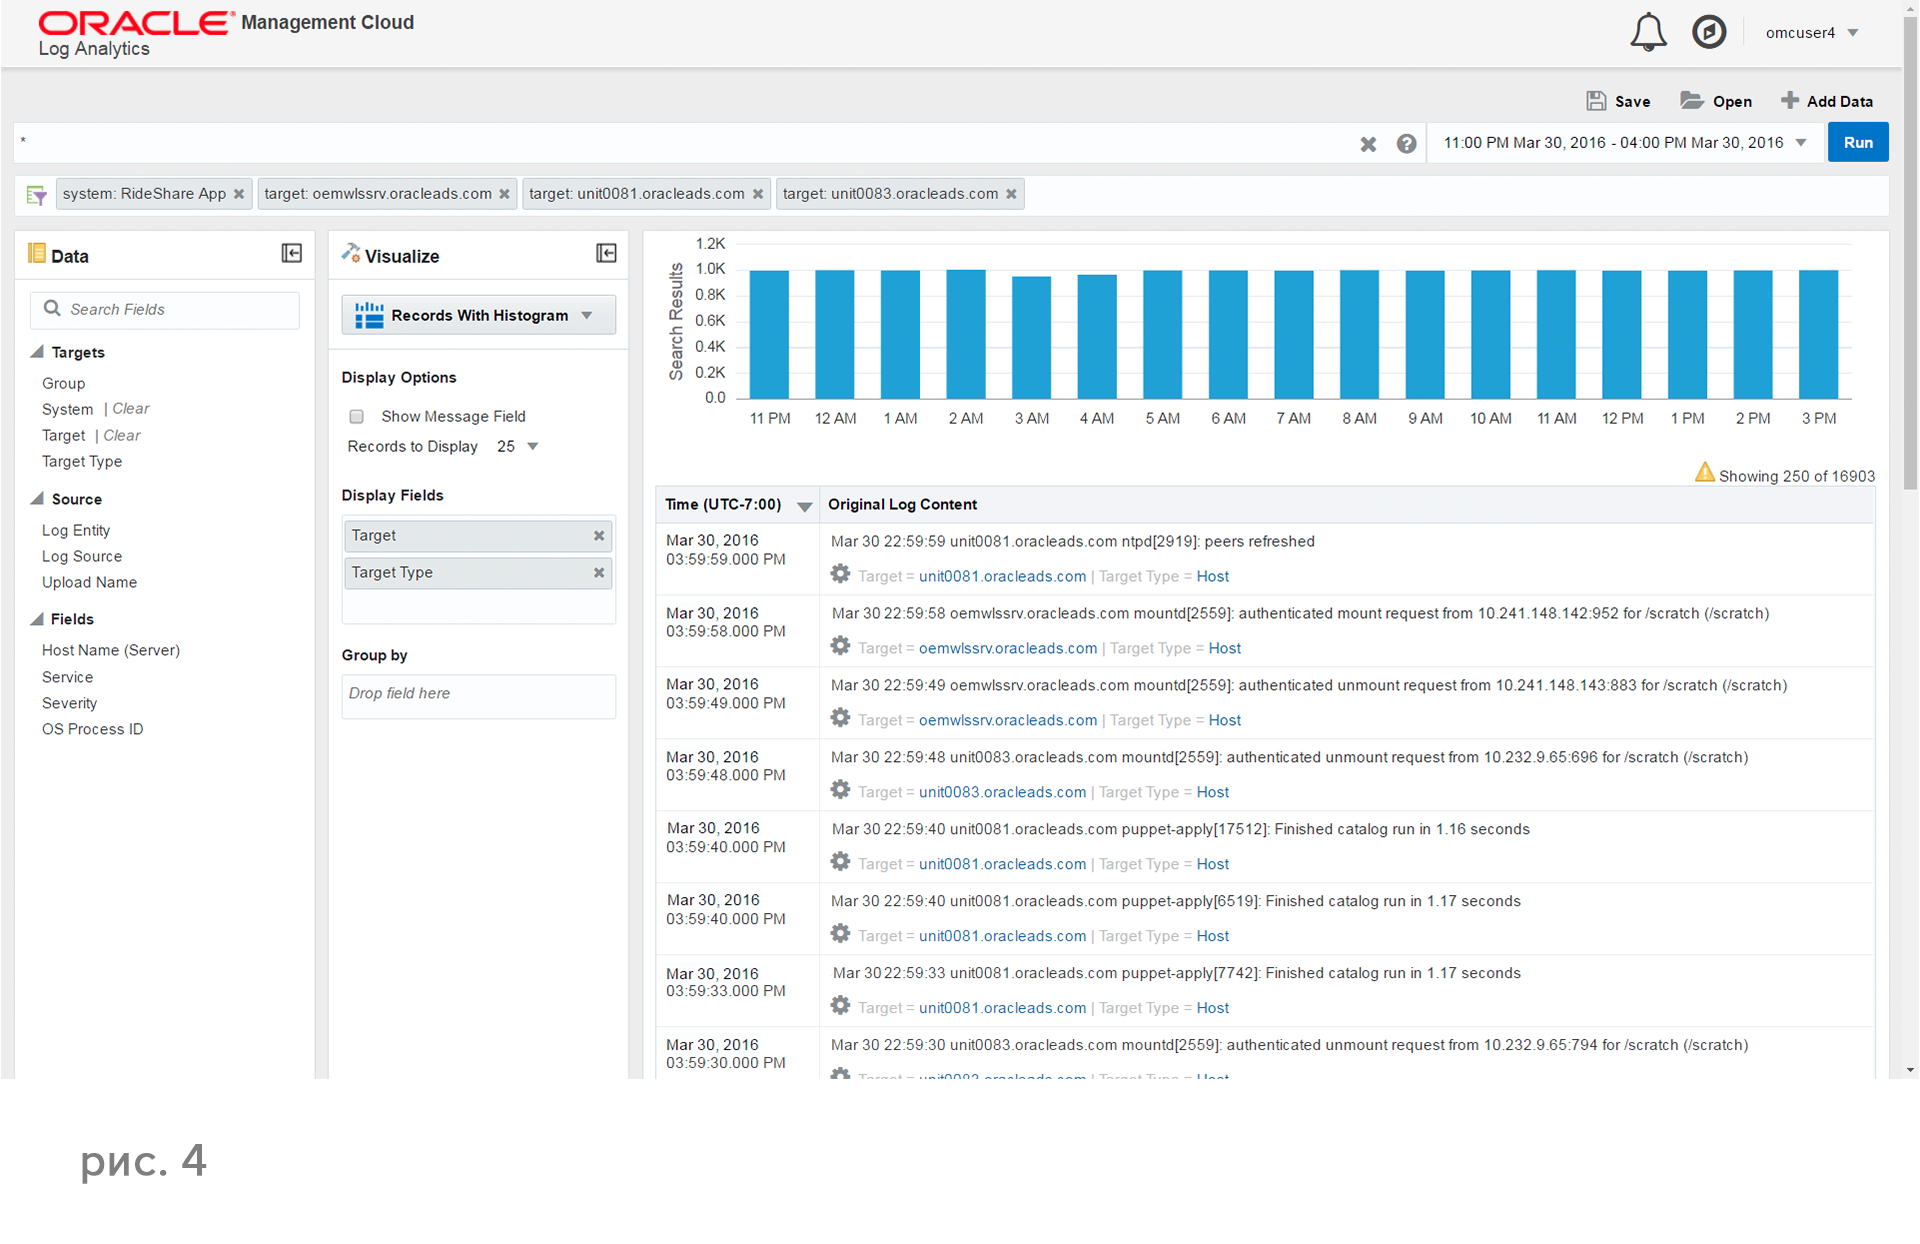
The Log Analytics tool (Figure 4) can work in conjunction with Application Performance Monitoring. It is this service that directly works with journal files - it deals with the search, collection, storage of data from journals, analysis and research of information in journals and visualization.
The advantage of Log Analytics is that it does not depend on the infrastructure components or on the log file formats. The out-of-box service supports about 30 log file formats — database logs, Enterprise Manager, FMW, web servers, cluster software, Linux operating systems, schedulers, etc. To support a non-standard log file, you need to write a simple parser, based on regular expression language
Using machine analysis algorithms, Log Analytics can, from the thousands of ordinary messages that have accumulated in your log files, for example, in the last 24 hours, reveal several valuable error messages - the very errors that are possibly the root cause of the incident. After detecting a problem, the menu “Show 1 Minute context” appears - that is, the display of the system context a minute before the error message and a minute later.
The entire infrastructure of the Log Analytics service is located in the Public Cloud. The user is provided with a convenient Web-interface, standard information panels that visualize key events recorded in journal files through various types of diagrams, and you can also create widgets — your own information panels.
Log Analytics collects data from log files in real time, indexes and stores in the Public Cloud on the high-performance Big Data – platform, which allows you to efficiently work with huge amounts of journal data, perform sorting, searching, grouping, machine analysis.
Finally, Log Analytics integrates seamlessly with Application Performance Monitoring. The “Drilldown to Log” button allows you to “fall through” from the code level to the level of a specific, related infrastructure element.
Business needs tools to understand the current IT landscape, capacity planning, identify problem areas, etc. The existing systems do not solve these problems, since they focus on specific components of the IT landscape, such as a database or middleware, and do not allow to establish how the systems operate on a data center scale - for a certain period of time, in terms of applications, cost center systems, etc.
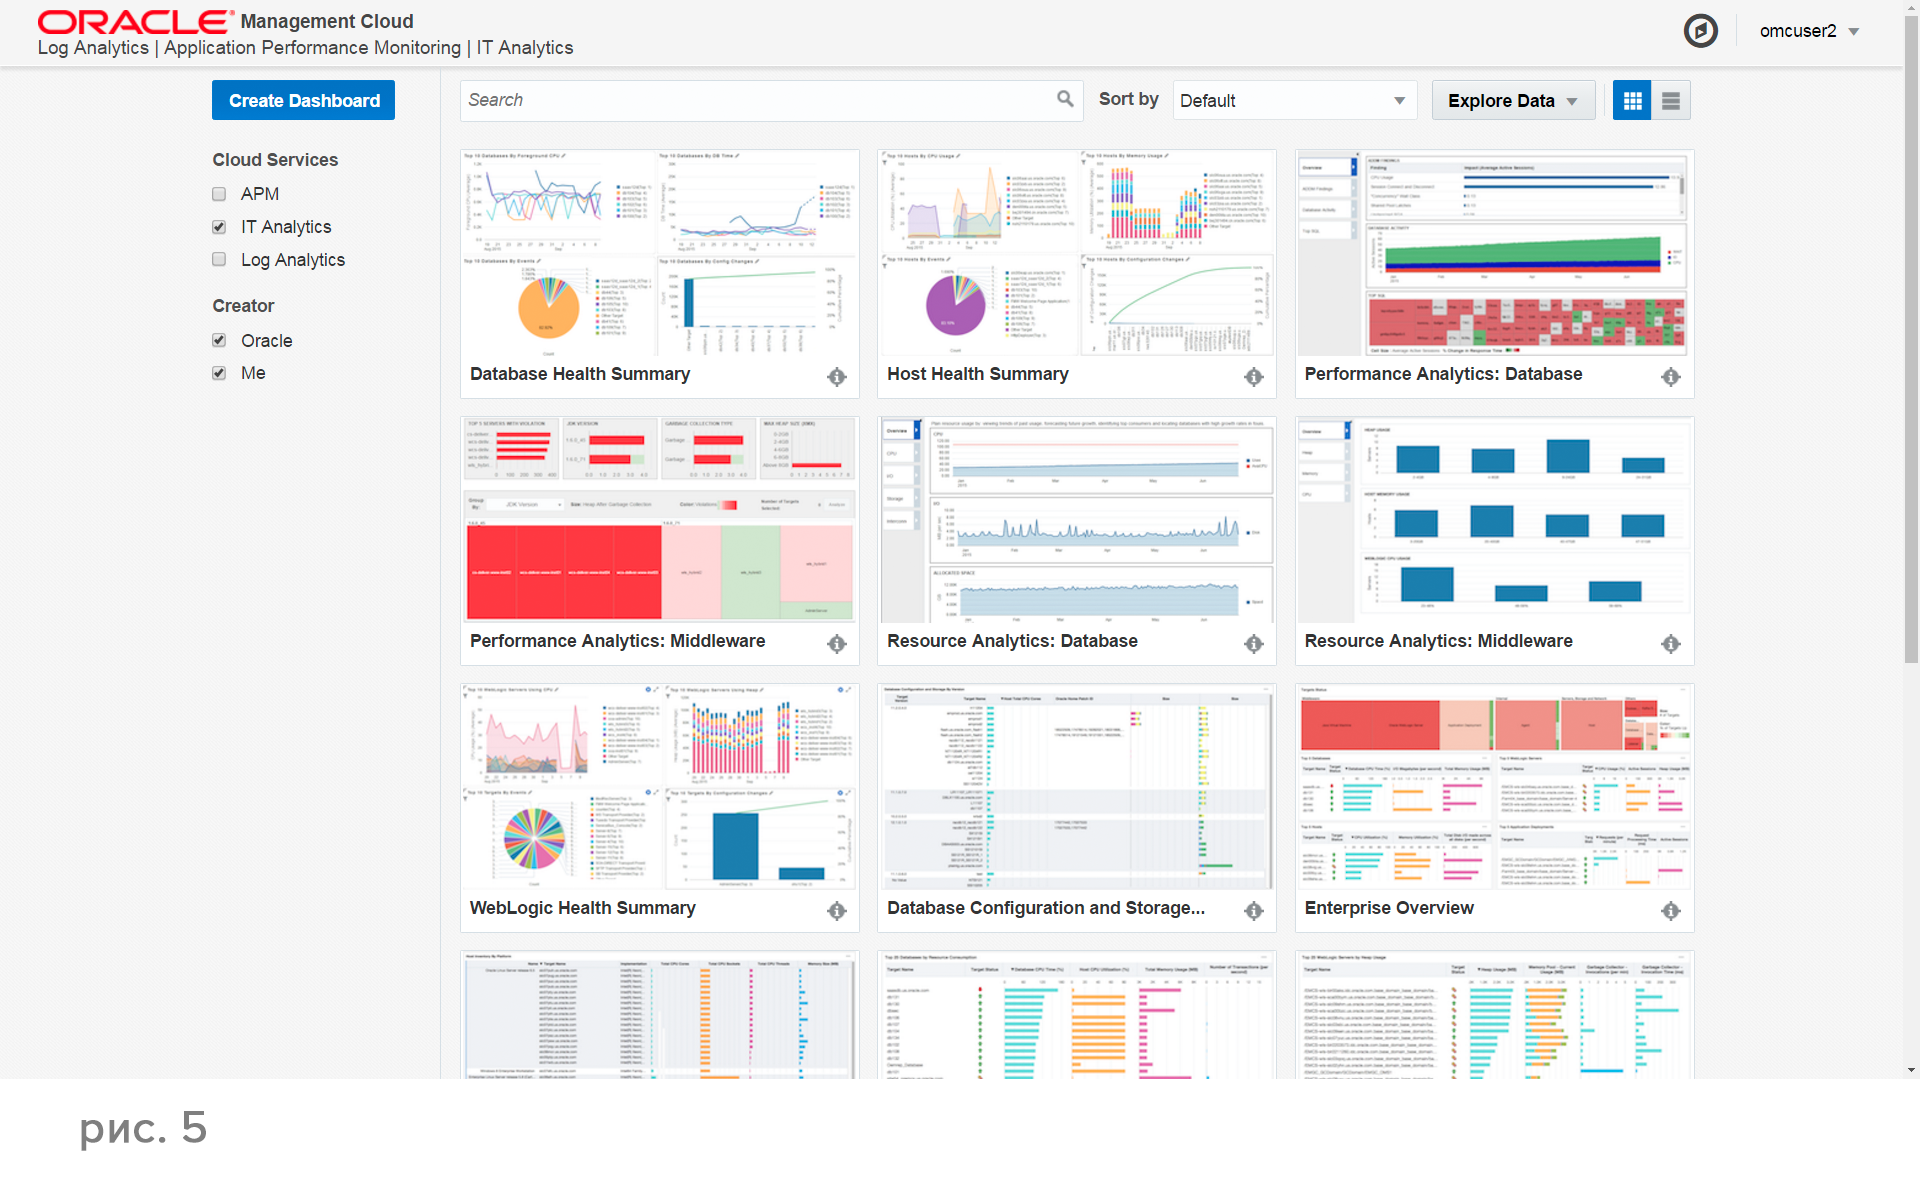
Therefore, another important part of the Oracle Management Cloud services suite is IT Analytics (Figure 5). Its scope is the analysis of the current IT landscape. The tasks he performs are: analysis of resource utilization, recognition of systematic performance problems, and resource planning. The objectives of the analysis of IT resources are to identify problem areas, compare loads for different periods, identify the maximum resource consumption for various measurements, optimize resources and plan growth through load prediction.
The service also allows performance analysis based on various criteria, such as process resources, I / O, memory, data storage volumes, middleware performance, Garbage Collector performance. Data visualization capabilities allow you to simplify the search by various criteria, visualize KPIs by key components for analyzing current usage and trends, and also use information panels. For example: Show a graph of total CPU utilization for business critical databases version 12.1.0.2 for the last 3 months.
The result of using the aforementioned business opportunities is a proactive approach to monitoring and planning (improving resource utilization through identifying underloaded or overloaded nodes), reducing operating costs (costs of analyzing and identifying problems) and helping in IT transformation (transition to a proactive approach and strategic planning). ).
* * *
Once again, both Oracle Enterprise Manager is not a replacement for Oracle Management Cloud, and Oracle Management Cloud is in no way a replacement for Enterprise Manager. The Oracle Management Cloud services and your locally installed Enterprise Manager work together. Consolidation and visualization of data from the Enterprise Manager repository and various metrics collected by Oracle Management Cloud agents provides very interesting opportunities - a proactive approach to problem solving, timely, business-oriented monitoring, and improved interaction between developers and the operations service (DevOps).
Oracle Management Cloud is a set of services in the Public Cloud offered by subscription, which means that the customer does not need to invest and maintain an expensive, complex infrastructure for monitoring tools. All that is required: install agents and set up data transfer to the Cloud. It must be emphasized that Oracle Management Cloud services do not collect or transmit business data or personal data from the database to the Cloud! Only diagnostic information, metrics, and log data are collected and analyzed, which, if necessary, can be “masked” before being sent to the Cloud.
Oracle Management Cloud is actively developing, in addition to the Application Performance Monitoring services described in this article, Log Analytics and IT Analytics, new services will appear. And most importantly, various IT service teams, such as developers and operation services, will be able to find a common language and work effectively!
Oracle's new cloud services for IT monitoring provide effective monitoring of the performance of business applications in real time and allow you to answer a number of questions: how quickly web pages open, what errors occur, what is their cause. The monitoring platform also makes it possible to efficiently find the causes of various problems through the analysis of log files and ensure the planning of IT landscape resources: measure the load on databases and application servers, evaluate and predict the actual use of CPU, I / O, memory resources.
')
In January 2016, Oracle introduced a group of new services under the general title Management Cloud, including Application Performance Monitoring, Log Analytics and IT Analytics. First of all, they are intended for the service of operating the IT infrastructure, application administrators, IT architects, IT managers. Of course, users have a question: what about our Enterprise Manager - a unified platform for monitoring and managing IT infrastructure? The fact is that Enterprise Manager is certainly a very powerful system, an indispensable tool in monitoring individual components, such as a database, server, software and hardware, etc. But when it comes to localizing a problem, finding it in a business application consisting of many components, from a variety of databases, from a variety of application servers that are installed on different physical and virtual servers, specialized tools are needed. By the way, it is important to understand that Oracle Management Cloud tools work in the Oracle Public Cloud, but in close integration with the local Enterprise Manager.
Key features of Oracle Management Cloud tools: monitoring of web applications at the end-user level and infrastructure components, assistance in capacity planning and resources for IT organizations, analysis of metrics and events, aggregation of log data, automated detection of anomalies and root causes of incidents. The source data for the monitoring tools are log files, user-generated data, machine data, trace files, performance metrics, diagnostic data from the EM repository, trace data, audit logs, etc. (Figure 1).
An important data source for Oracle Management Cloud is the Enterprise Manager repository data (Figure 2).
Application Performance Monitoring (APM)
The Application Performance Monitoring service (Figure 3) is designed to monitor web applications built on Oracle WebLogic or Apache Tomcat. APM's objectives are to “profile” a web application at various levels: from the end user to the infrastructure, help in finding the root causes of incidents, providing a single interface for the maintenance service and developers, and, of course, proactively monitoring the experience of the end users; The Application Performance Monitoring service allows you to determine how the end user interacts with your web application. At the same time, APM allows performing contextual downward analysis of application performance from the user level, visualizing interaction of application modules and, if necessary, switching to the “lower” level in order to analyze possible related infrastructure problems.
Operational Services and developers have a single source of information in the face of Application Performance Monitoring for real-life performance diagnostics down to the code and SQL query level. Developers get access to valuable diagnostic data and work in conjunction with the maintenance service - they complement each other, this ensures quick problem resolution, and the quality of maintenance (DevOps) is improved.
The Application Performance Monitoring service is based on the code instrumentation method (a similar technology is used, for example, in the Oracle DBMS). Special agents tool the application and webpage code by measuring performance and transferring metrics to the public cloud through a proxy server in safe mode.
Log analytics
The Log Analytics tool (Figure 4) can work in conjunction with Application Performance Monitoring. It is this service that directly works with journal files - it deals with the search, collection, storage of data from journals, analysis and research of information in journals and visualization.
The advantage of Log Analytics is that it does not depend on the infrastructure components or on the log file formats. The out-of-box service supports about 30 log file formats — database logs, Enterprise Manager, FMW, web servers, cluster software, Linux operating systems, schedulers, etc. To support a non-standard log file, you need to write a simple parser, based on regular expression language
Using machine analysis algorithms, Log Analytics can, from the thousands of ordinary messages that have accumulated in your log files, for example, in the last 24 hours, reveal several valuable error messages - the very errors that are possibly the root cause of the incident. After detecting a problem, the menu “Show 1 Minute context” appears - that is, the display of the system context a minute before the error message and a minute later.
The entire infrastructure of the Log Analytics service is located in the Public Cloud. The user is provided with a convenient Web-interface, standard information panels that visualize key events recorded in journal files through various types of diagrams, and you can also create widgets — your own information panels.
Log Analytics collects data from log files in real time, indexes and stores in the Public Cloud on the high-performance Big Data – platform, which allows you to efficiently work with huge amounts of journal data, perform sorting, searching, grouping, machine analysis.
Finally, Log Analytics integrates seamlessly with Application Performance Monitoring. The “Drilldown to Log” button allows you to “fall through” from the code level to the level of a specific, related infrastructure element.
IT Analytics
Business needs tools to understand the current IT landscape, capacity planning, identify problem areas, etc. The existing systems do not solve these problems, since they focus on specific components of the IT landscape, such as a database or middleware, and do not allow to establish how the systems operate on a data center scale - for a certain period of time, in terms of applications, cost center systems, etc.
Therefore, another important part of the Oracle Management Cloud services suite is IT Analytics (Figure 5). Its scope is the analysis of the current IT landscape. The tasks he performs are: analysis of resource utilization, recognition of systematic performance problems, and resource planning. The objectives of the analysis of IT resources are to identify problem areas, compare loads for different periods, identify the maximum resource consumption for various measurements, optimize resources and plan growth through load prediction.
The service also allows performance analysis based on various criteria, such as process resources, I / O, memory, data storage volumes, middleware performance, Garbage Collector performance. Data visualization capabilities allow you to simplify the search by various criteria, visualize KPIs by key components for analyzing current usage and trends, and also use information panels. For example: Show a graph of total CPU utilization for business critical databases version 12.1.0.2 for the last 3 months.
The result of using the aforementioned business opportunities is a proactive approach to monitoring and planning (improving resource utilization through identifying underloaded or overloaded nodes), reducing operating costs (costs of analyzing and identifying problems) and helping in IT transformation (transition to a proactive approach and strategic planning). ).
* * *
Once again, both Oracle Enterprise Manager is not a replacement for Oracle Management Cloud, and Oracle Management Cloud is in no way a replacement for Enterprise Manager. The Oracle Management Cloud services and your locally installed Enterprise Manager work together. Consolidation and visualization of data from the Enterprise Manager repository and various metrics collected by Oracle Management Cloud agents provides very interesting opportunities - a proactive approach to problem solving, timely, business-oriented monitoring, and improved interaction between developers and the operations service (DevOps).
Oracle Management Cloud is a set of services in the Public Cloud offered by subscription, which means that the customer does not need to invest and maintain an expensive, complex infrastructure for monitoring tools. All that is required: install agents and set up data transfer to the Cloud. It must be emphasized that Oracle Management Cloud services do not collect or transmit business data or personal data from the database to the Cloud! Only diagnostic information, metrics, and log data are collected and analyzed, which, if necessary, can be “masked” before being sent to the Cloud.
Oracle Management Cloud is actively developing, in addition to the Application Performance Monitoring services described in this article, Log Analytics and IT Analytics, new services will appear. And most importantly, various IT service teams, such as developers and operation services, will be able to find a common language and work effectively!
Source: https://habr.com/ru/post/303692/
All Articles