Intuit has accelerated the site almost 5 times and increased conversion by 20%

This is the second case from the series “How to speed up the site correctly, and what it gives.” We published the full list of cases here . In this case, it is instructive how the development team negotiated with other business units to really speed up the site.
Intuit company produces business software in the field of finance and accounting. The first version of the company's website was released in 1996, then constantly modified. The developers and standards of the Web have changed, the site has become overlaid with various patches and additional code. In 2012, the company's website began to load awfully long - 15 seconds.
')
The development team was tasked with reducing by 50% the load time of the top 50 pages on 6 different company sites.
A typical web page was as follows:
- Total volume: 1.5-2 MB
- Images: 50-70 + pieces, volume about 1.2 MB
- External CSS / JS: 30-40 +
- Javascript size: more than 400 KB
- 30x redirects: more than 20
- HTTP requests: more than 120
Starting from scratch
CSS / JS
One of the basic rules for speeding up site loading is “minimize http requests”.
It turned out to be not so easy to do, because the sites used a lot of images and CSS / JS files. Many files were used on other sites of the company, some styles were written inside the pages and not highlighted in files. There were global variables and Javascript functions.
The team conducted a global CSS / JS purge, optimized walkthroughs in the DOM document tree, created a global stylesheet and script file that was used on all sites. Several of the same files were created that were used only on certain sites.
As a result, requests related to CSS / JS, reduced by 10 times (from 30-40 to 3-4).
Work with images
The main part of the work was to combine images (sprites) to reduce the number of http requests.
The design used images with transparency (24-bit PNG files). For example, the sprite shown below was 306 KB.

The team worked with the designers, persuaded them to abandon the transparency in the images and switch to using the JPG format. This allowed us to save 250 KB on this sprite (saving more than 6 times).
However, the sprite technique did not always help. The example below shows a collection of images for a page with a screenshot gallery. Each screenshot is 102x768 in size. The overall image size is 5 MB. Sprites should be used deliberately!
CDN
Company sites have already used Akamai. In some places there were problems with the configuration, files were downloaded sometimes from the CDN, and sometimes from their servers. All sites used the same CDN domain images.smallbusiness.intuit.com.
Cookies were transmitted with each http request to this domain. Average cookie size: 0.8-1 KB. Multiply by more than 100 requests per page, we find that about 100 KB of traffic was spent only on cookies.
The problem was solved by reconfiguring Akamai. All static files began to be loaded from the CDN, switched to using the CDN domain without cookies.
Tracking tags
20-30 different tracking tags (pixels) were used on the site.
The site team worked with marketers, all tracking tags were checked for the need for their presence, many were refused. Those tags that were left were replaced with their latest actual version to improve performance.
As a result, from 20-30 their number was reduced to 8-10.
Other types of optimization
- All images not used in sprites are checked for optimal compression.
- Images located below the first visible part of the page were loaded later, asynchronously.
- No longer use all non-standard fonts.
- Removed duplicate code.
- Removed 30x redirects.
The total duration of all work on optimization was 6 months.
Result: optimized pages began to load in 6 seconds instead of 15.
Better than good
Then the company management began to ask questions: is it possible to further accelerate the loading of pages. The team of optimizers faced an unusual problem, since they had already done the main optimization steps at the previous stage.
The team analyzed all other possible bottlenecks and identified the following sources of boot problems:
- Software responsible for A / B testing.
- Problem video player.
- Slow header site.
- Javascript: an obvious possibility of its further optimization.
A / V Testing Software

As you can see in the above picture, there was a series of blocking calls on the page: each next waits for the completion of the previous one and does not start without it. Any such call went to the server responsible for testing, and the server has already determined whether this user should “get” to a particular A / B test, if yes - then other content was shown to him in a certain place. Many users did not fall into any test.
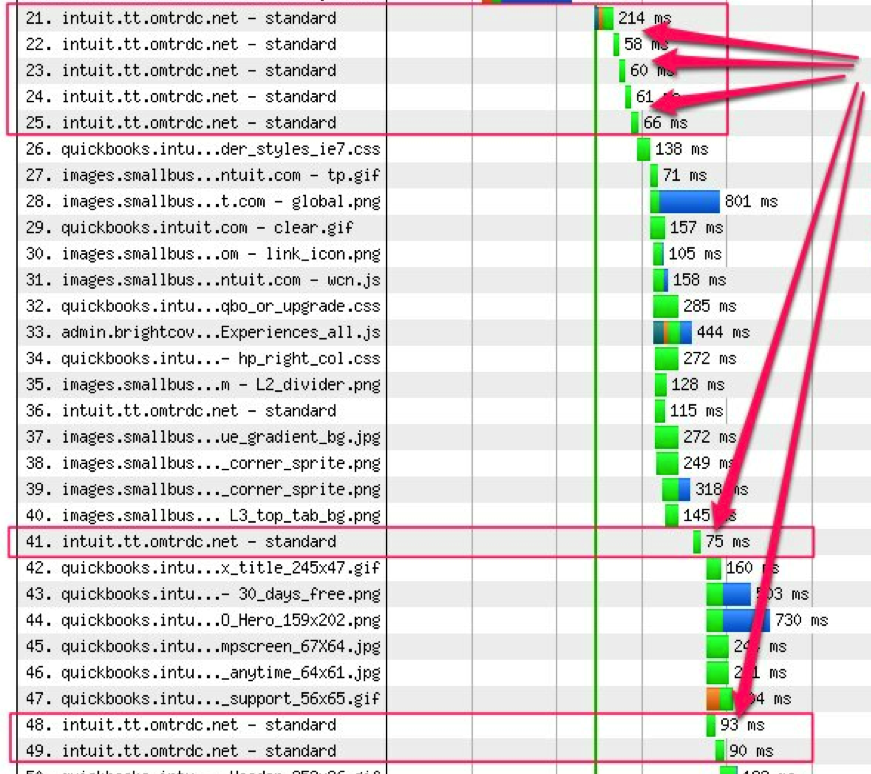
These requests in total gave about 750 milliseconds. That is, 3/4 seconds (out of 6), so that in most cases nothing can be done for the user.
Another problem with the A / B tests was their logic:
- All users downloaded default content
- If the user falls into the category of those on whom the A / B test is being conducted, he also downloaded the test content, which he saw on the screen instead of the default content.
The architecture of the A / V tests was flawed.
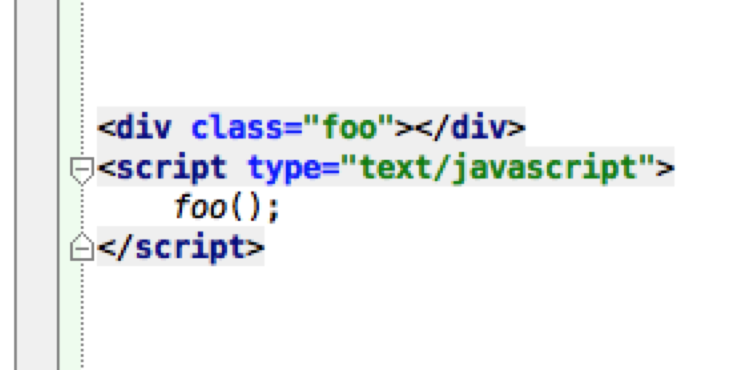
The content on the page was organized as follows: a container div with the name of the class, behind which was located the Javascript code that accessed the testing server for the desired content.
If the testing server determined that this user is participating in the A / V test, and sent other content, then the code looked for the desired div in the DOM and inserted the modified content into it. Each such code had to go through the entire DOM, find the div in front of it and insert other content into it.
What was finally done:
- Removed code associated with already completed tests.
- Commented inactive while tests
- Switched to other software for A / V testing
Video player
The video player, as it turned out, not only plays the video, but also adds problems. Here is what the video player download on the page looks like:
- SWF-file (the player itself) is loaded in 6-8 seconds
- Many external calls to various analytical services: 23 requests, 9 domains, 7 SWF files
- A static picture that the player shows until the user has clicked on the playback takes more than 3 seconds to download.
- Until the static image is loaded, the page is blocked and other elements are not loaded.
Solution: replaced 3 different video players on the pages with one, the other vendor.
Recommendation: if for some reason you cannot switch to another video player, at least use the “lazyload” technique.
General cap and menu
The problems were very significant, considering that the header was loaded on ALL pages of all sites:
- 2 calls for A / B testing
- Sprites instead of CSS
- Javascript in mouseover events
- Hundreds of event listeners
- Over 1100 DOM Elements
The team created a special blank page where only the menu header was loaded: this page was loaded for 5 seconds.
As a result, the team completely rewrote navigation using HTML / CSS / JS standards, minimized the use of images and DOM passes, and used event delegation.
As a result, each page began to load 1-1.5 seconds faster.
Using the Control.js library
This library is written by Steve Sanders, and helps developers control how Javascript is loaded and executed.
When the script is loaded through the usual <script> tag.
The team used Control.js on some pages, but not on all sites. It turned out that it is not easy to manage the code that was tracking the
onload . Another reason is that not all developers know this technique, and there are difficulties in writing TK for third-party developers.Preloading resources
Preloading was used on pages related to conversions of various types, when it is known in advance what the next page will be, where the user will go.
While the user is idle, or enters his data into the form, the resources of the next page are loaded in the background. When the user gets to the next page, its resources are already in the cache, which allows you to display the page very quickly.
The team also optimized a number of other points: rewrote a lot of Javascript code, increased the use of lazy load, changed the infrastructure somewhere and moved to a faster stack.
Final results
- In February 2012, a typical “weighed” page was 1.2 MB and loaded for 15 seconds.
- At the end of the optimization process in April 2013, the typical page weighed 400 KB and loaded in 3.6 seconds.
Visually, the pages were almost the same.

Impact on business
The team notes that it is rather difficult to measure the impact of this whole process, because it lasted more than a year. During this time, the company introduced many other changes: in offers, tariff plans, products.
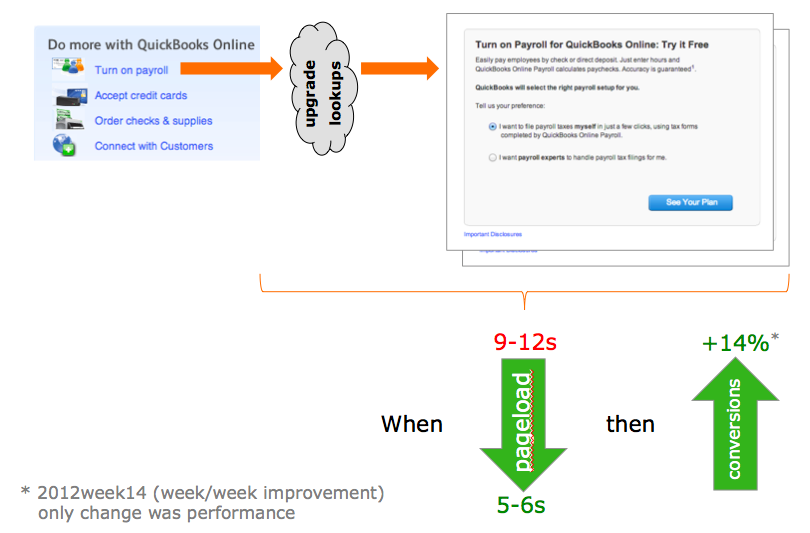
However, in specific isolated time periods when the only change was a change in download speed, improvements in conversion were recorded.
For example, at the 14th week of 2012, when the only change was to speed up the page load from 9-12 seconds to 5-6 seconds, conversions increased by 14%.
How speed affects conversion
The team’s impact on conversion has been reduced to the following final formula. Each decrease in page load time by 1 second gives the following effect:
- If the page loads in 7 seconds or more: + 3% for each second of acceleration
- If the page loads from 5 to 7 seconds: + 2% per second
- If the page loads in less than 5 seconds: + 1%.
Note: it is important to remember that these are the results of 2013. Since then, 5 seconds of page load has become quite a long time.
Source: https://habr.com/ru/post/303408/
All Articles