Russia's place in the global digital transformation
At the end of May, the 8th International Business Forum “Wireless Russia Forum: 4G, 5G & Beyond - The Evolution of Mobile and Fixed Wireless Networks” was held in Moscow. There were several reports from Huawei. In this article, you can read the report of the senior marketing manager Alexander Prokhorov, who is dedicated to the global digital economy research based on the Huawei Global Connectivity Index.
Today, it is clear that digital technologies are changing the global economy. The Internet is actively developing. At the end of 2015, the number of Internet users in the world reached 40% of the world's population. In 2017, Internet traffic will exceed traffic for all previous years. More than a billion people have already made purchases based on e-commerce services. World B2C e-commerce has reached $ 1.7 trillion, and by 2018 it will grow to 2.35 trillion.
The introduction of digital technologies (mobile broadband access, cloud technologies, the Internet of Things) affects almost all human activities and all vertical industries in the country, allows you to build a more successful economy, to ensure a new quality of life for the population. However, it is not at all obvious how to quantitatively link the country's macroeconomic parameters with the level of development of digital technologies. What technologies have more influence on economic growth? What technologies should be invested in the first place? How to assess the position of the country in terms of the development of digital technologies in comparison with other countries? Who should be equal to? Answers to all these questions are needed by any specialist involved in the planning of ICT resources, and first and foremost to those determining a national ICT development strategy.
Huawei provides answers to the above questions in its large-scale analytical study of the Global Connectivity Index, which, with a focus on statistics in Russia, is described in this article.
In 2016, the study was conducted for the third time, despite the fact that its scale increases every year (Fig. 1). This year, the level of development of information and communication technologies in the 50 largest countries was analyzed, and the analysis was carried out on 40 parameters.
')
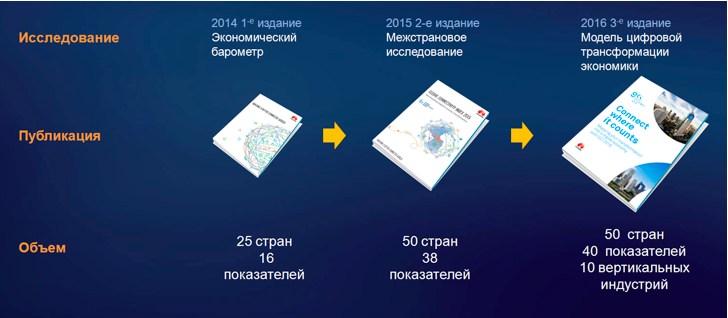
Figure 1. Scope of the Huawei GCI study
Before proceeding to the description of the methodology for determining the GCI index, let us try to answer the following question: “What parameters can provide a comparative analysis of the level of development of information and communication technologies in the country?”.
Often, speaking about the level of development of information and communication technologies, they use such parameters as the IT market or the ICT market in the country.
Obviously, an important parameter is the level of investment in IT technology. But does such a single parameter allow us to talk about the level of technology development in the country? Let us turn, for example, to the graph (Fig. 2) presented by IDC, which indicates a high correlation between the indicators of the price of oil and the size of the Russian IT market. As can be seen from the figure, over the past three years, the IT market in Russia in dollar terms fell to the 2009 level.
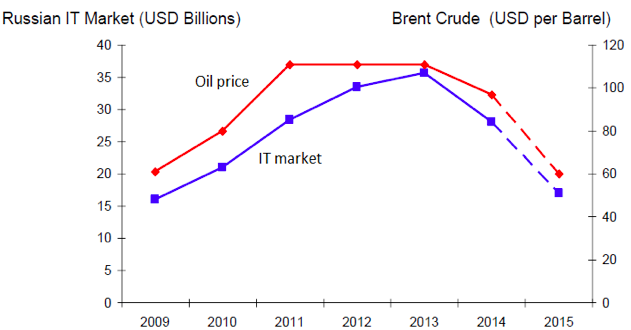
Figure 2. Dynamics of the IT market in Russia amid changes in oil prices (source: IDC, December 2015)
What does this mean? Is it possible to say that Russia, according to the state of informatization, has rolled back to the level of 2009? In terms of market volume, yes. But in terms of technology development - no. Informatization continued: the number of Internet users grew, the structure and maturity of the market changed. More funds were spent on solutions in the field of cloud technologies, mobile solutions, analysis of "big data". That is, even an adequately measured indicator of the volume of the IT market or ICT market does not reflect the level of development of informatization in the country.
What parameters should be chosen, in addition to the level of IT or ICT costs, in order to compare different countries and industries by the level of digital technologies?
Huawei has developed its integrated GCI, which, as shown in Figure 3, consists of two groups of parameters.
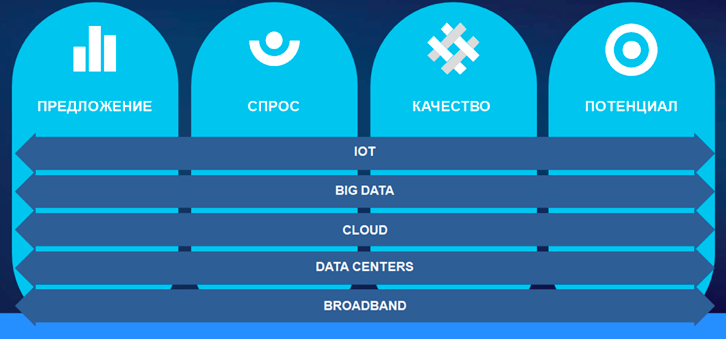
Figure 3. The GCI index is based on two groups of parameters.
The first group is conventionally called “performance parameters” - supply, demand, quality and potential (shown on the vertical panels in Fig. 3), the second group (technological parameters for ensuring transformation) is shown on the horizontal arrows.
Let us consider in more detail what these parameters are.
Perhaps you should comment on the question, why is there a pair of "performance" and "demand"? Imagine the situation that the state spends money, buys equipment, reports on implementation, and nobody uses these information systems because they do not work or work poorly. The money is invested, the service on paper is built, and in fact the service operates much less.
One can judge about the parameters on which the category “Offer” depends on Figure 4 on the example of Russia.

Figure 4. Indicators of Russia in the category “Proposal” against the background of average values for the studied countries
The category “Proposal” is based on 10 parameters, including the degree of 4G coverage in a country, the width of a cross-border channel (which is measured as the sum of the bandwidth of all traffic exchange points in a country offering international bandwidth), the spread of Fiber to the Home connections (fiber to at home), measured in relation to the total number of households in the country, investments in the Internet of Things (IoT), etc. The values for Russia are marked by a light band, and the average for the countries studied is a dark band.
As can be seen from Figure 4, there are categories where Russia lags behind the average, and there are those where it is ahead. For example, we are ahead of many countries in the distribution of the Fiber to the Home technology, and in terms of the specific investment in ICT, we are far behind the world average. And for example, in terms of specific investments in telecommunications, Russia is approximately at the global level.
As we noted, in addition to supply, it is also important to assess demand. The “Demand” category (Fig. 5) determines the demand for infocommunication products and services and is also based on 10 parameters, including the level of application downloads, the degree of computerization of households, etc.
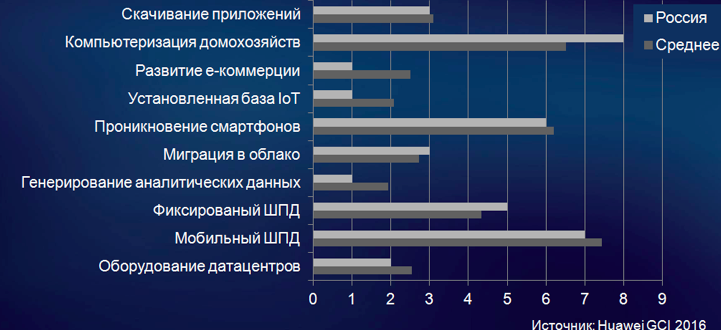
Figure 5. Indicators of Russia in the category “Demand” against the background of average values for the studied countries
The next parameter is the “Quality” category, it determines the level of availability of services for users and also consists of 10 categories, including the quality of “big data” services, telecom services, etc. (see Fig. 6).
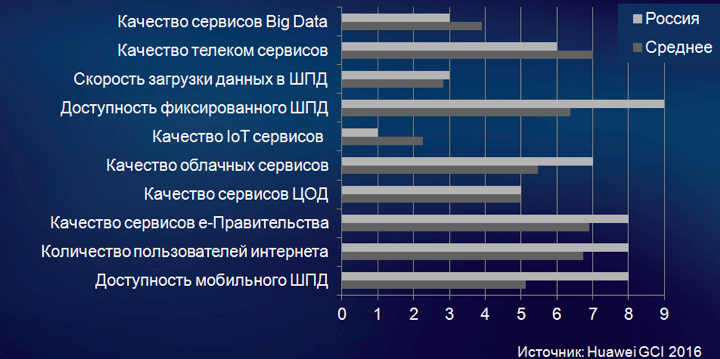
Figure 6. Indicators of Russia in the category “Quality of services” against the background of average values for the studied countries
As can be seen from Figure 6, in five parameters, including the availability of fixed broadband access and the quality of cloud services, Russia is significantly ahead of the average, but in terms of the quality of telecom services and the quality of big data services, it is slightly inferior to the average.
Next, we consider which parameters are included in the “Potential” category, using the indicators of Russia as an example (Fig. 7).
Potential assesses the prospects for the development of the digital economy in the country, is based on local research on what economic benefits and what contribution to the development of the market are given by new technologies, and is associated with indicators such as research costs, availability and accessibility of IT staff.
It is interesting to note that at the cost of research work (R & D), comparable to the average world, the number of patents in the ICT area in Russia is almost 3 times less than the world average.
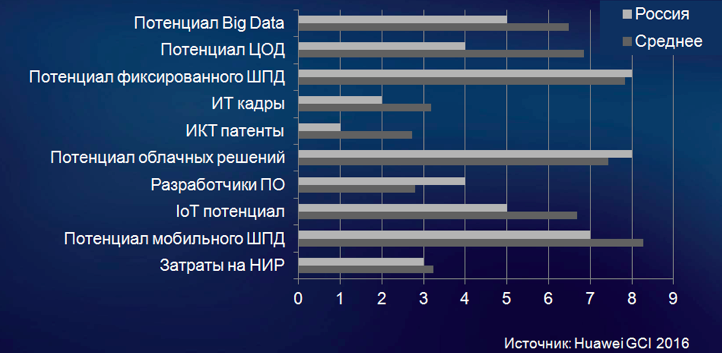
Figure 7. Indicators of Russia in the “Potential” category against the background of average values for the studied countries
As noted in Figure 3, the model proposed in the project allows data to be presented both vertically and horizontally, that is, according to the degree of implementation / development of the so-called transformation technologies, which include broadband access, data centers, cloud technologies, big data technologies and the Internet of Things technology.
This data presentation is implemented in Figure 8. As follows from the figure, Russia is ahead of the world average in the development of broadband access and cloud technologies, we are lagging behind in terms of IoT and “big data”, and in the category “Data center development” we are at the level of averages.
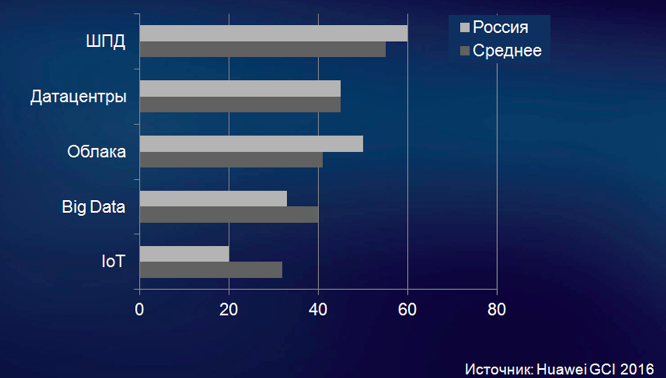
Figure 8. Implementation of transformational IT technologies in Russia against the background of average values for the studied countries
Based on the above parameters (Fig. 3–8), the GCI is calculated for each country. In Figure 9, we presented data for 7 countries.
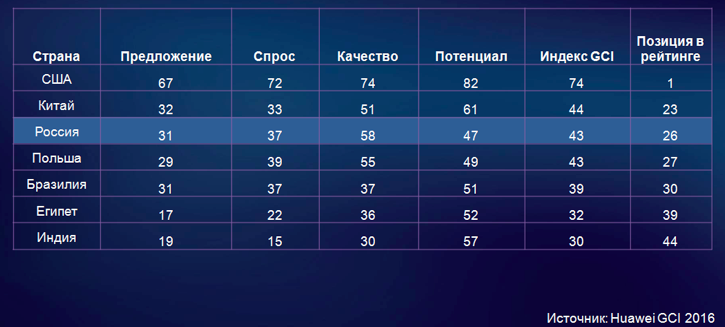
Figure 9. Comparative position of Russia in the Huawei ranking on the GCI index
As follows from Figure 9, in the BRICS group, Russia has a good position: Russia is slightly inferior to China and is ahead of Brazil and India. However, in this group it is obvious that in terms of the “Potential” parameter of the Russian Federation, it lags behind both China and Brazil. This is explained by the current crisis situation and unfavorable forecasts for the growth of the Russian economy in the short term in the context of low oil prices and sanctions from Western countries.
Of particular interest is the analysis of the distribution of the studied countries in the coordinates “nominal GDP per capita” (ordinate) and “GCI” (plotted on the abscissa), shown in Figure 10.
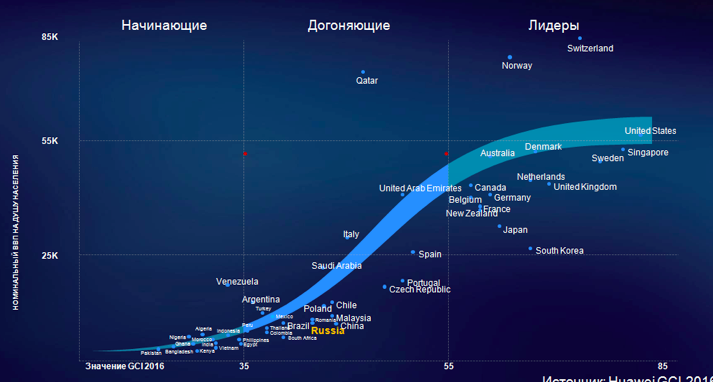
Figure 10. The distribution of the studied countries in the coordinates of "nominal GDP per capita" and GCI
As you can see, this distribution fits on a smooth curve. Conventionally, countries are divided into three categories: “beginners” (with a GCI level of less than 35), “catching up” (with a GCI level of 35 to 55) and “leaders” (with a GCI level of more than 55). In the first section (such countries as Pakistan, India, Vietnam, Indonesia got here), the derivative of the above function is small, that is, GDP growth with GCI growth is low, and the difference in the GDP value of countries at the lower and upper GCI borders in this category is insignificant. The second category is the so-called catching countries. Here Russia and such countries as China, Brazil, Poland get. Here, as can be seen from the figure, the derivative of the curve, which reflects the change in GDP with increasing GCI, reaches a maximum. That is, for example, the GDP levels of Brazil and Italy differ by several times, while the difference in the GCI indices of these countries is relatively small. It should be noted that Russia falls into the category of catching-up countries, where investments in ICT can bring the most tangible increase in the level of GDP. The following is the category of countries "Leaders". In it, the derivative falls again. And this is understandable: in the “Leaders” category, economic development processes driven by informatization come to saturation, and the increment in the development of information technologies does not add much to the growth of the economies of these countries.
It is interesting to dwell on one more figure, showing that the countries from the three different categories outlined in Figure 10 have different strategies for the development of ICT technologies (Fig. 11).
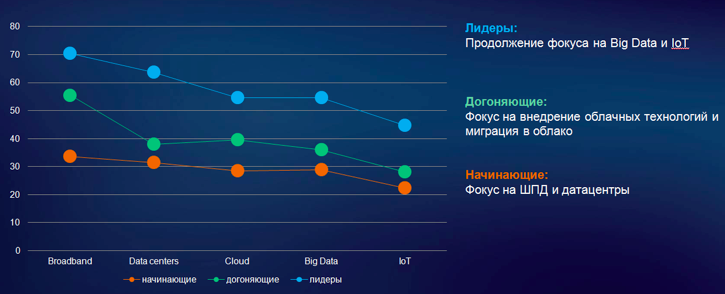
Figure 11. Country position by GCI dictates ICT development strategy
“Beginners” are countries that are in the early stages of building an ICT infrastructure, and their attention is focused on increasing audience access to digital technologies. They mainly focus on the development of broadband access and data centers.
“Catching up” - in this group, as we have already noted, there is the largest increase in GDP with the GCI increment. The attention of the countries of this group is focused on increasing ICT demand in order to facilitate the digital transformation process and related economic growth based on it. The focus of these countries is on the introduction of cloud technologies and migration to the cloud.
"Leaders" - these countries have developed economies. They constantly increase the quality of services and focus on “big data” technologies and IoT to create a more efficient society.
So far, we have talked about the GCI country index, but Huawei also estimated the industrial digital transformation ratio, which indicates the degree of implementation / development of the above-mentioned technologies in various industries. In Figure 12 it can be seen that in the first place is the category BFSI (Banking Financial Services and Insurance - banks, financial services and insurance), in second place is ICT. The top three also includes health care.
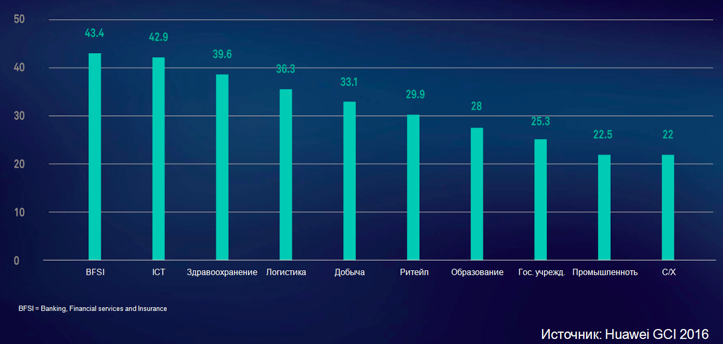
Figure 12. Industrial Digital Transformation Ratio
In conclusion, it should be noted that the Huawei study, in which one can find a lot of comparative information on the ICT market of fifty leading countries, is offered absolutely free of charge. More information about the research results is available at: www.huawei.com/minisite/gci/en .
Today, it is clear that digital technologies are changing the global economy. The Internet is actively developing. At the end of 2015, the number of Internet users in the world reached 40% of the world's population. In 2017, Internet traffic will exceed traffic for all previous years. More than a billion people have already made purchases based on e-commerce services. World B2C e-commerce has reached $ 1.7 trillion, and by 2018 it will grow to 2.35 trillion.
The introduction of digital technologies (mobile broadband access, cloud technologies, the Internet of Things) affects almost all human activities and all vertical industries in the country, allows you to build a more successful economy, to ensure a new quality of life for the population. However, it is not at all obvious how to quantitatively link the country's macroeconomic parameters with the level of development of digital technologies. What technologies have more influence on economic growth? What technologies should be invested in the first place? How to assess the position of the country in terms of the development of digital technologies in comparison with other countries? Who should be equal to? Answers to all these questions are needed by any specialist involved in the planning of ICT resources, and first and foremost to those determining a national ICT development strategy.
Huawei provides answers to the above questions in its large-scale analytical study of the Global Connectivity Index, which, with a focus on statistics in Russia, is described in this article.
In 2016, the study was conducted for the third time, despite the fact that its scale increases every year (Fig. 1). This year, the level of development of information and communication technologies in the 50 largest countries was analyzed, and the analysis was carried out on 40 parameters.
')
Figure 1. Scope of the Huawei GCI study
Before proceeding to the description of the methodology for determining the GCI index, let us try to answer the following question: “What parameters can provide a comparative analysis of the level of development of information and communication technologies in the country?”.
Often, speaking about the level of development of information and communication technologies, they use such parameters as the IT market or the ICT market in the country.
Obviously, an important parameter is the level of investment in IT technology. But does such a single parameter allow us to talk about the level of technology development in the country? Let us turn, for example, to the graph (Fig. 2) presented by IDC, which indicates a high correlation between the indicators of the price of oil and the size of the Russian IT market. As can be seen from the figure, over the past three years, the IT market in Russia in dollar terms fell to the 2009 level.
Figure 2. Dynamics of the IT market in Russia amid changes in oil prices (source: IDC, December 2015)
What does this mean? Is it possible to say that Russia, according to the state of informatization, has rolled back to the level of 2009? In terms of market volume, yes. But in terms of technology development - no. Informatization continued: the number of Internet users grew, the structure and maturity of the market changed. More funds were spent on solutions in the field of cloud technologies, mobile solutions, analysis of "big data". That is, even an adequately measured indicator of the volume of the IT market or ICT market does not reflect the level of development of informatization in the country.
What parameters should be chosen, in addition to the level of IT or ICT costs, in order to compare different countries and industries by the level of digital technologies?
Huawei has developed its integrated GCI, which, as shown in Figure 3, consists of two groups of parameters.
Figure 3. The GCI index is based on two groups of parameters.
The first group is conventionally called “performance parameters” - supply, demand, quality and potential (shown on the vertical panels in Fig. 3), the second group (technological parameters for ensuring transformation) is shown on the horizontal arrows.
Let us consider in more detail what these parameters are.
Perhaps you should comment on the question, why is there a pair of "performance" and "demand"? Imagine the situation that the state spends money, buys equipment, reports on implementation, and nobody uses these information systems because they do not work or work poorly. The money is invested, the service on paper is built, and in fact the service operates much less.
One can judge about the parameters on which the category “Offer” depends on Figure 4 on the example of Russia.
Figure 4. Indicators of Russia in the category “Proposal” against the background of average values for the studied countries
The category “Proposal” is based on 10 parameters, including the degree of 4G coverage in a country, the width of a cross-border channel (which is measured as the sum of the bandwidth of all traffic exchange points in a country offering international bandwidth), the spread of Fiber to the Home connections (fiber to at home), measured in relation to the total number of households in the country, investments in the Internet of Things (IoT), etc. The values for Russia are marked by a light band, and the average for the countries studied is a dark band.
As can be seen from Figure 4, there are categories where Russia lags behind the average, and there are those where it is ahead. For example, we are ahead of many countries in the distribution of the Fiber to the Home technology, and in terms of the specific investment in ICT, we are far behind the world average. And for example, in terms of specific investments in telecommunications, Russia is approximately at the global level.
As we noted, in addition to supply, it is also important to assess demand. The “Demand” category (Fig. 5) determines the demand for infocommunication products and services and is also based on 10 parameters, including the level of application downloads, the degree of computerization of households, etc.
Figure 5. Indicators of Russia in the category “Demand” against the background of average values for the studied countries
The next parameter is the “Quality” category, it determines the level of availability of services for users and also consists of 10 categories, including the quality of “big data” services, telecom services, etc. (see Fig. 6).
Figure 6. Indicators of Russia in the category “Quality of services” against the background of average values for the studied countries
As can be seen from Figure 6, in five parameters, including the availability of fixed broadband access and the quality of cloud services, Russia is significantly ahead of the average, but in terms of the quality of telecom services and the quality of big data services, it is slightly inferior to the average.
Next, we consider which parameters are included in the “Potential” category, using the indicators of Russia as an example (Fig. 7).
Potential assesses the prospects for the development of the digital economy in the country, is based on local research on what economic benefits and what contribution to the development of the market are given by new technologies, and is associated with indicators such as research costs, availability and accessibility of IT staff.
It is interesting to note that at the cost of research work (R & D), comparable to the average world, the number of patents in the ICT area in Russia is almost 3 times less than the world average.
Figure 7. Indicators of Russia in the “Potential” category against the background of average values for the studied countries
As noted in Figure 3, the model proposed in the project allows data to be presented both vertically and horizontally, that is, according to the degree of implementation / development of the so-called transformation technologies, which include broadband access, data centers, cloud technologies, big data technologies and the Internet of Things technology.
This data presentation is implemented in Figure 8. As follows from the figure, Russia is ahead of the world average in the development of broadband access and cloud technologies, we are lagging behind in terms of IoT and “big data”, and in the category “Data center development” we are at the level of averages.
Figure 8. Implementation of transformational IT technologies in Russia against the background of average values for the studied countries
Based on the above parameters (Fig. 3–8), the GCI is calculated for each country. In Figure 9, we presented data for 7 countries.
Figure 9. Comparative position of Russia in the Huawei ranking on the GCI index
As follows from Figure 9, in the BRICS group, Russia has a good position: Russia is slightly inferior to China and is ahead of Brazil and India. However, in this group it is obvious that in terms of the “Potential” parameter of the Russian Federation, it lags behind both China and Brazil. This is explained by the current crisis situation and unfavorable forecasts for the growth of the Russian economy in the short term in the context of low oil prices and sanctions from Western countries.
Of particular interest is the analysis of the distribution of the studied countries in the coordinates “nominal GDP per capita” (ordinate) and “GCI” (plotted on the abscissa), shown in Figure 10.
Figure 10. The distribution of the studied countries in the coordinates of "nominal GDP per capita" and GCI
As you can see, this distribution fits on a smooth curve. Conventionally, countries are divided into three categories: “beginners” (with a GCI level of less than 35), “catching up” (with a GCI level of 35 to 55) and “leaders” (with a GCI level of more than 55). In the first section (such countries as Pakistan, India, Vietnam, Indonesia got here), the derivative of the above function is small, that is, GDP growth with GCI growth is low, and the difference in the GDP value of countries at the lower and upper GCI borders in this category is insignificant. The second category is the so-called catching countries. Here Russia and such countries as China, Brazil, Poland get. Here, as can be seen from the figure, the derivative of the curve, which reflects the change in GDP with increasing GCI, reaches a maximum. That is, for example, the GDP levels of Brazil and Italy differ by several times, while the difference in the GCI indices of these countries is relatively small. It should be noted that Russia falls into the category of catching-up countries, where investments in ICT can bring the most tangible increase in the level of GDP. The following is the category of countries "Leaders". In it, the derivative falls again. And this is understandable: in the “Leaders” category, economic development processes driven by informatization come to saturation, and the increment in the development of information technologies does not add much to the growth of the economies of these countries.
It is interesting to dwell on one more figure, showing that the countries from the three different categories outlined in Figure 10 have different strategies for the development of ICT technologies (Fig. 11).
Figure 11. Country position by GCI dictates ICT development strategy
“Beginners” are countries that are in the early stages of building an ICT infrastructure, and their attention is focused on increasing audience access to digital technologies. They mainly focus on the development of broadband access and data centers.
“Catching up” - in this group, as we have already noted, there is the largest increase in GDP with the GCI increment. The attention of the countries of this group is focused on increasing ICT demand in order to facilitate the digital transformation process and related economic growth based on it. The focus of these countries is on the introduction of cloud technologies and migration to the cloud.
"Leaders" - these countries have developed economies. They constantly increase the quality of services and focus on “big data” technologies and IoT to create a more efficient society.
So far, we have talked about the GCI country index, but Huawei also estimated the industrial digital transformation ratio, which indicates the degree of implementation / development of the above-mentioned technologies in various industries. In Figure 12 it can be seen that in the first place is the category BFSI (Banking Financial Services and Insurance - banks, financial services and insurance), in second place is ICT. The top three also includes health care.
Figure 12. Industrial Digital Transformation Ratio
In conclusion, it should be noted that the Huawei study, in which one can find a lot of comparative information on the ICT market of fifty leading countries, is offered absolutely free of charge. More information about the research results is available at: www.huawei.com/minisite/gci/en .
Source: https://habr.com/ru/post/303358/
All Articles