World of Tanks: what does the win rate of tanks depend on?
Today we will talk about using the Wargaming API, build a lot of graphs and analyze what the winrate of tanks depends on. Just want to note that I am not a guru of World of Tanks, and if I am mistaken somewhere, please write in the comments. All graphics are clickable.
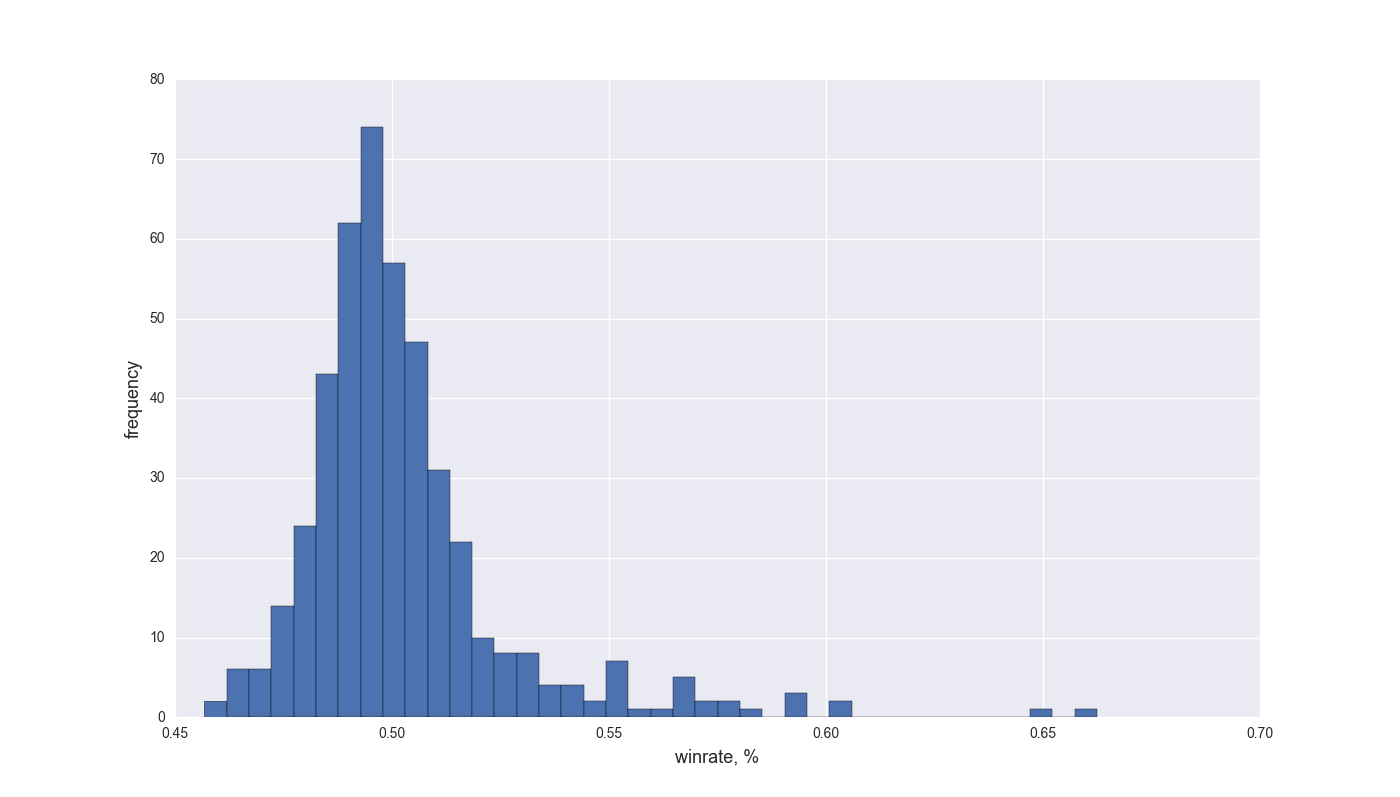
The winrate histogram across all tanks shows that the overall distribution is normal, but there is a tail to the right. Let's try to figure it out.
In the game World of Tanks, many players pay great attention to the statistics of their account, namely the win rate (winning percentage), personal rating, WN8, etc. For these parameters there are formulas that take into account a variety of characteristics. Basically, the player's win rate is affected by the average damage per battle, survival rate, average battle level and several other parameters. But what does the individual tank's win rate depend on? The most obvious option - from the players who play more on it. But today I want to analyze the parameters of the tanks, not including the average damage on the tank on the server and similar characteristics that we can not see from the hangar.
And so if you take a separate battle, then each team has 15 people, therefore, each player on average affects the outcome of the battle by 6.66%. If there were fewer players in the team, then they would become harder to balance, and so the influence of each is smoothed. The teams are formed by the matchmaker based on the weight of each tank so that the total difference between the weights of the teams is minimal. The weight of the tank depends on its level of battles and its class - heavy, medium, light, Fri or Fri-Sau. The generally accepted opinion in the game that all the results of the battles are reduced to an average of 49% of victories, the same number of defeats and 2% of draws.
It is clear that the more damage a player will inflict and the less he receives, the more chances to win, which means he can increase his win rate. This largely depends on the player and his experience, since even the coolest tank in the “wrong hands” will not benefit the team.
Data acquisition
To obtain data, you can use the public Wargaming API, which provides quite a lot of different information about players and equipment. Using the GET request with the account_id field at https://api.worldoftanks.ru/wot/account/tanks/ you can get information about the player’s equipment, namely the total number of battles and victories on each tank in json format. I did in the forehead: in a cycle from 0 to 40kk I tried to get data for all account_id. Python code snippet:
url_users = 'https://api.worldoftanks.ru/wot/account/tanks/' # Keep-Alive, session = requests.Session() def get_users_json(ids): # 100 id # application_id WG params = {'account_id': ids, 'application_id': 'demo'} while True: try: r = session.get(url_users, params) r_json = r.json() except: # # , time.sleep(1) continue if r.status_code == 200 and r_json['status'] == 'ok': return r_json['data'] Of course, you could use the module for multithreading or asynchrony, which would undoubtedly speed up the load. On my computer, the script worked for 2 days and downloaded data on 26 million users. Since I was leaving for the weekend, then 2 days of loading was not critical.
Then we can calculate the win rate for each tank (450 total), as well as get detailed specifications for the entire vehicle. Characteristics can be obtained by requesting https://api.worldoftanks.ru/wot/encyclopedia/vehicles/ , but the API does not tell us which modules are top modules for this tank. In the response of this method there is a field “modules_tree”, which contains a tree of research of the tank modules, therefore, passing on it, you can select top modules. By definition, it is the module of the highest level, and if there are several, then it is the most expensive for research. Now you can make a request for https://api.worldoftanks.ru/wot/encyclopedia/vehicleprofile/ by passing the id of the required modules. As a result, we obtain detailed data on 450 tanks.
Work with signs
For data analysis, I used the python library pandas. Load all the data in pandas.DataFrame, got 450 rows and 40 columns. List of all signs:
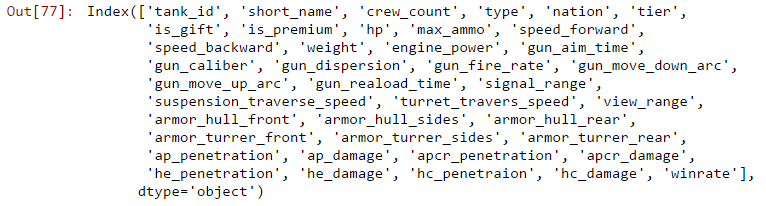
All features should be intuitive, except for ap_damage, apcr_damage, he_damge, hc_damage and the same with _penetration. This damage and armor penetration by different types of shells. The API returns information about the weapon as an array of objects that contain data about damage and armor penetration for a specific type of projectile. There are 4 types of them:
- ARMOR_PIERCING - armor-piercing shells
- ARMOR_PIERCING_CR - piercing shells
- HIGH_EXPLOSIVE - high-explosive fragmentation projectiles
- HOLLOW_CHARGE - cumulative shells
The API does not say which of the main shells, and which one is bought for gold, which complicates the analysis.
Creation and selection of signs
On the basis of the original data, you can get more informative features:
df['power'] = df.engine_power / (df.weight / 1000) # df['max_damage'] = df[['ap_damage', 'apcr_damage', 'he_damage', 'hc_damage']].max(axis=1) df['max_penetration'] = df[['ap_penetration', 'apcr_penetration', 'he_penetration', 'hc_penetraion']].max(axis=1) df['dpm'] = df['max_damage'] * df['gun_fire_rate'] # def get_armor(y): # , # , if y[1]: return np.mean(y[:2]) else: return y[0] df['armor'] = df[['armor_hull_front', 'armor_turrer_sides']].apply(get_armor, axis=1) Through trial and error (random forest) I selected the most significant features (but then we also look at two more interesting features):
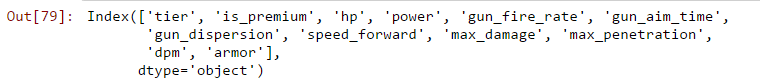
For those who did not play at WOT, here are displayed: tank level (from 1 to 10), premium tank or not, strength points, horsepower (horses / ton), rate of fire (shots / minute), speed of the gun (seconds) , instrument spread (meters), forward speed (km / h), maximum damage (hp), maximum armor penetration (mm), damage per minute (hp / min), armor (mm).
Normalization of symptoms
Before starting the analysis, you need to normalize some features. We want to get values that are independent of the level of the tank, so for each level we will normalize separately. In other words, let's make so that the average value of signs on the level was equal to 0. I carried out such normalization for maximum damage, maximum armor penetration, damage per minute, armor, strength and power.
Data analysis
Does the win rate depend on the nation of technology? It is logical to assume that no, because the developers are trying to balance this as much as possible. Let's build a graph. For plotting, I used the seaborn library:
sns.factorplot('nation','winrate', data=df_normalized,size=4,aspect=3) sns.plt.title('Winrate from nation') 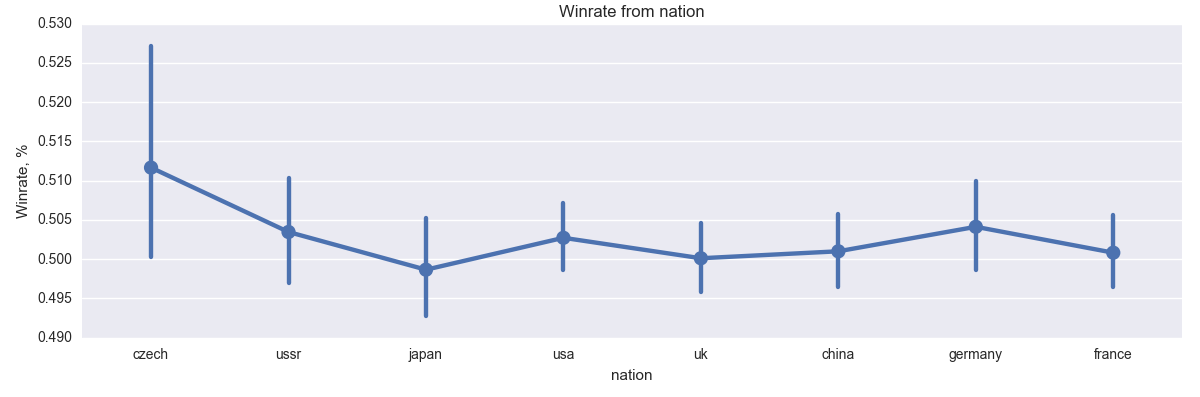
The Czech tanks immediately catch the eye - the average winrate is 51%, but the scatter is the biggest. This will be explained by the fact that the branch is relatively new and many players who have already pumped out everything they can, rushed to extort this branch as well. It is clear that such players are quite skilled, so the percentage of victories is above average. Also, not all who play against the Czechs know their weak points and areas of penetration. But over time, the value of the winrate is likely to equalize (and if not, the WG will ponerfit many tanks in the branch).
And what about the class of technology, which class "bends"? Construct a similar graph:
ax = sns.factorplot('type','winrate', data=df_normalized,size=5,aspect=3) sns.plt.title('Winrate from type') 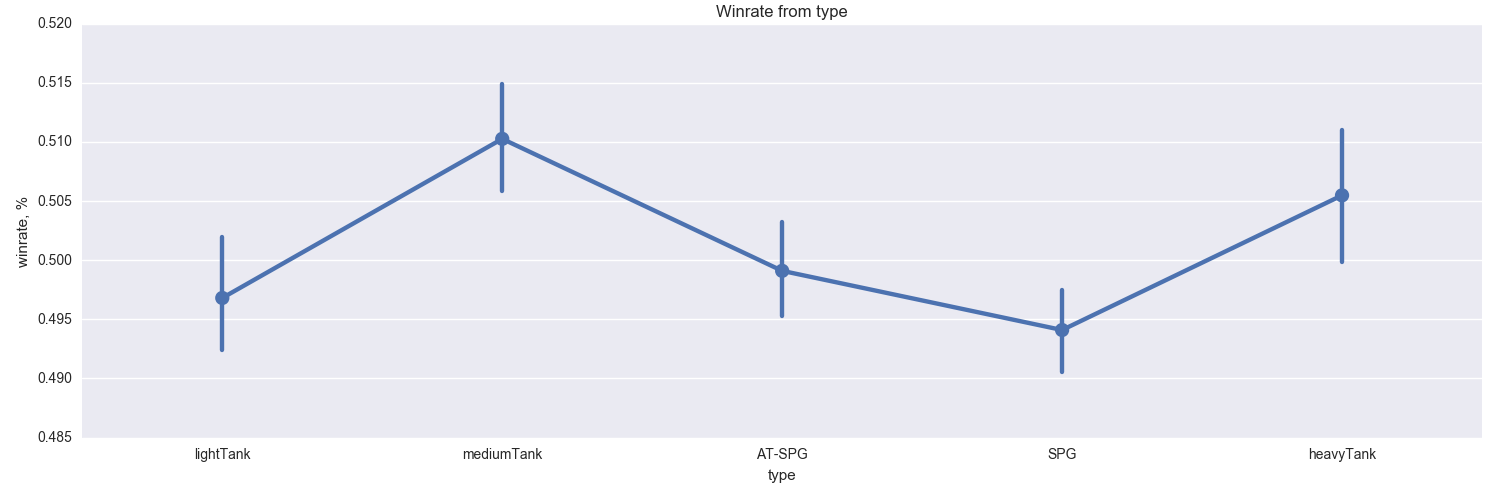
It is seen that the biggest chance to win on an average tank, and the smallest on light tanks and artillery. The fact that on light tanks such a value is understandable. Many players in this class, rushing headlong forward, immediately after the start of the battle, and naturally merge, without bringing particular benefit to the team. Art is generally a separate topic, which we will not discuss here.
Further, we will not talk about these two signs, since they do not contribute much to the random forest model.
Let's look at the correlation between the earlier signs and the winning percentage:
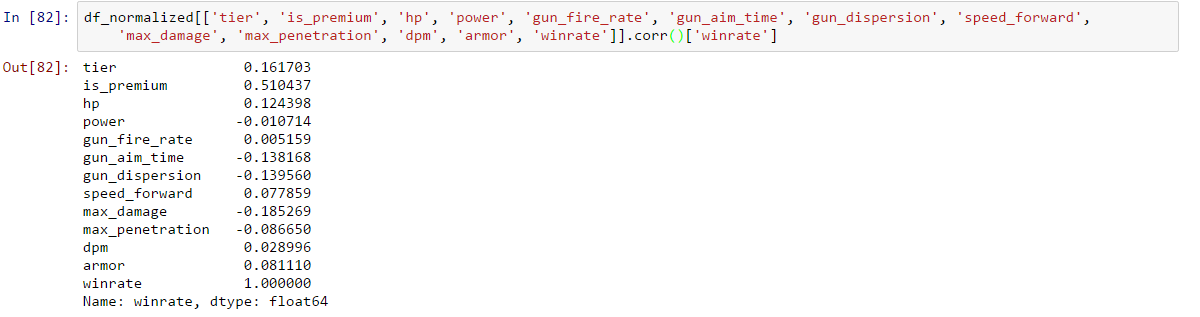
There is a strong is_premium correlation with winrate. Are premium tanks much better than usual? Not certainly in that way. Such a strong dependence is most likely due to the fact that experienced players play on the premium technology to farm silver, as many tanks bought for gold, a preferential level of battles, have more silver for a fight, the possibility of a fast pumping crew. You can build a graph and see how the winrate is distributed on the premium and conventional technology:
facet = sns.FacetGrid(df_normalized, hue="is_premium",aspect=4) facet.map(sns.kdeplot,'winrate',shade= True) facet.set(xlim=(0.40, df_normalized['winrate'].max())) facet.add_legend() sns.plt.title('Winrate from premium') 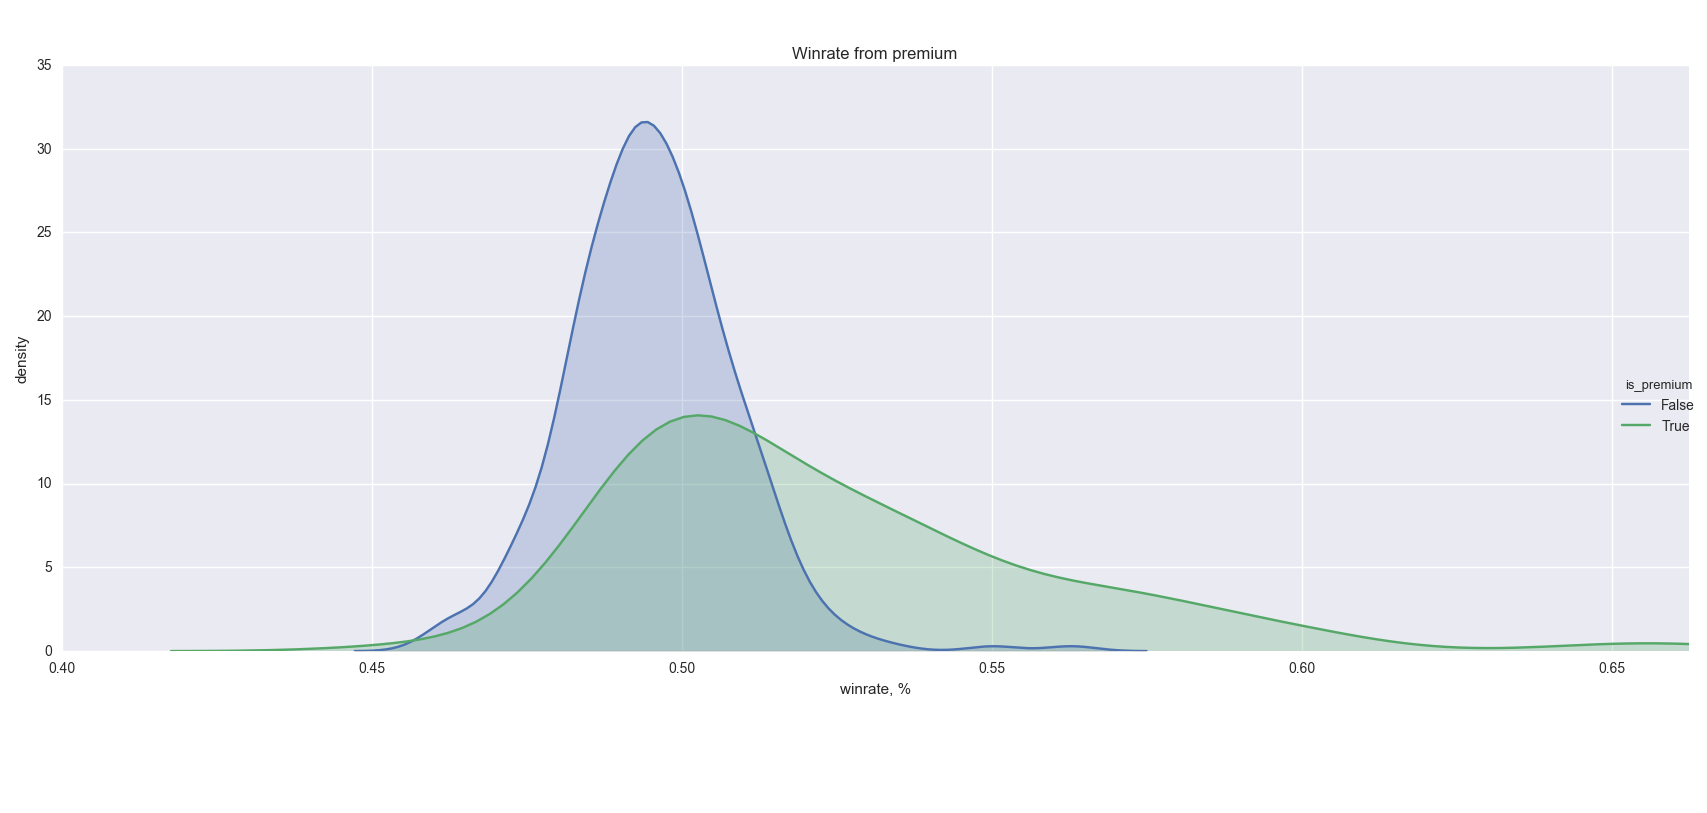
It can be seen that the distribution density of victories on a conventional technique is the Gaussian normal distribution with an average value of 49%. The distribution density of victories on the premium technique is elongated in the direction of a larger win rate, the average value is 52%, and the variance is much larger than that of the conventional technique.
There are 114 premium tanks in the game, which is 25% of the total. On the histogram of all tanks by the percentage of victories we saw the tail on the right. Let's see what tanks got into it:
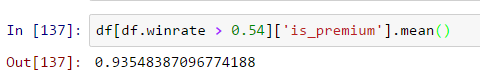
It turns out 93% of the tail tanks are premium. What is interesting is the remaining 7% (2 of 31) are Czech tanks.
Also from the correlation table it can be seen that the win rate is directly proportional to the level of the tank. Let's take a closer look at the graph:

It is easy to explain such a picture. On the first two levels of technology, such a small win rate is due to the fact that all novice players spoil the statistics for tanks due to lack of experience. Also at the first levels there are more chances to be at the bottom of the list. At level 10, on the contrary, you are always in the top. Also at level 9-10, playing without a premium account is unprofitable, so most people are there, playing with premium.
Of the remaining signs are directly proportional to the winrate: strength, speed forward, damage per minute and armor. Inversely proportional: the speed of information, the variation of the instrument. So far everything is obvious, but further it is clear that the maximum damage and armor penetration are inversely proportional to the percentage of victories.
This is strange, because the more a tank deals damage, the better. And there is. If you take another look at how I was getting the values for maximum damage, you can guess what the catch is. I just took the maximum damage and armor penetration values from all possible projectiles for a top gun. But after all, most often the biggest damage to land mines (with the smallest armor penetration), and land mines are far from the most frequently used shells in conventional tanks, we get an inaccuracy. Also, one-time damage can be large, and damage per minute is small due to a long recharge. Moreover, the negative correlation is probably due to the fact that artillery is usually the biggest damage and the smallest win rate - hence the inverse proportionality.
Importance of symptoms
Now you can build a random forest on this data and look at the result. Random forest is one of the most common machine learning algorithms, based on averaging the results of many different decision trees. This algorithm is well suited to find out the importance of individual features:
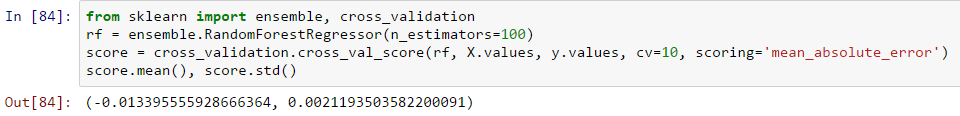
I tried different parameters and signs, but I didn’t manage to reduce the error much. It is seen that the algorithm is on average mistaken in predictions by 1.3% per cent. Now look at the importance of the signs for this forest:
importances = rf.feature_importances_ std = np.std([tree.feature_importances_ for tree in rf.estimators_], axis=0) indices = np.argsort(importances)[::-1] legends = [] for i in range(X.shape[1]): legends.append('%d.%s (%f)' % (i + 1, X.columns[indices[i]], importances[indices[i]])) plt.title('Feature importances') bars = plt.bar(range(X.shape[1]), importances[indices], color='c', yerr=std[indices], align='center') plt.xticks(range(X.shape[1]), range(1, X.shape[1] + 1)) plt.xlim([-1, X.shape[1]]) plt.legend(bars, legends, fontsize=12) 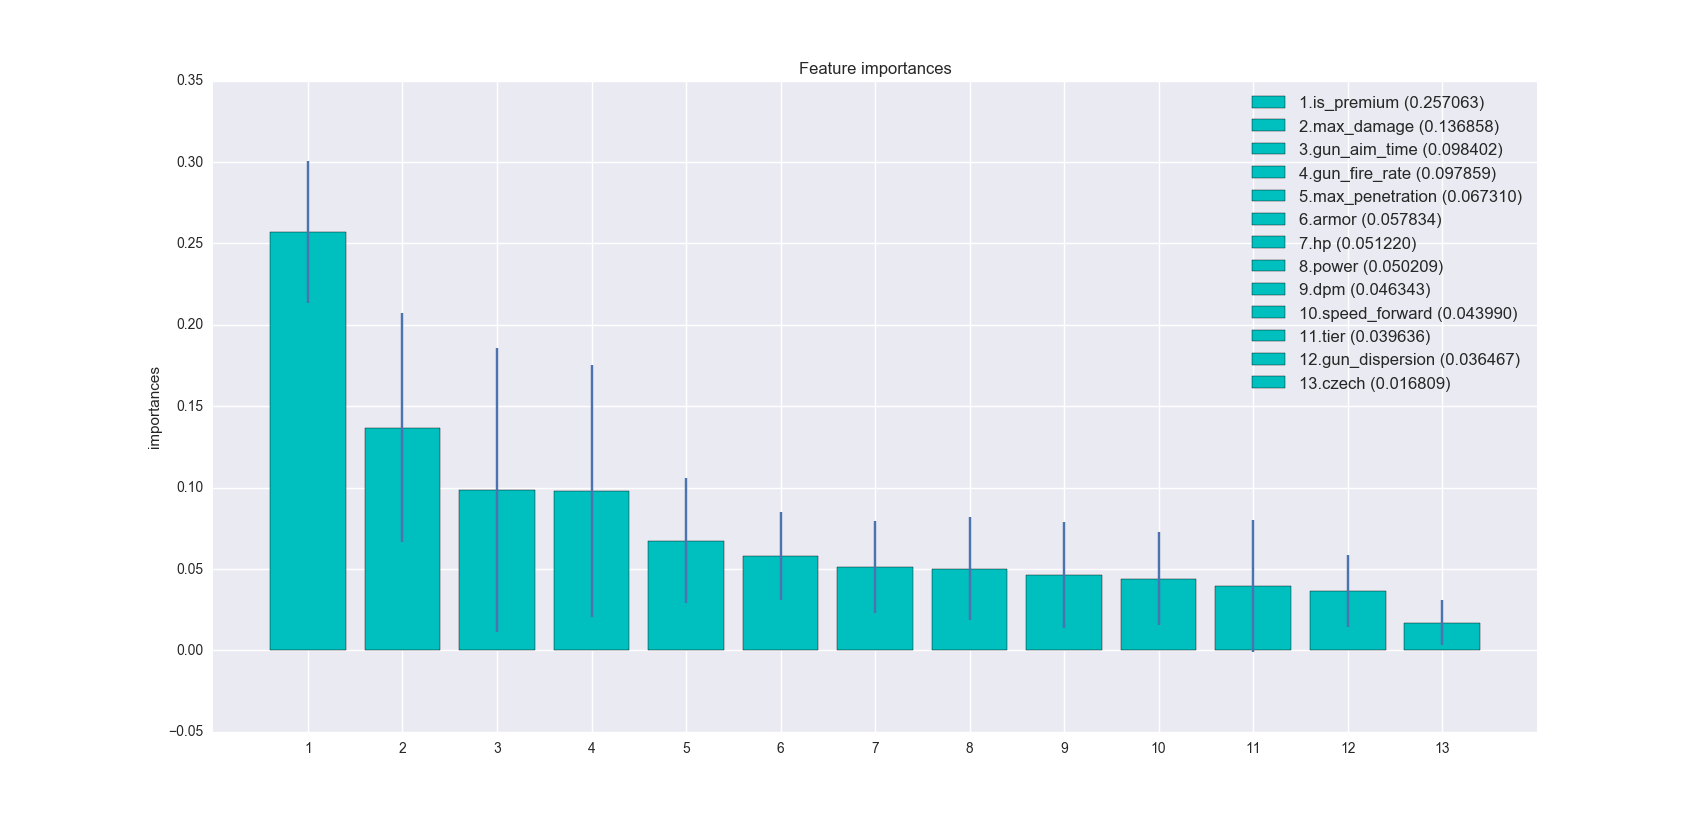
It turned out that for this model the most important parameter turned out to be - a premium tank or not, the importance of this feature is two times greater than the next in descending order. The next four most important attributes are the characteristics of the weapon, which is also predictable. You may notice that I also added the feature of belonging to the Czech nation, as this slightly reduced the error. But adding all the other features with nations and technology classes did not improve the operation of the algorithm.
What will happen if we remove the premium tanks from the sample and train random forest with the same parameters? The results are conveniently presented on boxplot:
fig, ax1 = plt.subplots(figsize=(10, 6)) data = [score_with_premium, score_without_premim] bp = plt.boxplot(data, notch=0, sym='+', vert=1, whis=1.5) ax1.set_title('Comparison of score with and without premium') ax1.set_ylabel('mean_absolute_error') xtickNames = plt.setp(ax1, xticklabels=['With premium', 'Without premium']) plt.setp(xtickNames, rotation=0, fontsize=12) 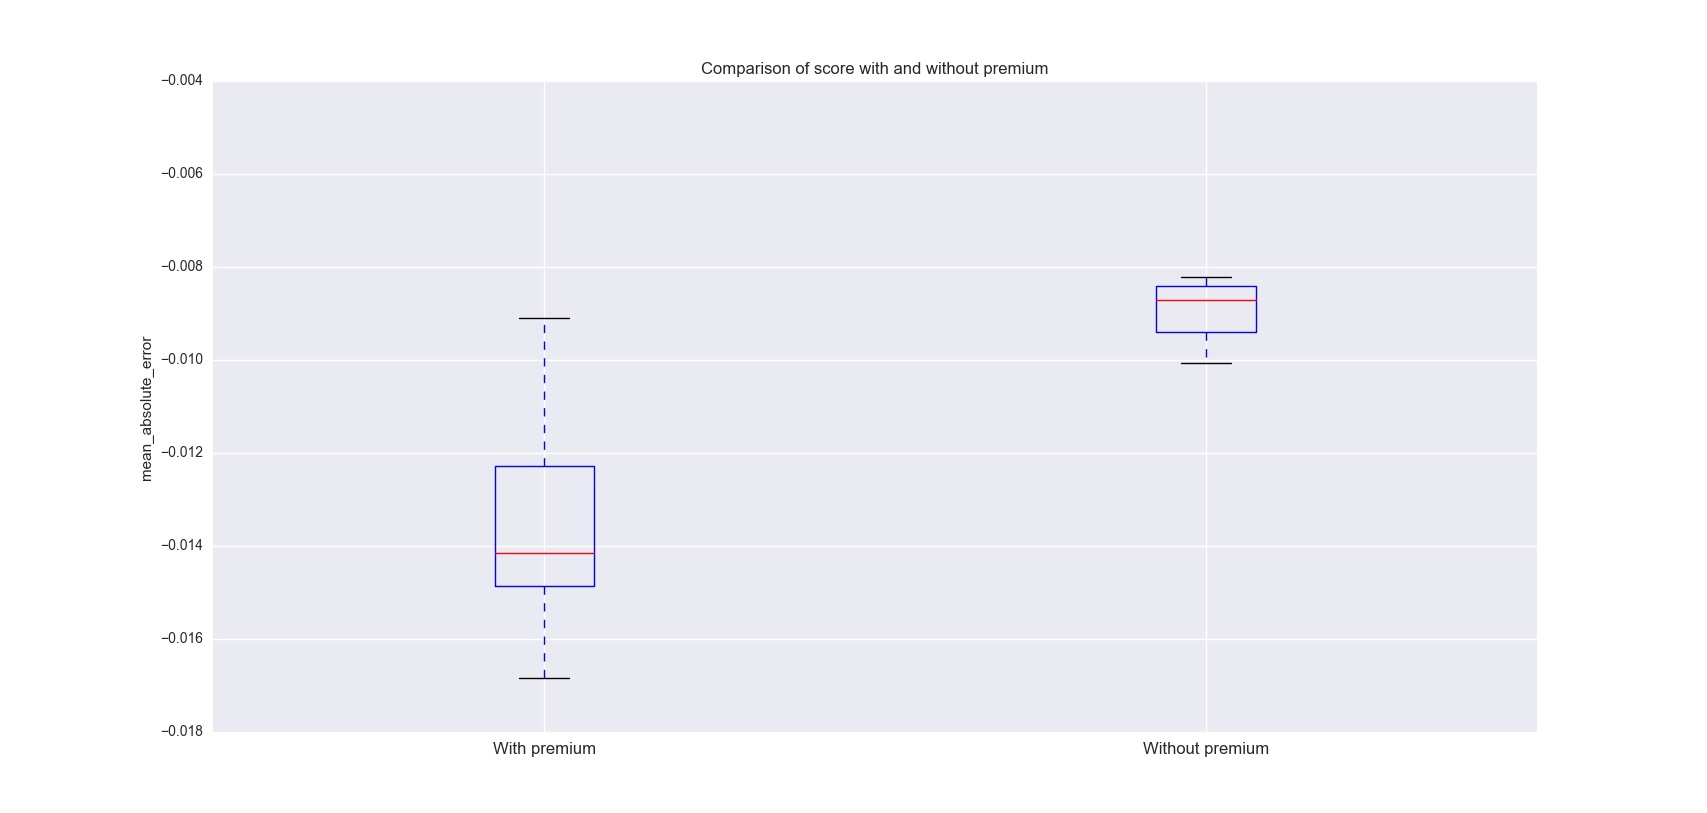
The algorithm immediately became much easier to guess the percentage of victories and, on average, the error in cross validation decreased to 0.9%, the error spread also became significantly smaller.
Conclusion
We looked at how to work with the WG API. They found out how the winrate depends on the nation - at the moment it is the most unstable on the Czechs, on the class of vehicles - on the medium tanks the largest, and on the art the smallest. Also saw a linear dependence on the level. They analyzed which signs of a tank most strongly influence victory in a battle — a premium tank or not, as well as weapon parameters. We also built a simple model that can predict its winning percentage relatively accurately from the tank’s characteristics.
Upd: saw_tooth suggested the plotting of the winrate graph from the level of technology and type separately (clickable):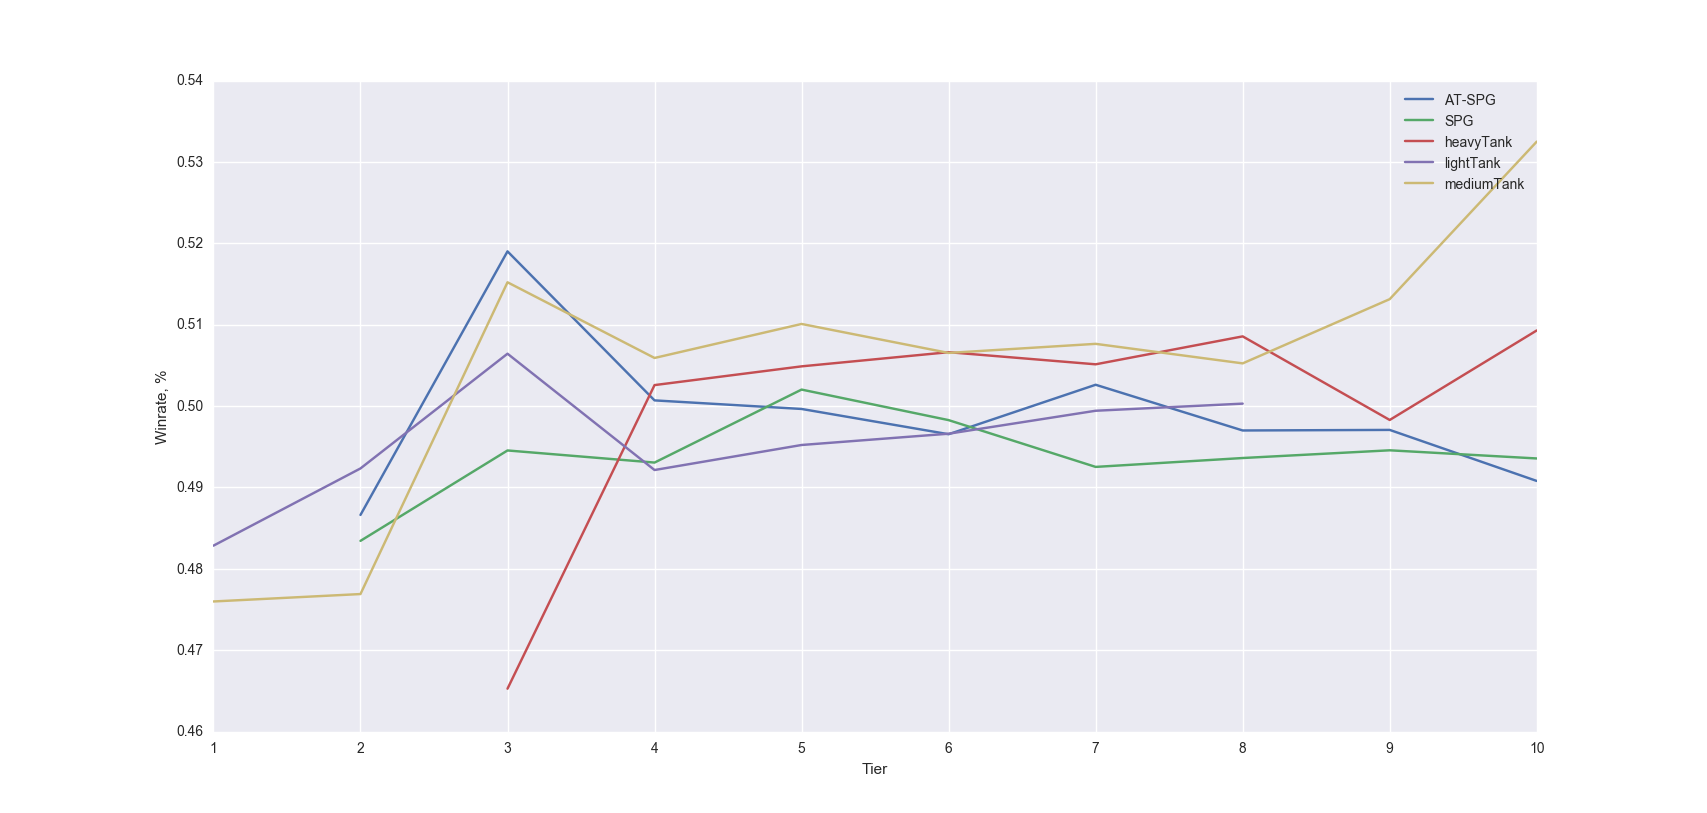
PS: If you also want to work with this dataset, but do not want to download data via the API, please contact me.
')
Source: https://habr.com/ru/post/302536/
All Articles