How to use Python to “graze” your unstructured data
Hello, dear readers.
Recently, we have been working on a variety of topics related to the Python language, including the problems of data extraction and analysis. For example, we are interested in the book Data Wrangling with Python: Tips and Tools for Your Life Easier :

')
Therefore, if you still do not know what is clamping, extraction of unstructured data, and how to bring chaos in order, we suggest reading the translation of the interesting article by Pete Tamisin, which tells how it is done in Python. Since the article opens up a whole series of posts by the author, and we have decided to limit ourselves to it for the time being, the text is a bit reduced.
If someone himself wants to prepare and publish a book on this topic - write, discuss.
I am a product manager at Rittman Mead, but at the same time, I still consider myself a freecom 80 lvl. I fell in love with comics, fantasy, science fiction and other such reading matter in those times when the word “Stark” was not associated with Robert Downey Jr. or with melodies about the impending winter. Therefore, I really liked the prospect of combining business with pleasure, that is, a hobby with work. I decided to write in my blog a few articles about building a predictive model based on data related to the sales of comics. The ultimate goal is to offer a model that would allow us to reliably judge whether readers will sweep the new comic strip off the shelves like hotcakes, or it will be in stock. In this publication I will talk about some of the pitfalls that may lie in wait for you when preparing data for analysis. Data preparation, also called “grazing” (wrangling), is an imperfect process, usually performed in several iterations and involving conversion, interpretation and refactoring — after which the data can be analyzed.
Although the steps of grazing data may vary depending on the state and availability of the raw data, in this article I decided to focus on gathering information from disparate sources, enriching the data by merging their attributes and restructuring the data to simplify the analysis. Comic book series are easy to find on the Internet, but it turns out that it’s not so easy to get them in a digestible format. In the end, I decided to go cheap and angry - I started screen-cracking information from a comic book research site . For those lucky ones who have not yet had a chance to deal with screen-based bracing, I explain: when you are bracing, you programmatically download HTML data and delete any formatting from it so that this data can be used. As a rule, this technique is used when nothing else remains, since the site is a fickle thing, the content on it changes at least as a teenage child lathers to run away from home.

So, here is the first problem that can be encountered when grazing data. You have access to the mass data, but they are inaccurate. We must comb them. Working with raw data resembles the work of a woodcarver. Your task is not to change the data structure in such a way as to fit them to your goals, but to cut off all unnecessary, so that a beautiful horse remains from the chock ... I mean, so that you can draw conclusions. Sorry, carried away by metaphors. By the way, continuing this analogy: to work on this project, I first of all extracted Python from the joinery box. For the programmer, Python is a real multitool. It is fast, well combined with other technologies and, most importantly in this case, it is ubiquitous. Python is used to solve all sorts of tasks - from process automation and ETL to game programming and academic research. Python is a truly multi-purpose language. Thus, when faced with a specific task, you can easily find a native module specifically designed for it in Python, or someone could already write a public library with the necessary functionality. I needed certain scripts for “scraping” HTML tables with comic sales data. Next, I needed to combine this information with other data on comics produced in a different place. “Other” information was metadata about each of the issues. Metadata is simply information describing other data. In this case, the metadata included information about the author, sales, publication time, etc. More on this below.
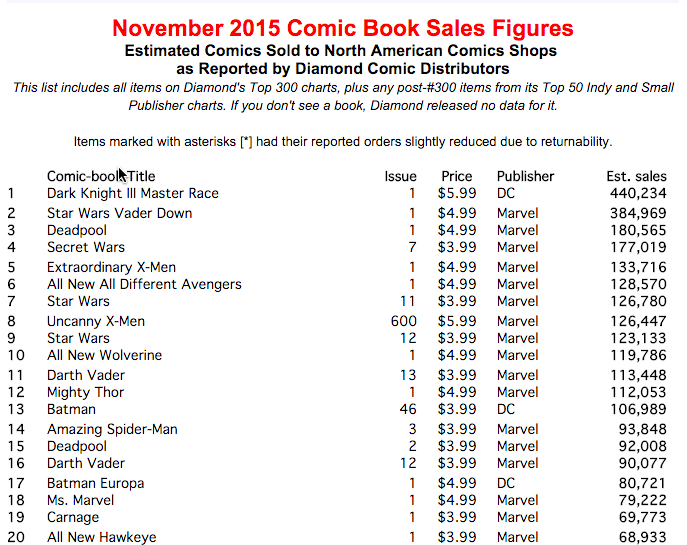
Fortunately, the data I pinned was in tabular format, so retrieving them and converting them to Python objects was relatively simple - all that was needed was to iterate over the rows of the table and associate each column of the table with a specially designed field of Python object. The page still had a lot of unnecessary content that had to be ignored - for example, title tags and other structural elements. But, as soon as I found the desired data table, I managed to isolate it. At this stage, I recorded the objects in a CSV file so that the data could be easily transferred, and also made easier to use with other languages and / or processes.
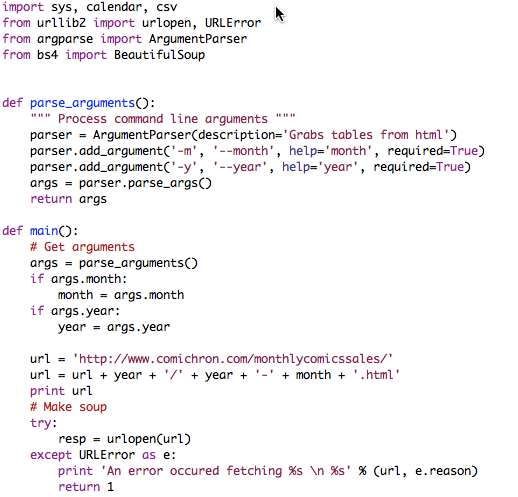
All the hard work in this case was done using three Python modules: urllib2, bs4 and csv. Urllib2, as the name implies, contains functions for opening URLs. While working on this project, I found a site where there was such a page: it contained information on approximate sales of issues for each month up to the beginning of the 90s. To extract the data for each month, without manually updating the hard-coded URLs again and again, I wrote a script that took MONTH and YEAR as arguments -
The response to the
BeautifulSoup has search functions that allow you to find a specific HTML table with sales data and cycle through all its rows, filling the Python object with values from the table columns.
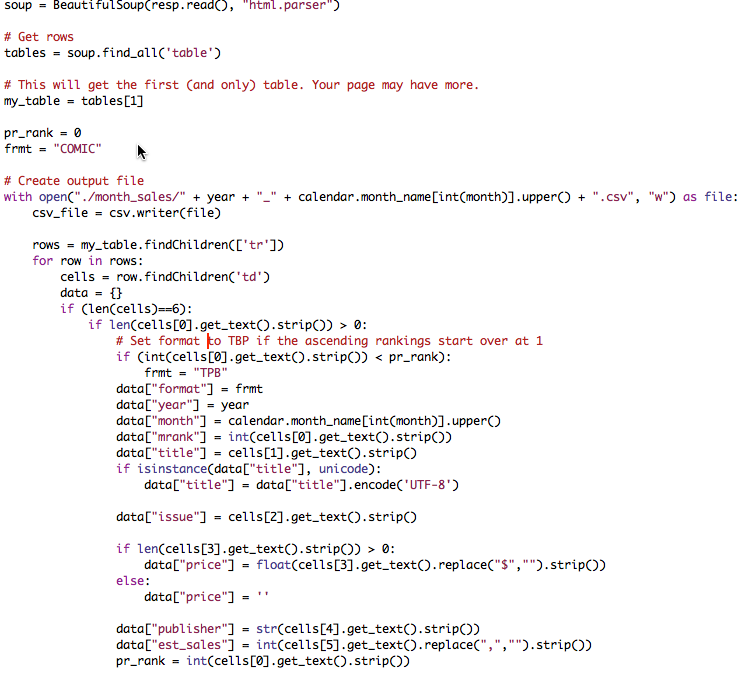
This Python object called data contains fields filled with data from various sources. The information about the year and month is filled in based on the arguments passed to the module. The format field is set dynamically, based on the logic by which ratings are built, and the remaining fields are filled in depending on exactly where their sources are located in the HTML table. As you can see, there are a lot of hard-coded logic that would have to be updated manually if the format of the site from which we extract data has changed. However, as long as we cope with the task, using the logic described here.
The final step in solving the problem is to write these Python objects to a CSV file. In the Python CSV module, there is a

During the first run, the program threw an exception, since the title field contained unicode characters that the CSV writing mechanism could not handle.

To cope with this, I had to add a unicode check and encode all the contents as UTF-8. Unicode and UTF-8 are character encodings, that is, they serve as dictionaries by which computers identify characters. Encodings contain alphabetic and logographic characters from various languages, as well as other common characters, such as.
In addition, it was necessary to reformat the values in some numerical fields (in particular, to remove the $ characters and commas from there), so that later on these values could be performed mathematical operations. The rest of the data loading went quite smoothly. For each month, a file called (MONTH) _ (YEAR) .CSV was generated. Each of these files looked like this:

Although as a result, tens of thousands of lines of comic book sales data were generated, this was not enough for me. That is, I had the necessary amount of information, but it was not wide enough. To make accurate predictions, I needed to fill in the models and other variables, not just the name of the comic, the release number and price. The publishing house did not matter, since I decided to practice only with Marvel comics, and the transfer of approximate sales data would be a scam, since the rating depends on sales. So, to improve my data sets, I extracted metadata about each release from the cloud using the Marvel's Developer API. Fortunately, since this API is a web service, it was possible to do without screen clamping.
Retrieving and combining this data was not as easy as it might seem. The main problem was that the titles of the issues obtained by clamping did not fully coincide with the names stored in the Marvel database. For example, the name “All New All Different Different Avengers” appears in the data array obtained by clamping. Using the API to search the Marvel database, I did not find anything like that. As a result, we managed to manually find the record “All-New All-Different Avengers” in their database. In other cases, there were extra words, compare: “The Superior Foes of Spider-Man” and “Superior Foes of Spider-Man”. So, in order to perform a search by name, I had to know how the name could be mentioned in the Marvel database. For this, I decided to make a list of the names of all those series whose metadata was changed during the time periods for which I had sales data. And again I ran into an obstacle. The Marvel API allowed you to retrieve no more than 100 results for one query, and Marvel published thousands of comics. To get around this problem, I had to extract the data incrementally, segmenting it alphabetically.

Even here there were some minor problems, since some letters, for example, 'S', came across over 100 names. To solve them, I had to extract all the names on 'S', first in alphabetical and then in reverse alphabetical order, then combine these results and get rid of all duplicates. Therefore, I advise you to carefully deal with all the limitations of the API that you are going to use. It is possible that some restrictions will prove to be unremovable, but maybe they will be able to get around them, inventively formulating requests.

At this stage, I already had a list of Marvel series titles, saved in several CSV files, which I eventually put in one MarvelSeriesList.csv file to make it easier to work. But I had one more thing. When retrieving the titles of the series, I also saved the ID of each series and the rating of its representativeness. Search by ID is much more accurate than by name, and the representativeness rating can be useful when building a predictive model. The next step was to loop through all the lines in the CSV files created on the basis of the sales data, find the ID matches from the MarvelSeriesList.csv file, and use this ID to extract the corresponding metadata through the API.
As you remember, the last stage was necessary because the headers stored in the files with sales data did not coincide with the headers in the API, and I needed to somehow combine these two sources. I didn’t write cases to handle each script (for example, punctuation mismatch, superfluous words), I found the Python library to search for fuzzy matches. I came across an extremely useful library of Fuzzy Wuzzy .Fuzzy Wuzzy, which
Again, I had to tinker a bit so that this configuration would work efficiently. For the first time, only 65% of the names in the sales lists were able to find matches. In my opinion, the script sifted out too much data, so I had to look at the exceptions and find out which matches escape me. Thus, the following problem emerged: the headers tied to a particular year in the Marvel database, for example, “All-New X-Men (2012)”, had a matching rating of over 80 when compared with titles such as “All New X-Men”. This problem was constantly encountered, so I decided not to underestimate the percentage of compliance (in this case, the script could not notice some real mismatches), and if there is a discrepancy, cut off the year and check the compliance again. Almost got it. There was also such a problem: the library This was a pretty consistent issue, so rather than lowering the match percentage, which Fuzzy Wuzzy poorly compared acronyms and acrostics. So, when comparing 'SHEILD' and 'SHIELD', a degree of conformity of about 50 was obtained. The fact is that in the second variant half of the symbols (dots) were missing. Since in this case only two titles were affected, I wrote a search dictionary with special cases that needed to be translated. In the exercise described, it was possible to skip this step, since I already had a decent match, but it is necessary for 100% accurate matching. As soon as the match search function worked, I connected urllib2 and extracted all the metadata for the issues I could get.
The finished files contained not only sales data (name, release number, monthly rating, approximate sales), but also information about the authors, the issues themselves, the characters, release dates and the corresponding storylines.
Recently, we have been working on a variety of topics related to the Python language, including the problems of data extraction and analysis. For example, we are interested in the book Data Wrangling with Python: Tips and Tools for Your Life Easier :
')
Therefore, if you still do not know what is clamping, extraction of unstructured data, and how to bring chaos in order, we suggest reading the translation of the interesting article by Pete Tamisin, which tells how it is done in Python. Since the article opens up a whole series of posts by the author, and we have decided to limit ourselves to it for the time being, the text is a bit reduced.
If someone himself wants to prepare and publish a book on this topic - write, discuss.
I am a product manager at Rittman Mead, but at the same time, I still consider myself a freecom 80 lvl. I fell in love with comics, fantasy, science fiction and other such reading matter in those times when the word “Stark” was not associated with Robert Downey Jr. or with melodies about the impending winter. Therefore, I really liked the prospect of combining business with pleasure, that is, a hobby with work. I decided to write in my blog a few articles about building a predictive model based on data related to the sales of comics. The ultimate goal is to offer a model that would allow us to reliably judge whether readers will sweep the new comic strip off the shelves like hotcakes, or it will be in stock. In this publication I will talk about some of the pitfalls that may lie in wait for you when preparing data for analysis. Data preparation, also called “grazing” (wrangling), is an imperfect process, usually performed in several iterations and involving conversion, interpretation and refactoring — after which the data can be analyzed.
Although the steps of grazing data may vary depending on the state and availability of the raw data, in this article I decided to focus on gathering information from disparate sources, enriching the data by merging their attributes and restructuring the data to simplify the analysis. Comic book series are easy to find on the Internet, but it turns out that it’s not so easy to get them in a digestible format. In the end, I decided to go cheap and angry - I started screen-cracking information from a comic book research site . For those lucky ones who have not yet had a chance to deal with screen-based bracing, I explain: when you are bracing, you programmatically download HTML data and delete any formatting from it so that this data can be used. As a rule, this technique is used when nothing else remains, since the site is a fickle thing, the content on it changes at least as a teenage child lathers to run away from home.
So, here is the first problem that can be encountered when grazing data. You have access to the mass data, but they are inaccurate. We must comb them. Working with raw data resembles the work of a woodcarver. Your task is not to change the data structure in such a way as to fit them to your goals, but to cut off all unnecessary, so that a beautiful horse remains from the chock ... I mean, so that you can draw conclusions. Sorry, carried away by metaphors. By the way, continuing this analogy: to work on this project, I first of all extracted Python from the joinery box. For the programmer, Python is a real multitool. It is fast, well combined with other technologies and, most importantly in this case, it is ubiquitous. Python is used to solve all sorts of tasks - from process automation and ETL to game programming and academic research. Python is a truly multi-purpose language. Thus, when faced with a specific task, you can easily find a native module specifically designed for it in Python, or someone could already write a public library with the necessary functionality. I needed certain scripts for “scraping” HTML tables with comic sales data. Next, I needed to combine this information with other data on comics produced in a different place. “Other” information was metadata about each of the issues. Metadata is simply information describing other data. In this case, the metadata included information about the author, sales, publication time, etc. More on this below.
Fortunately, the data I pinned was in tabular format, so retrieving them and converting them to Python objects was relatively simple - all that was needed was to iterate over the rows of the table and associate each column of the table with a specially designed field of Python object. The page still had a lot of unnecessary content that had to be ignored - for example, title tags and other structural elements. But, as soon as I found the desired data table, I managed to isolate it. At this stage, I recorded the objects in a CSV file so that the data could be easily transferred, and also made easier to use with other languages and / or processes.
All the hard work in this case was done using three Python modules: urllib2, bs4 and csv. Urllib2, as the name implies, contains functions for opening URLs. While working on this project, I found a site where there was such a page: it contained information on approximate sales of issues for each month up to the beginning of the 90s. To extract the data for each month, without manually updating the hard-coded URLs again and again, I wrote a script that took MONTH and YEAR as arguments -
month_sales_scraper.pyThe response to the
urlopen(url) function call contained the complete HTML code in the form it is usually displayed in the browser. This format was practically useless to me, so I had to use a parser to extract data from HTML. A parser in this case is a program that reads a document in a specific format, breaks it up into components, without breaking the interrelationships that existed between these components; Finally, the parser allows you to selectively refer to the above components. So, the HTML parser gave me easy access to all the column tags in a particular table within the HTML document. I used the program BeautifulSoup, it is bs4.BeautifulSoup has search functions that allow you to find a specific HTML table with sales data and cycle through all its rows, filling the Python object with values from the table columns.
This Python object called data contains fields filled with data from various sources. The information about the year and month is filled in based on the arguments passed to the module. The format field is set dynamically, based on the logic by which ratings are built, and the remaining fields are filled in depending on exactly where their sources are located in the HTML table. As you can see, there are a lot of hard-coded logic that would have to be updated manually if the format of the site from which we extract data has changed. However, as long as we cope with the task, using the logic described here.
The final step in solving the problem is to write these Python objects to a CSV file. In the Python CSV module, there is a
writerow() function that takes an array as a parameter and writes all the elements of the array as columns in CSV format.During the first run, the program threw an exception, since the title field contained unicode characters that the CSV writing mechanism could not handle.
To cope with this, I had to add a unicode check and encode all the contents as UTF-8. Unicode and UTF-8 are character encodings, that is, they serve as dictionaries by which computers identify characters. Encodings contain alphabetic and logographic characters from various languages, as well as other common characters, such as.
In addition, it was necessary to reformat the values in some numerical fields (in particular, to remove the $ characters and commas from there), so that later on these values could be performed mathematical operations. The rest of the data loading went quite smoothly. For each month, a file called (MONTH) _ (YEAR) .CSV was generated. Each of these files looked like this:
Although as a result, tens of thousands of lines of comic book sales data were generated, this was not enough for me. That is, I had the necessary amount of information, but it was not wide enough. To make accurate predictions, I needed to fill in the models and other variables, not just the name of the comic, the release number and price. The publishing house did not matter, since I decided to practice only with Marvel comics, and the transfer of approximate sales data would be a scam, since the rating depends on sales. So, to improve my data sets, I extracted metadata about each release from the cloud using the Marvel's Developer API. Fortunately, since this API is a web service, it was possible to do without screen clamping.
Retrieving and combining this data was not as easy as it might seem. The main problem was that the titles of the issues obtained by clamping did not fully coincide with the names stored in the Marvel database. For example, the name “All New All Different Different Avengers” appears in the data array obtained by clamping. Using the API to search the Marvel database, I did not find anything like that. As a result, we managed to manually find the record “All-New All-Different Avengers” in their database. In other cases, there were extra words, compare: “The Superior Foes of Spider-Man” and “Superior Foes of Spider-Man”. So, in order to perform a search by name, I had to know how the name could be mentioned in the Marvel database. For this, I decided to make a list of the names of all those series whose metadata was changed during the time periods for which I had sales data. And again I ran into an obstacle. The Marvel API allowed you to retrieve no more than 100 results for one query, and Marvel published thousands of comics. To get around this problem, I had to extract the data incrementally, segmenting it alphabetically.
Even here there were some minor problems, since some letters, for example, 'S', came across over 100 names. To solve them, I had to extract all the names on 'S', first in alphabetical and then in reverse alphabetical order, then combine these results and get rid of all duplicates. Therefore, I advise you to carefully deal with all the limitations of the API that you are going to use. It is possible that some restrictions will prove to be unremovable, but maybe they will be able to get around them, inventively formulating requests.
At this stage, I already had a list of Marvel series titles, saved in several CSV files, which I eventually put in one MarvelSeriesList.csv file to make it easier to work. But I had one more thing. When retrieving the titles of the series, I also saved the ID of each series and the rating of its representativeness. Search by ID is much more accurate than by name, and the representativeness rating can be useful when building a predictive model. The next step was to loop through all the lines in the CSV files created on the basis of the sales data, find the ID matches from the MarvelSeriesList.csv file, and use this ID to extract the corresponding metadata through the API.
As you remember, the last stage was necessary because the headers stored in the files with sales data did not coincide with the headers in the API, and I needed to somehow combine these two sources. I didn’t write cases to handle each script (for example, punctuation mismatch, superfluous words), I found the Python library to search for fuzzy matches. I came across an extremely useful library of Fuzzy Wuzzy .Fuzzy Wuzzy, which
extractOne() function. This function allows you to pass a term and compare it with an array of values. Then the extractOne() function returns the term found in the array that most closely matches the request. In addition, you can set the lower limit of conformity (that is, return only those results whose degree of compliance is> = 90%).Again, I had to tinker a bit so that this configuration would work efficiently. For the first time, only 65% of the names in the sales lists were able to find matches. In my opinion, the script sifted out too much data, so I had to look at the exceptions and find out which matches escape me. Thus, the following problem emerged: the headers tied to a particular year in the Marvel database, for example, “All-New X-Men (2012)”, had a matching rating of over 80 when compared with titles such as “All New X-Men”. This problem was constantly encountered, so I decided not to underestimate the percentage of compliance (in this case, the script could not notice some real mismatches), and if there is a discrepancy, cut off the year and check the compliance again. Almost got it. There was also such a problem: the library This was a pretty consistent issue, so rather than lowering the match percentage, which Fuzzy Wuzzy poorly compared acronyms and acrostics. So, when comparing 'SHEILD' and 'SHIELD', a degree of conformity of about 50 was obtained. The fact is that in the second variant half of the symbols (dots) were missing. Since in this case only two titles were affected, I wrote a search dictionary with special cases that needed to be translated. In the exercise described, it was possible to skip this step, since I already had a decent match, but it is necessary for 100% accurate matching. As soon as the match search function worked, I connected urllib2 and extracted all the metadata for the issues I could get.
The finished files contained not only sales data (name, release number, monthly rating, approximate sales), but also information about the authors, the issues themselves, the characters, release dates and the corresponding storylines.
Source: https://habr.com/ru/post/302520/
All Articles