Integration of the Vutlan SC8100 monitoring system with NMS Cacti
Man always wants more. The monitoring system from the Vutlan company monitors the monitored parameters, notifies of the approach to dangerous values through SMS messages and e-mail distribution. Displays data in the form of graphs, allows you to use graphics cards. A good, high-quality software product that completely covers the needs of technical specialists. The best quality engineer is the desire to explore, study and improve existing solutions. Therefore, we consider the possibility of integrating data from sensors and sensors into an external parameter monitoring system. For example, take one of the GNU GPL systems NMS - Cacti. Choose the right system for your needs here . To my taste, the best NMS for tracking engineering equipment parameters (ventilation and air conditioning systems, power distribution systems, fire extinguishing systems, video surveillance, access control) is Cacti. A very convenient graphing system that allows you to visually track the dynamics of values:
')
Very convenient graphical representation of the data (map) with a very flexible language for describing values.
Like any other monitoring system in Cacti, it is possible to receive data via the SNMP protocol. I will try to get data from the sensors connected to the monitoring system parameters Vutlan SC8100, and display them in the NMS Cacti.
First you need to configure the SNMP service in Vutlan SC8100:

You can use protocols version 1 and 2c, or protocol version 3. At this stage, the settings shown in the picture are enough.
The next step is to choose a sensor that we will import into an external monitoring system.
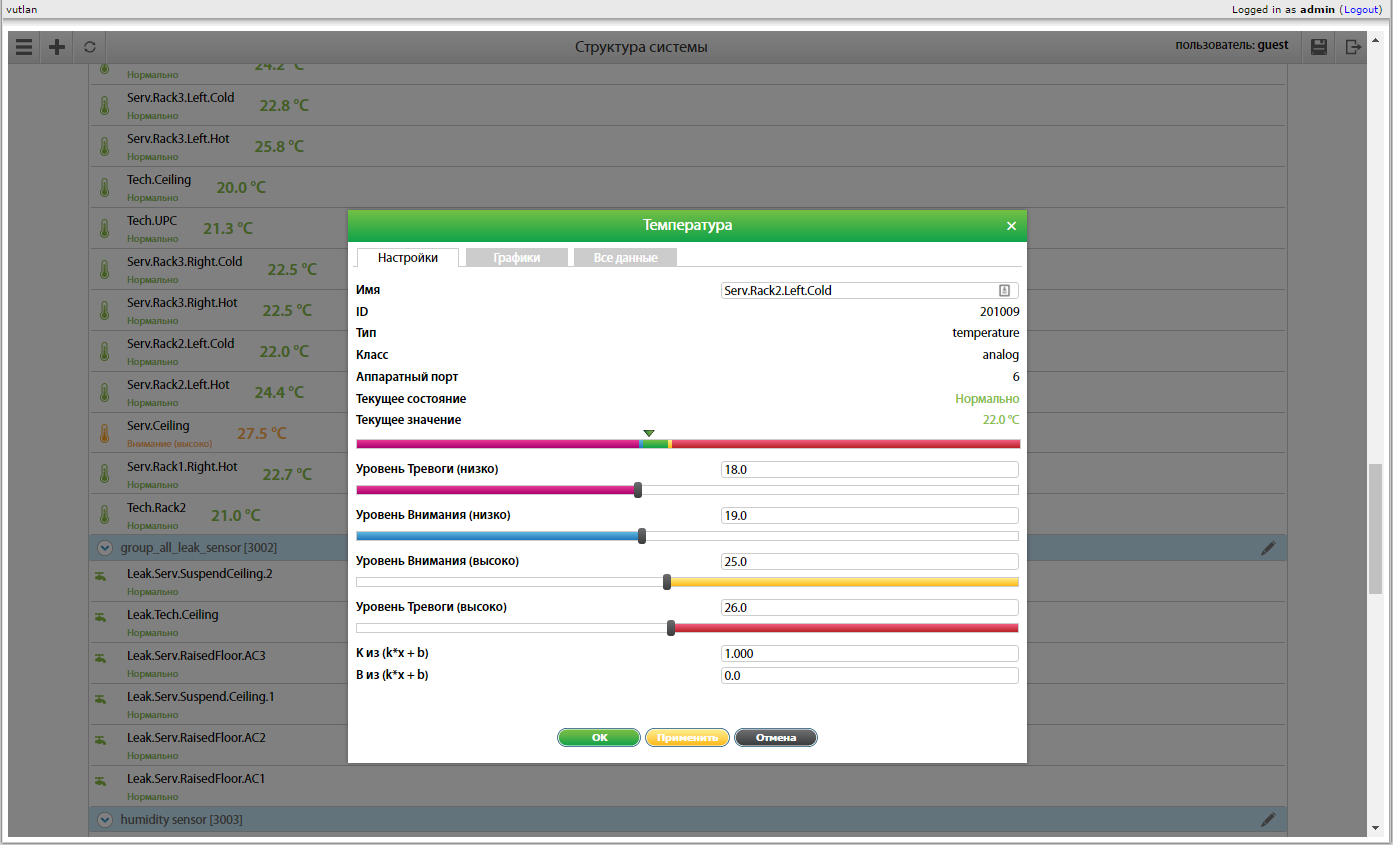
This will be the air temperature sensor in the area of 2 cabinets inside the cold zone corridor.
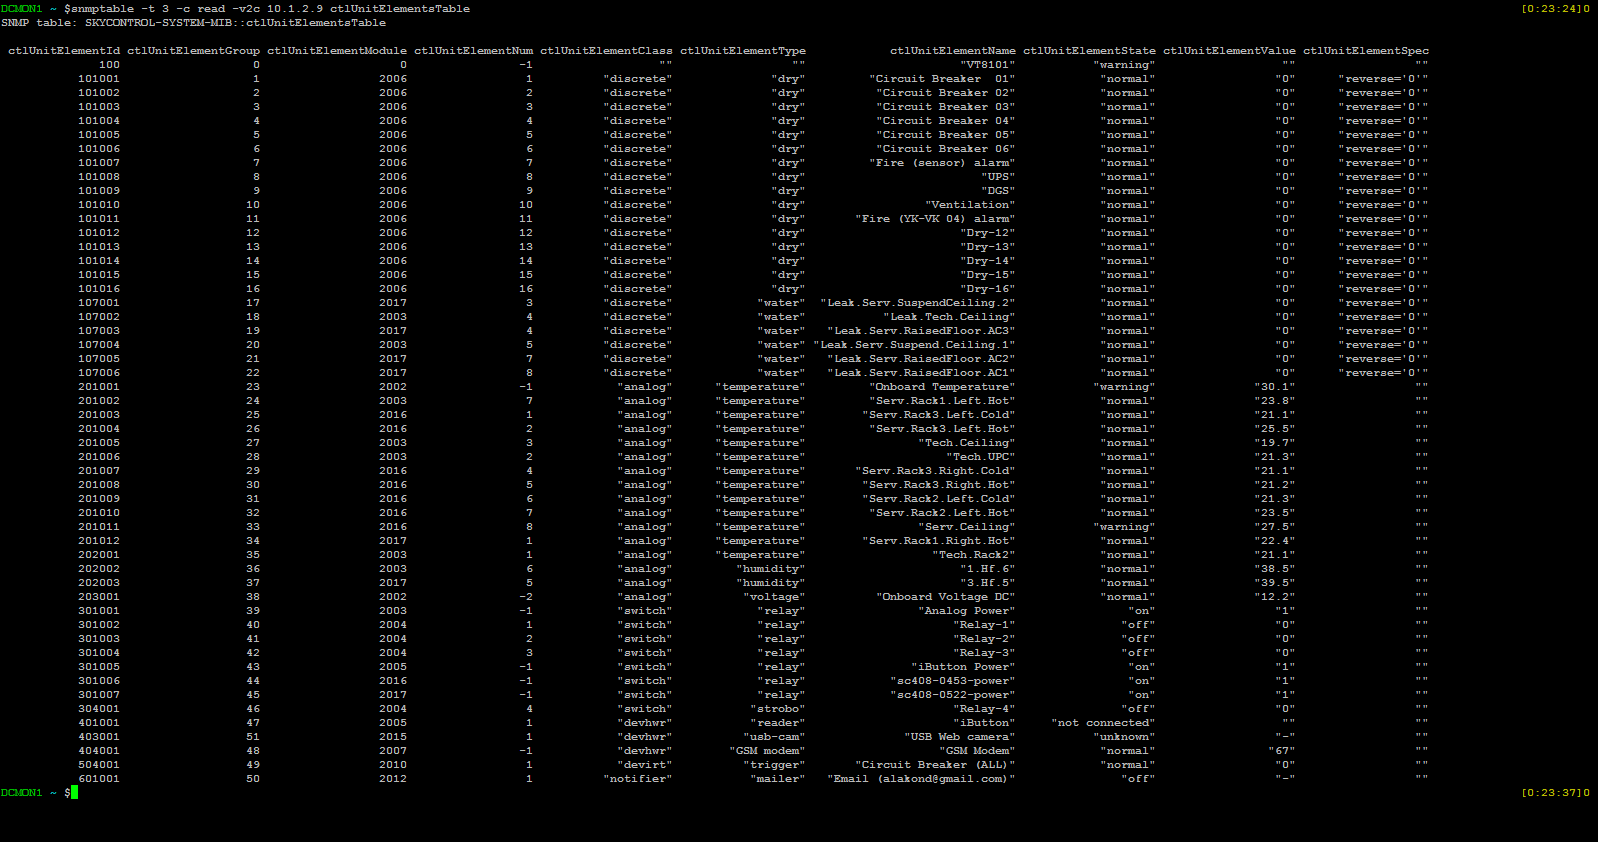
As can be seen from the web interface and the output of the snmptable id command for this element 201009.
Using the ctlUnitElementName ctlUnitElementValue SNMP table fields and the snmptranslate command (or the -On key) we get the required OID: .1.3.6.1.4.1.39052.1.3.1.9.201009.
Check:

That's right. We proceed to the integration of this value in the monitoring system Cacti.
Now there are 2 ways: use the pre-installed SNMP - Generic OID Template or create a graph by creating your own templates. The first way is faster, has less settings and modification options. By this he is not interesting to us.
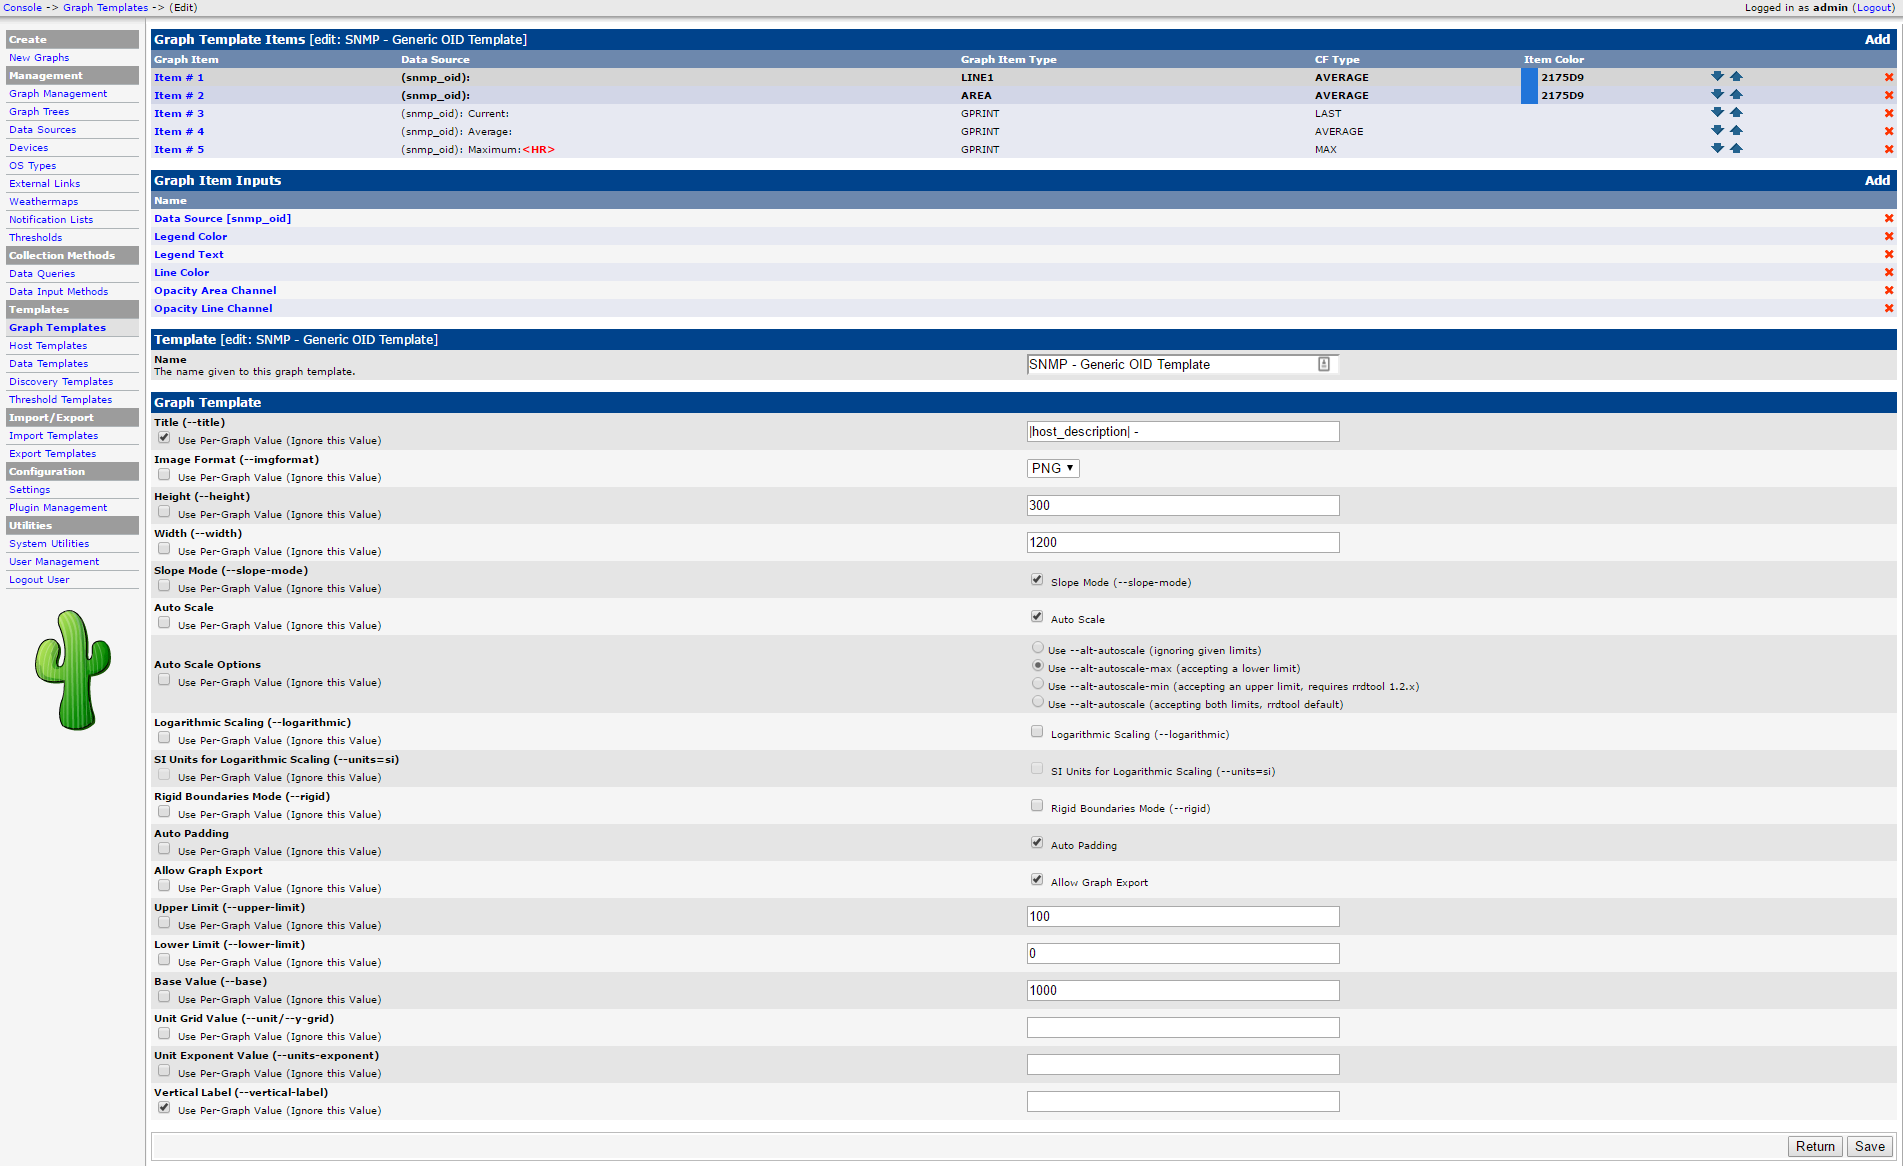
In order to create a schedule from scratch in Cacti, you need:
Graphic Template:
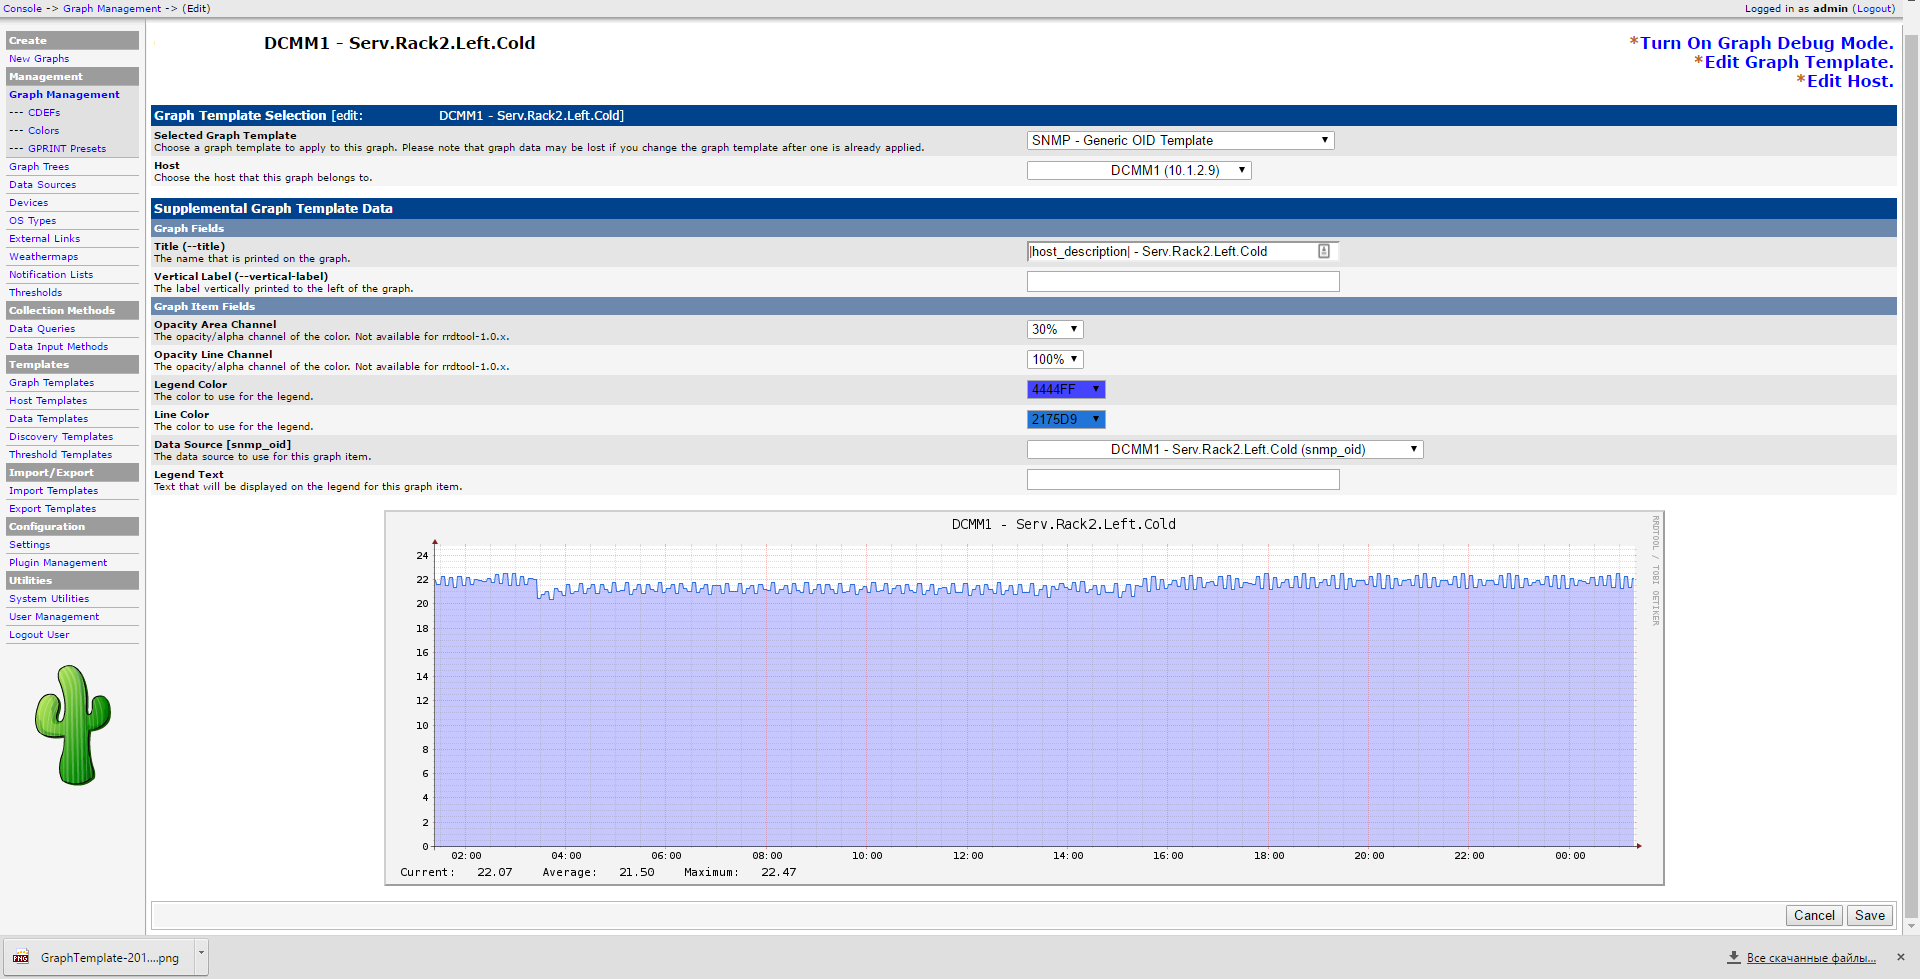
Creating a schedule:

And finally the schedule itself:
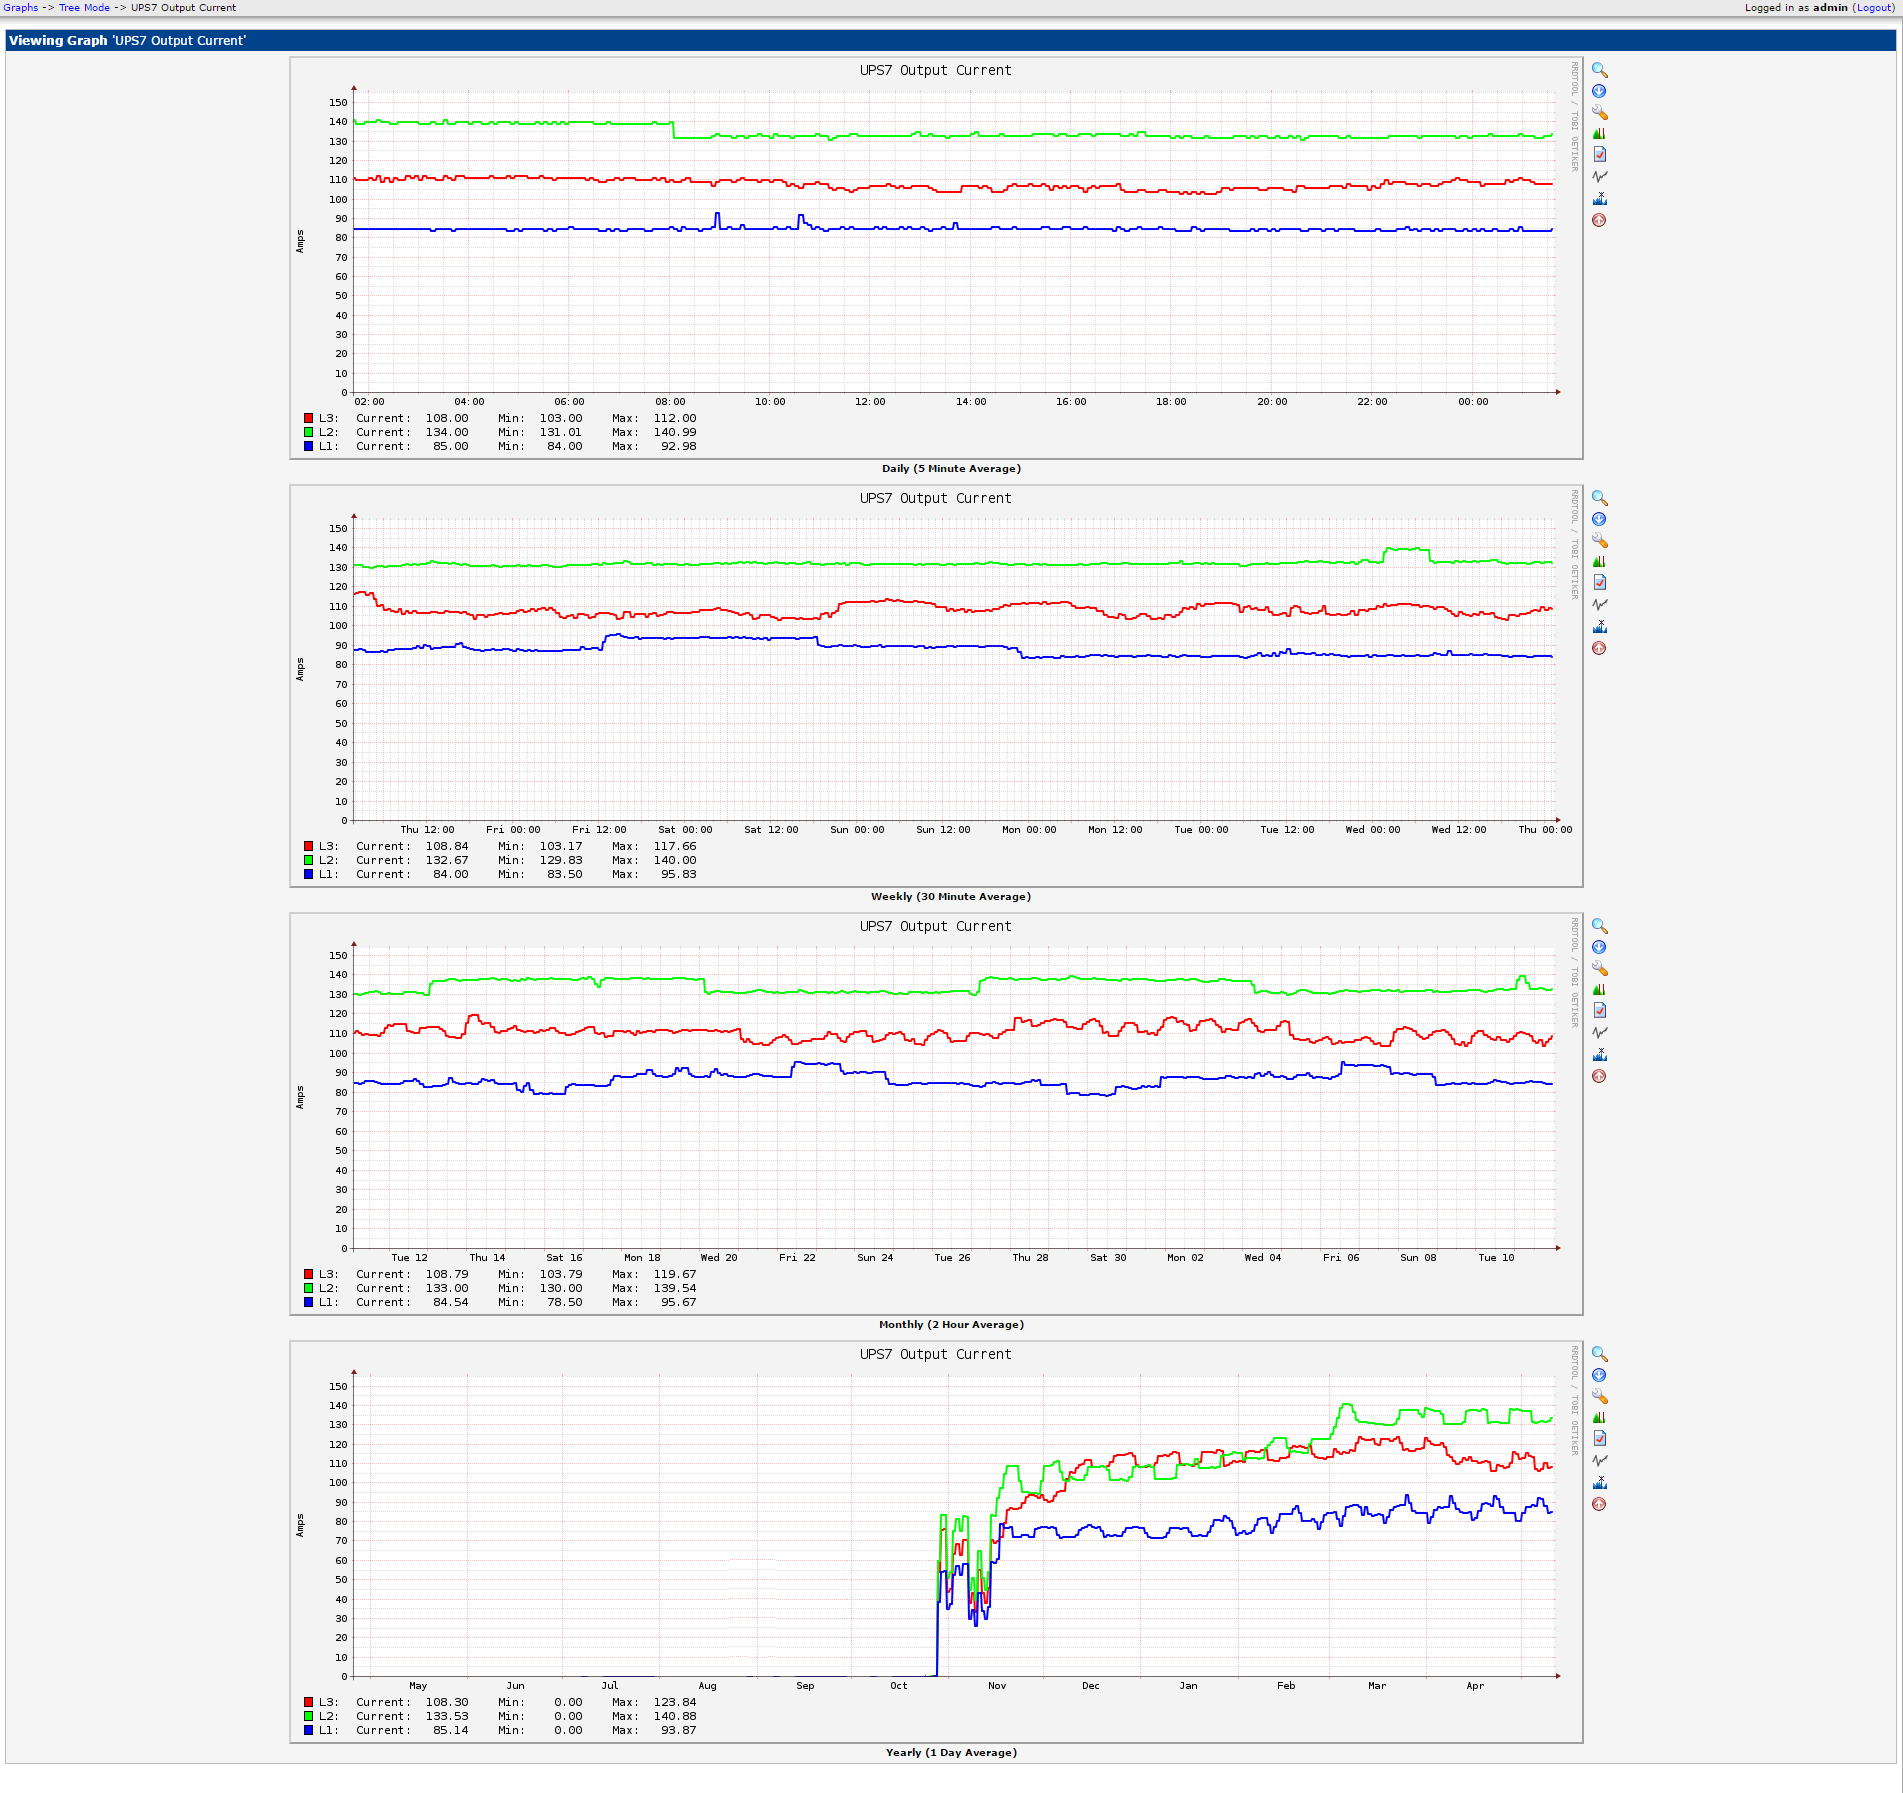
As a result, in a few months, when the schedule is “filled” with data, we get:

All further settings: forecasting, thresholds, the output of information on the weathermap, etc. for this schedule must be done independently.
')
Very convenient graphical representation of the data (map) with a very flexible language for describing values.
Like any other monitoring system in Cacti, it is possible to receive data via the SNMP protocol. I will try to get data from the sensors connected to the monitoring system parameters Vutlan SC8100, and display them in the NMS Cacti.
First you need to configure the SNMP service in Vutlan SC8100:
You can use protocols version 1 and 2c, or protocol version 3. At this stage, the settings shown in the picture are enough.
The next step is to choose a sensor that we will import into an external monitoring system.
This will be the air temperature sensor in the area of 2 cabinets inside the cold zone corridor.
As can be seen from the web interface and the output of the snmptable id command for this element 201009.
Using the ctlUnitElementName ctlUnitElementValue SNMP table fields and the snmptranslate command (or the -On key) we get the required OID: .1.3.6.1.4.1.39052.1.3.1.9.201009.
Check:
That's right. We proceed to the integration of this value in the monitoring system Cacti.
Now there are 2 ways: use the pre-installed SNMP - Generic OID Template or create a graph by creating your own templates. The first way is faster, has less settings and modification options. By this he is not interesting to us.
In order to create a schedule from scratch in Cacti, you need:
Graphic Template:
Creating a schedule:
And finally the schedule itself:
As a result, in a few months, when the schedule is “filled” with data, we get:
All further settings: forecasting, thresholds, the output of information on the weathermap, etc. for this schedule must be done independently.
Source: https://habr.com/ru/post/302368/
All Articles