Go profiling and optimization
Introduction
In this article, I will explain how to profile and optimize Go applications using the built-in and common tools available in Linux.
What is profiling and optimization? If your program is not running fast enough, it uses too much memory, it is not optimally using the processor, you want to understand what's wrong, and fix it - this is profiling and optimization.
I gave such a definition in order to immediately cut off the issues of incorrect application operation. In this article we will not talk about the problems of multi-thread programming, about data flights (English data race ), about finding errors (English debugging ). For all this, Go has its own utilities and approaches, but we will leave this topic for the future.
')

CPU
Let's start today's review with the processor.
In Go there is a built-in profiler, made in the image and likeness of a profiler from the gperftools C / C ++ utility set. Moreover, an analogue of the pprof utility, designed for visualization of profiling results, has now become the main version and is recommended for visualization for both Go and C / C ++.
If we talk about classification, the Go profiler is “sampling”. This means that with some periodicity we interrupt the work of the program, take the stack trace, write it somewhere, and at the end, based on how often there are different functions in the stack traces, we understand which of them used more processor resources, and some less.
We can run almost all Go utilities and profilers in several ways, some of which are described in this article.
Let's start with an example, and then we'll talk more.
Example
package perftest import ( "regexp" "strings" "testing" ) var haystack = `Lorem ipsum dolor sit amet, consectetur adipiscing elit. Cras accumsan nisl et iaculis fringilla. Integer sapien orci, facilisis ut venenatis nec, suscipit at massa. Cras suscipit lectus non neque molestie, et imperdiet sem ultricies. Donec sit amet mattis nisi, efficitur posuere enim. Aliquam erat volutpat. Curabitur mattis nunc nisi, eu maximus dui facilisis in. Quisque vel tortor mauris. Praesent tellus sapien, vestibulum nec purus ut, luctus egestas odio. Ut ac ipsum non ipsum elementum pretium in id enim. Aenean eu augue fringilla, molestie orci et, tincidunt ipsum. Nullam maximus odio vitae augue fermentum laoreet eget scelerisque ligula. Praesent pretium eu lacus in ornare. Maecenas fermentum id sapien non faucibus. Donec est tellus, auctor eu iaculis quis, accumsan vitae ligula. Fusce dolor nisl, pharetra eu facilisis non, hendrerit ac turpis. Pellentesque imperdiet aliquam quam in luctus. Curabitur ut orci sodales, faucibus nunc ac, maximus odio. Vivamus vitae nulla posuere, pellentesque quam posuere` func BenchmarkSubstring(b *testing.B) { for i := 0; i < bN; i++ { strings.Contains(haystack, "auctor") } } func BenchmarkRegex(b *testing.B) { for i := 0; i < bN; i++ { regexp.MatchString("auctor", haystack) } } Before you are two benchmarks, each of which N does a search for a substring in a string. One does this using a regular expression package, and the other using the strings package. We are looking for the word auctor.
Run the benchmark and look at the results.
$ go test -bench=. testing: warning: no tests to run BenchmarkSubstring-8 10000000 194 ns/op BenchmarkRegex-8 200000 7516 ns/op PASS ok github.com/mkevac/perftest00 3.789s The result is expected, because Regular expressions are much more powerful and therefore slower, but let's try to profile this code.
The easiest way to use the profiler in this case is to run the same benchmark with the additional option -cpuprofile cpu.out . As a result, the cpu.out file will appear in the directory with the results of the profiling and the binary, which is necessary for getting characters, disassembling, etc.
The binary is actually always created, but in the usual case it is created in the temporary directory and deleted immediately after the execution of the benchmark. In the case of a start with profiling, the resulting binary is not deleted.
So, let's run BenchmarkRegex Benchmark with profiling:
$ GOGC=off go test -bench=BenchmarkRegex -cpuprofile cpu.out testing: warning: no tests to run BenchmarkRegex-8 200000 6773 ns/op PASS ok github.com/mkevac/perftest00 1.491s As you can see, I launched the benchmark with the prefix GOGC = off at the beginning. The environment variable GOGC, set to off, disables the garbage collector. I did it consciously, so that the garbage collector and its stack traces did not distract us from the course of my story.
By the way, disabling GC for short-lived scripts and programs is an excellent solution that can reduce the program runtime at times. And not only in Go. For PHP, we also sometimes use this "trick", as far as I know. In fact, we reduce the running time due to the memory used on the server.
We now use the pprof utility to visualize the call graph.
$ go tool pprof perftest00.test cpu.out The easiest way to get a graph is the web command, which automatically saves the SVG image to a temporary directory and launches the browser to display it.
If you are working on a remote server, this option will not work. You need to either proxy the X server using the -Y switch for SSH, or save the SVG file to disk with the command go tool pprof -svg ./perftest00.test ./cpu.out> cpu.svg , copy it to your computer and there open up.
In the case of OSX, like mine, you will need to install an XQuartz X server in order for it to work through SSH.
Let's look at the resulting call graph.
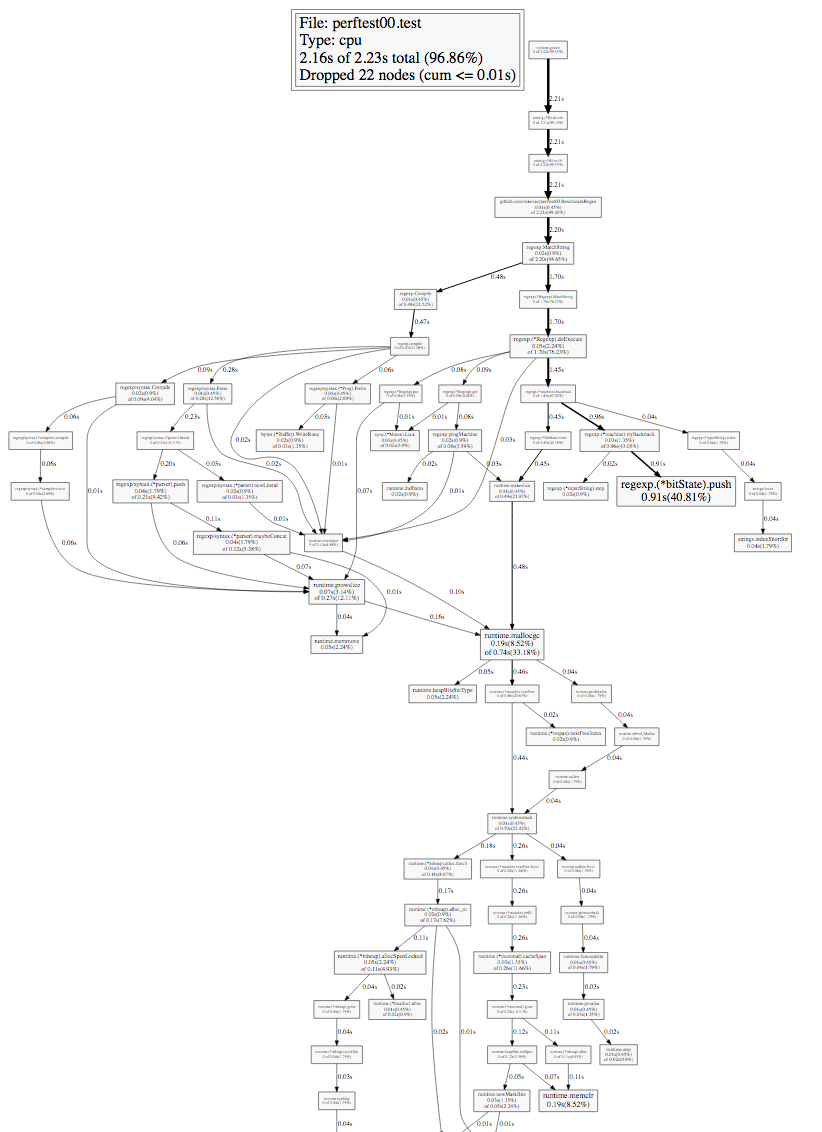
Studying such a graph, first of all you need to pay attention to the thickness of the edges (arrows) and the size of the nodes of the graph (squares). The time is signed on the edges: how long the given node or any of the lower nodes was in the stack trace during the profiling.
Let's go on the bold arrows from the very first (top) node and get to the first fork.
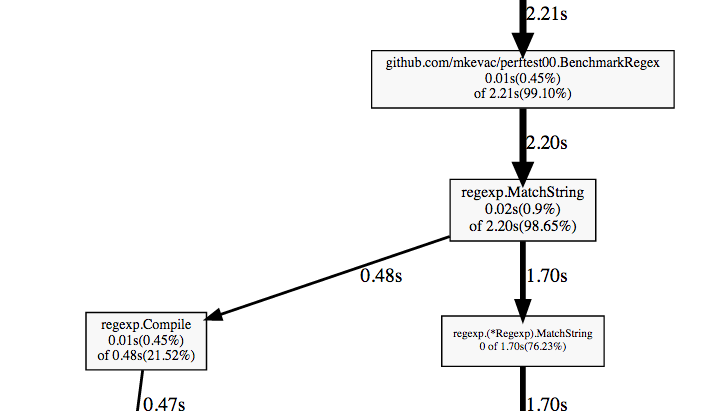
We see our BenchmarkRegex function, we see the regexp.MatchString function that we call, and we see that it splits.
If you have ever used regular expressions, then you most likely know that most implementations divide the process into the compilation stage of the initial string representation of the regular expression into some kind of intermediate variant and the actual use of this intermediate variant.
A trivial optimization suggests itself: compile once, not repeatedly.
Let's do it:
package perftest import ( "regexp" "strings" "testing" ) var haystack = `Lorem ipsum dolor sit amet, consectetur adipiscing [...] Vivamus vitae nulla posuere, pellentesque quam posuere` var pattern = regexp.MustCompile("auctor") func BenchmarkSubstring(b *testing.B) { for i := 0; i < bN; i++ { strings.Contains(haystack, "auctor") } } func BenchmarkRegex(b *testing.B) { for i := 0; i < bN; i++ { pattern.MatchString(haystack) } } And see what has changed:
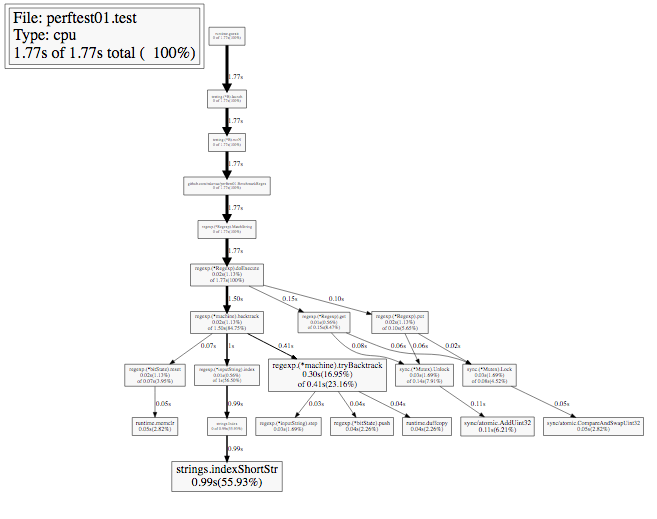
$ go test -bench=. testing: warning: no tests to run BenchmarkSubstring-8 10000000 170 ns/op BenchmarkRegex-8 5000000 297 ns/op PASS ok github.com/mkevac/perftest01 3.685s As you can see, the variant with regular expressions has accelerated by an order of magnitude and came close to the variant with a simple search for substrings.
But how did the call graph change? He became "much simpler", because compilation is now done only once. Moreover, the compilation call did not fall into the graph at all, since profiling is sampling.
Fine. Let's see what other ways we have in order to run the Go-profiler CPU.
Ways to start profiler
One of the ways we have already seen is the -cpuprofile parameter for the go test command .
We can also run the profiler manually using the functions pprof.StartCPUProfile () and pprof.StopCPUProfile () . It is a bit easier to use a very convenient wrapper over these functions from Dave Cheney (English Dave Cheney ) ( https://github.com/pkg/profile ), which will create a file for you, write to it, etc.
And another great method is to use the net / http / pprof package. If you import it, it will automatically add an HTTP handler for the URL / debug / pprof , and you can profile the running program remotely using the same go tool pprof. Let's see what it looks like.
Let's write a simple example:
package main import ( "net/http" _ "net/http/pprof" ) func cpuhogger() { var acc uint64 for { acc += 1 if acc&1 == 0 { acc <<= 1 } } } func main() { go http.ListenAndServe("0.0.0.0:8080", nil) cpuhogger() } As you can see, we imported the net / http / pprof package and started the HTTP server using the http.ListenAndServe () command. This is enough to use the profiler while the program is running.
Let's now run the program and use the profiler:
$ go tool pprof http://localhost:8080/debug/pprof/profile?seconds=5 As you can see, we simply pass to the pprof utility the path to the handler, on which the profiler “listens”. Additionally, you can transfer the profiler time (30 seconds by default).
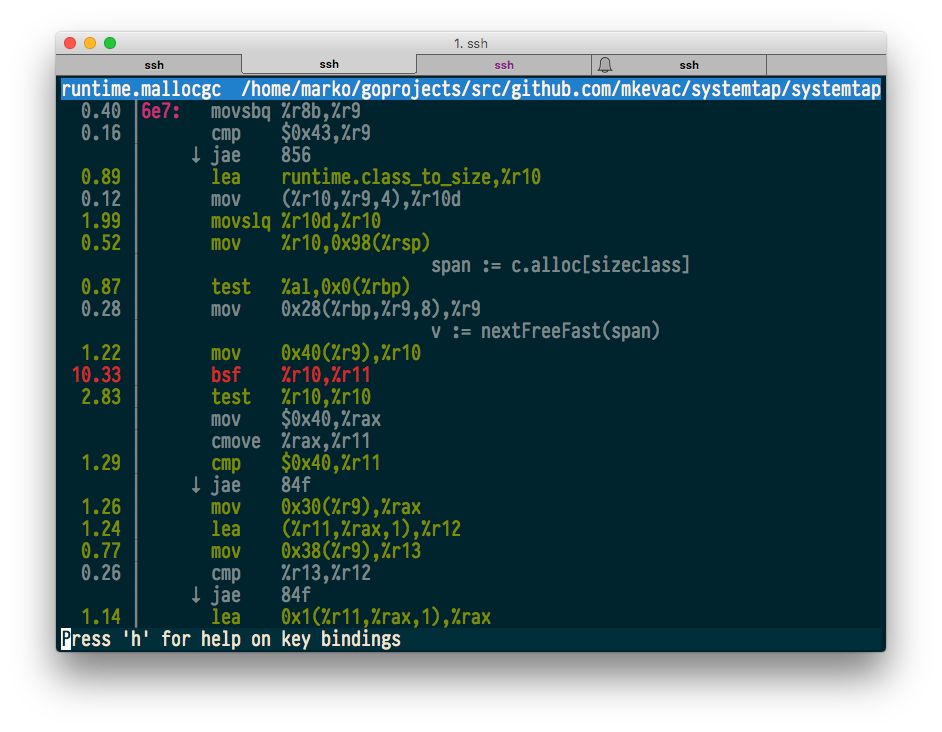
The web command works fine, the top command works fine, but the list and disasm say that there is no information about the source code of the program:
(pprof) web (pprof) top 4.99s of 4.99s total ( 100%) flat flat% sum% cum cum% 4.99s 100% 100% 4.99s 100% main.cpuhogger 0 0% 100% 4.99s 100% runtime.goexit 0 0% 100% 4.99s 100% runtime.main (pprof) list cpuhogger Total: 4.99s No source information for main.cpuhogger To get the source code information, we need to run pprof a little differently. You need to give him the path to the binary:
$ go tool pprof pproftest http://localhost:8080/debug/pprof/profile?seconds=5 Now we can use both the list and the disasm and make sure that the reality coincides with the expectations.
(pprof) list cpuhogger Total: 4.97s ROUTINE ======================== main.cpuhogger in /home/marko/goprojects/src/github.com/mkevac/pproftest/main.go 4.97s 4.97s (flat, cum) 100% of Total . . 6:) . . 7: . . 8:func cpuhogger() { . . 9: var acc uint64 . . 10: for { 2.29s 2.29s 11: acc += 1 1.14s 1.14s 12: if acc&1 == 0 { 1.54s 1.54s 13: acc <<= 1 . . 14: } . . 15: } . . 16:} . . 17: . . 18:func main() { (pprof) disasm cpuhogger Total: 4.97s ROUTINE ======================== main.cpuhogger 4.97s 4.97s (flat, cum) 100% of Total . . 401000: XORL AX, AX 1.75s 1.75s 401002: INCQ AX 1.14s 1.14s 401005: TESTQ $0x1, AX . . 40100b: JNE 0x401002 1.54s 1.54s 40100d: SHLQ $0x1, AX 540ms 540ms 401010: JMP 0x401002 . . 401012: INT $0x3 Let's dig deeper for the sake of interest. We will download what the URL returns on its own:
$ curl http://localhost:8080/debug/pprof/profile?seconds=5 -o /tmp/cpu.log We see that inside /tmp/cpu.log is the same binary data that is returned when using go tool test -cpuprofile or StartCPUProfile (). "Let us incite" the strings command on this binary file and understand that there are no function names or so-called symbols inside.
$ strings /tmp/cpu.log | grep cpuhogger Where, then, in the first case, when we started pprof without a binary, were the names of the functions obtained? It turns out that when importing net / http / pprof , one more URL / debug / pprof / symbol is added , which returns its name to the address of the function. Using queries to this URL, the pprof command gets the names of the functions.
But this URL does not return the source code of the function, nor disassembled. To disassemble, we need a binary, and for the source code, we need both a binary and the source code on the disk itself.
Be careful: the binary to be transferred and the source code must be exactly those that are running. Otherwise, you may not receive the data that you expect at all, and you will look for problems where there are none.
How does pprof work?
Let us, out of curiosity, see how pprof works and what disadvantages the approach used has.
In order to ensure the work of many programs at the same time, modern desktop and server operating systems implement the so-called preemptive multitasking. The program is allocated a specific time period and a specific processor on which it runs. After this time, the OS displaces the program and starts another one in its place, if it is ready for operation.
But how exactly is the interrupt feature implemented? After all, the OS is almost the same program. The thing is that the OS asks the iron to send a signal to it with a certain frequency and assigns a handler to this signal. When the signal arrives, the processor stops everything that is currently running on it, and starts the specified handler. In this handler, the OS may or may not force out the current process, replace it with another, etc.
The Go profiler works the same way. Go runtime asks the OS to send a signal (man setitimer) with a certain periodicity and assigns a handler to this signal. The handler takes the stack-trace of all goroutines (eng. Goroutines ), some additional information, writes it to the buffer and exits.
It is with a bug in the process of delivering signals to certain threads that the problem is with previous versions of OS X.
What are the disadvantages of this approach?
- Each signal is a change in context. The thing is quite expensive in our time. Therefore, at present it is realistic to receive no more than 500 signals per second. The standard value in Go now is 100 per second. Sometimes this is not enough.
- For non-standard builds, for example, using -buildmode = c-archive or -buildmode = c-shared , the profiler will not work by default. This is due to the fact that the signal SIGPROF, which sends the OS, will come to the main program flow, which is not controlled by Go.
- The user space process, which is a Go program, cannot get a nuclear stack-trace. Non-optimalities and problems sometimes lie in the core.
The main advantage, of course, is that the Go runtime has full information about its internal structure. External means, for example, by default do not know anything about gorutines. For them, there are only processes and threads.
System Profilers
We looked at how the go profiler works. Let's take a look at how standard perf and SystemTap Linux profilers are applicable.
Take the very first program from the article, just turn it from benchmarks into a regular program that works endlessly.
package main import ( "regexp" "strings" ) var haystack = `Lorem ipsum dolor sit amet, consectetur adipiscing [...] Vivamus vitae nulla posuere, pellentesque quam posuere` func UsingSubstring() bool { found := strings.Contains(haystack, "auctor") return found } func UsingRegex() bool { found, _ := regexp.MatchString("auctor", haystack) return found } func main() { go func() { for { UsingSubstring() } }() for { UsingRegex() } } SystemTap
SystemTap is a very powerful profiler that allows you to write small programs in pseudo language. This program is then automatically converted to C, assembled as a Linux kernel module, loaded, running and unloaded.
Let's see if SystemTap sees our functions:
$ stap -l 'process("systemtap").function("main.*")' process("systemtap").function("main.UsingRegex@main.go:16") process("systemtap").function("main.UsingSubstring@main.go:11") process("systemtap").function("main.init@main.go:32") process("systemtap").function("main.main.func1@main.go:22") process("systemtap").function("main.main@main.go:21") Sees All our functions have a main prefix, as expected.
Let's try to measure the time of our two functions and display the results in the form of a histogram.
Let's write the following simple script in SystemTap-language. It remembers the time at the entrance to the function, measures the time at the output, calculates the difference and saves it. After completing the work, he prints this information.
global etime global intervals probe $1.call { etime = gettimeofday_ns() } probe $1.return { intervals <<< (gettimeofday_ns() - etime)/1000 } probe end { printf("Duration min:%dus avg:%dus max:%dus count:%d\n", @min(intervals), @avg(intervals), @max(intervals), @count(intervals)) printf("Duration (us):\n") print(@hist_log(intervals)); printf("\n") } Run the program in one terminal and stap in the other.
$ sudo stap main.stap 'process("systemtap").function("main.UsingSubstring")' ^CDuration min:0us avg:1us max:586us count:1628362 Duration (us): value |-------------------------------------------------- count 0 | 10 1 |@@@@@@@@@@@@@@@@@@@@@@@@@@@@@@@@@@@@@@@@@@@@@@@@@ 1443040 2 |@@@@@ 173089 4 | 6982 8 | 4321 16 | 631 32 | 197 64 | 74 128 | 13 256 | 4 512 | 1 1024 | 0 2048 | 0 We got the result, but the program fell with an error, having worked quite a bit.
$ ./systemtap runtime: unexpected return pc for main.UsingSubstring called from 0x7fffffffe000 fatal error: unknown caller pc runtime stack: runtime.throw(0x494e40, 0x11) /home/marko/go/src/runtime/panic.go:566 +0x8b runtime.gentraceback(0xffffffffffffffff, 0xc8200337a8, 0x0, 0xc820001d40, 0x0, 0x0, 0x7fffffff, 0x7fff2fa88030, 0x0, 0x0, ...) /home/marko/go/src/runtime/traceback.go:311 +0x138c runtime.scanstack(0xc820001d40) /home/marko/go/src/runtime/mgcmark.go:755 +0x249 runtime.scang(0xc820001d40) /home/marko/go/src/runtime/proc.go:836 +0x132 runtime.markroot.func1() /home/marko/go/src/runtime/mgcmark.go:234 +0x55 runtime.systemstack(0x4e4f00) /home/marko/go/src/runtime/asm_amd64.s:298 +0x79 runtime.mstart() /home/marko/go/src/runtime/proc.go:1087 I found a thread about it on go-nuts , and there is no solution yet. Judging by everything, how SystemTap changes the program code to intercept functions, I don’t like the Go runtime when I get the stack trace in GC.
The same problem is present in C ++ when handling exceptions . Uretprobes is not perfect.
Well, but it turns out that if you do not use .return sample, then everything is in order? Let's try.
Here is a program that takes random numbers, converts them into a string, and puts them in a buffer:
package main import ( "bytes" "fmt" "math/rand" "time" ) func ToString(number int) string { return fmt.Sprintf("%d", number) } func main() { r := rand.New(rand.NewSource(time.Now().UnixNano())) var buf bytes.Buffer for i := 0; i < 1000; i++ { value := r.Int() % 1000 value = value - 500 buf.WriteString(ToString(value)) } } We will write a script that builds the distribution of numbers that we convert to a string.
global intervals probe process("systemtap02").function("main.ToString").call { intervals <<< $number } probe end { printf("Variables min:%dus avg:%dus max:%dus count:%d\n", @min(intervals), @avg(intervals), @max(intervals), @count(intervals)) printf("Variables:\n") print(@hist_log(intervals)); printf("\n") } The program, unlike the previous one, does not use a .return probe, but it takes and uses the number argument.
Run and see what happened:
$ sudo stap main.stap -c ./systemtap02 Variables min:-499us avg:8us max:497us count:1000 Variables: value |-------------------------------------------------- count -1024 | 0 -512 | 0 -256 |@@@@@@@@@@@@@@@@@@@@@@@@@@@@@@@@@@@@@@@@@ 249 -128 |@@@@@@@@@@@@@@@@@@@@ 121 -64 |@@@@@@@@@@ 60 -32 |@@@@@@ 36 -16 |@@ 12 -8 |@ 8 -4 | 5 -2 | 3 -1 | 2 0 | 2 1 | 2 2 | 3 4 |@ 7 8 | 4 16 |@@@ 20 32 |@@@@@ 33 64 |@@@@@@@ 44 128 |@@@@@@@@@@@@@@@@@@ 110 256 |@@@@@@@@@@@@@@@@@@@@@@@@@@@@@@@@@@@@@@@@@@@@@@ 279 512 | 0 1024 | 0 We have a beautiful schedule with distribution.
Perf
The perf utility and the perf_events subsystem are currently the default Linux profiler. Source codes and development are mostly kernel repositories and go flush with the kernel.
perf top is a command that, similar to top, shows the hottest code in real time. Run our test program and see what perf top will show.
$ sudo perf top -p $(pidof systemtap) 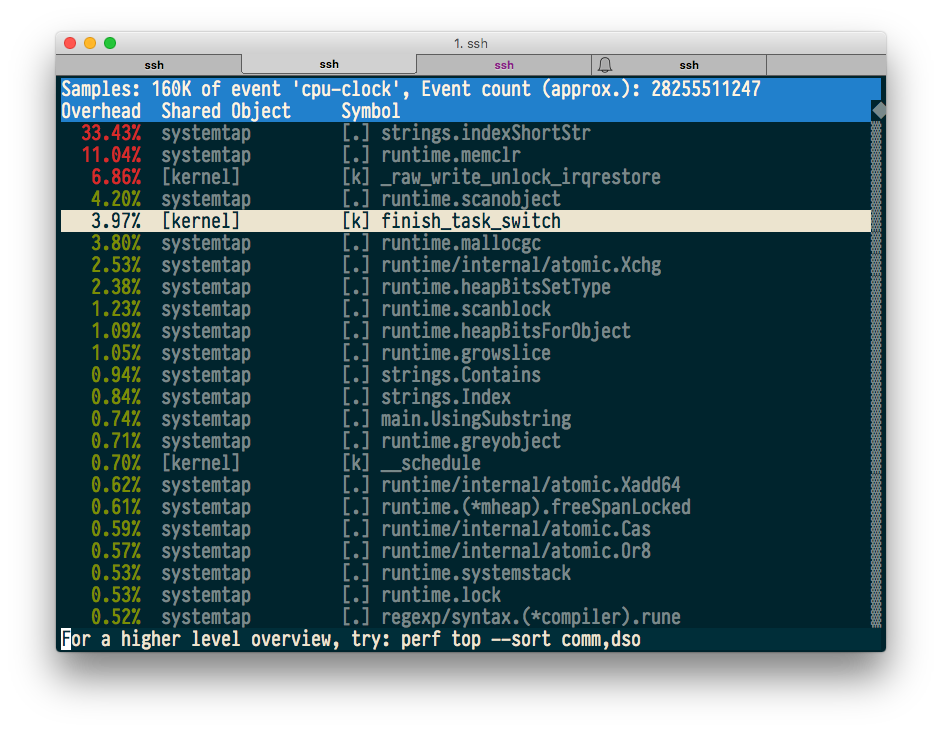
Everything seems to be fine, and even the source and machine code annotations work.
Now let's try to build the so-called FlameGraph , which was popularized by Brendan Gregg (English Brendan Gregg ). Brendan is currently working at Netflix and is one of the main popularizers and "engine" of innovations in the field of profiling for Linux.
Again, run the program and assemble the stack traces in 10 seconds into the file:
$ sudo perf record -F 99 -g -p $(pidof systemtap) -- sleep 10 [ perf record: Woken up 1 times to write data ] [ perf record: Captured and wrote 0.149 MB perf.data (1719 samples) ] We use the utilities from Brendan to convert perf data to FlameGraph.
$ sudo perf script | ~/tmp/FlameGraph/stackcollapse-perf.pl > out.perf-folded $ ~/tmp/FlameGraph/flamegraph.pl out.perf-folded > perf-kernel.svg And that's what happened with us:
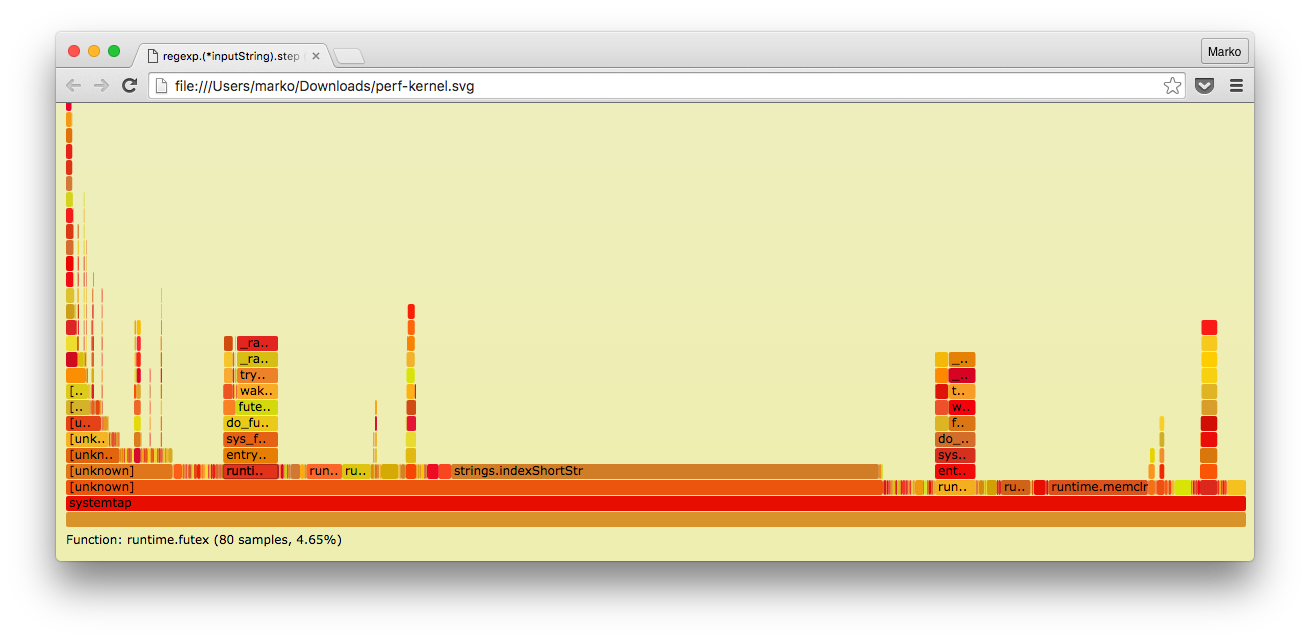
As you can see, unlike the profiler built into Go, here we also have a kernel stack trace.
Memory
If we were programming in C or C ++, how would we profile memory usage?
In the C / C ++ world, there is Valgrind, a utility that is designed to look for errors when using memory: leakage, going beyond the array boundary, using already freed memory, and a lot more. All this we do not need, because in Go, the absence of such problems is guaranteed (except when using cgo, of course).
But Valgrind is also able to show memory consumption in the form of a convenient time schedule using the built-in Massif subsystem.
If you take a simple C program that simply allocates and then frees up 20 MiB of memory
#include <stdlib.h> #include <unistd.h> #include <string.h> int main() { const size_t MB = 1024*1024; const unsigned count = 20; char **buf = calloc(count, sizeof(*buf)); for (unsigned i = 0; i < count; i++) { buf[i] = calloc(1, MB); memset(buf[i], 0xFF, MB); sleep(1); } for (unsigned i = 0; i < count; i++) { free(buf[i]); sleep(1); } free(buf); } and run it under Massif, we will get something like this graph with stack traces in those places where memory allocations were initiated:
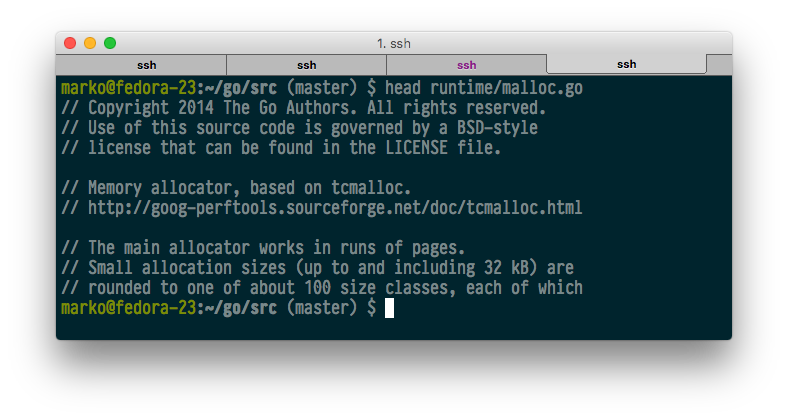
-------------------------------------------------------------------------------- Command: ./main Massif arguments: --pages-as-heap=yes --time-unit=ms ms_print arguments: massif.out.15091 -------------------------------------------------------------------------------- MB 26.20^ :: | ::: # | @@: : #:: | ::@ : : #: :: | ::::: @ : : #: : :::: | :: : : @ : : #: : : : :: | :::: : : @ : : #: : : : : : | ::::: :: : : @ : : #: : : : : ::::: | ::: : : :: : : @ : : #: : : : : :: : @@ | ::: : : : :: : : @ : : #: : : : : :: : @ :: | ::@: : : : : :: : : @ : : #: : : : : :: : @ : ::: | ::: @: : : : : :: : : @ : : #: : : : : :: : @ : : ::: | ::: : @: : : : : :: : : @ : : #: : : : : :: : @ : : :: :: | ::: : : @: : : : : :: : : @ : : #: : : : : :: : @ : : :: : :: | ::::: : : : @: : : : : :: : : @ : : #: : : : : :: : @ : : :: : : :::: |:: : : : : : @: : : : : :: : : @ : : #: : : : : :: : @ : : :: : : : : : |@: : : : : : @: : : : : :: : : @ : : #: : : : : :: : @ : : :: : : : : :@ |@: : : : : : @: : : : : :: : : @ : : #: : : : : :: : @ : : :: : : : : :@ |@: : : : : : @: : : : : :: : : @ : : #: : : : : :: : @ : : :: : : : : :@ |@: : : : : : @: : : : : :: : : @ : : #: : : : : :: : @ : : :: : : : : :@ 0 +----------------------------------------------------------------------->s 0 39.13 Number of snapshots: 66 Detailed snapshots: [9, 10, 20, 22, 32, 42, 45 (peak), 55, 65] Massif works in such a way that it overrides the main functions for working with memory (malloc, calloc, realloc, memalign, new, new []) with its own.
Go does not use any of these functions. The Go source implements its own allocator, which requests memory directly from the OS using the mmap or sbrk system calls, and already breaks it up into smaller pieces on its own.
Valgrind can catch mmap / sbrk if asked for it with a special command line parameter, but it's still useless, because, firstly, we will not see these smallest selections and releases, and, secondly, we will not understand which memory is no longer referenced, and which is still “live”.
Other common utilities in the C / C ++ world are also practically useless, since most of them work in a similar way, i.e. by intercepting memory allocation and release functions.
Options, in fact, two:
- theoretically, we can intercept the functions of allocating and freeing memory from the Go runtime with something external to the Go program (for example, perf or SystemTap) and try to understand something based on these calls;
- use the built-in go runtime memory usage.
Go is able to collect information about memory allocations at regular intervals. This frequency can be set manually, but by default it is 1 time per 512 kilobytes of allocated memory.
As usual, let's look at an example.
Example
Similar to processor profiling, memory profiling can be started using go test , direct runtime.MemProfile () calls or using the net / http / pprof package . This time, let's use the last option.
So, before you is a program that in one of the gorutin constantly allocates arrays and stores them in another array, and in the other gorutin does the same, but periodically “forgets” about the array of arrays:
package main import ( "net/http" _ "net/http/pprof" "time" ) func allocAndKeep() { var b [][]byte for { b = append(b, make([]byte, 1024)) time.Sleep(time.Millisecond) } } func allocAndLeave() { var b [][]byte for { b = append(b, make([]byte, 1024)) if len(b) == 20 { b = nil } time.Sleep(time.Millisecond) } } func main() { go allocAndKeep() go allocAndLeave() http.ListenAndServe("0.0.0.0:8080", nil) } Those. , , , .
, .
go tool pprof , :
- alloc_space — ;
- alloc_objects — ;
- inuse_space — ;
- inuse_objects — .
, — .
, inuse allocAndKeep(), alloc :
$ go tool pprof -inuse_space memtest http://localhost:8080/debug/pprof/heap Fetching profile from http://localhost:8080/debug/pprof/heap Saved profile in /home/marko/pprof/pprof.memtest.localhost:8080.inuse_objects.inuse_space.005.pb.gz Entering interactive mode (type "help" for commands) (pprof) top 15.36MB of 15.36MB total ( 100%) Dropped 2 nodes (cum <= 0.08MB) flat flat% sum% cum cum% 15.36MB 100% 100% 15.36MB 100% main.allocAndKeep 0 0% 100% 15.36MB 100% runtime.goexit $ go tool pprof -alloc_space memtest http://localhost:8080/debug/pprof/heap Fetching profile from http://localhost:8080/debug/pprof/heap Saved profile in /home/marko/pprof/pprof.memtest.localhost:8080.alloc_objects.alloc_space.008.pb.gz Entering interactive mode (type "help" for commands) (pprof) top 54.49MB of 54.49MB total ( 100%) Dropped 8 nodes (cum <= 0.27MB) flat flat% sum% cum cum% 27.97MB 51.33% 51.33% 29.47MB 54.08% main.allocAndKeep 23.52MB 43.17% 94.49% 25.02MB 45.92% main.allocAndLeave 3MB 5.51% 100% 3MB 5.51% time.Sleep 0 0% 100% 54.49MB 100% runtime.goexit . , Sleep() - . Consider more.
(pprof) list time.Sleep Total: 54.49MB ROUTINE ======================== time.Sleep in /home/marko/go/src/runtime/time.go 3MB 3MB (flat, cum) 5.51% of Total . . 48:func timeSleep(ns int64) { . . 49: if ns <= 0 { . . 50: return . . 51: } . . 52: 3MB 3MB 53: t := new(timer) . . 54: t.when = nanotime() + ns . . 55: tf = goroutineReady . . 56: t.arg = getg() . . 57: lock(&timers.lock) . . 58: addtimerLocked(t) , , time.Sleep() new().
(1)
, , — . , .
, .
package printtest import ( "bytes" "fmt" "testing" ) func BenchmarkPrint(b *testing.B) { var buf bytes.Buffer var s string = "test string" for i := 0; i < bN; i++ { buf.Reset() fmt.Fprintf(&buf, "string is: %s", s) } } fmt.Fprintf() .
-benchmem test .
$ go test -bench=. -benchmem testing: warning: no tests to run BenchmarkPrint-8 10000000 128 ns/op 16 B/op 1 allocs/op PASS ok github.com/mkevac/converttest 1.420s , 1 16 . ?
:
$ go test -bench=. -memprofile=mem.out -memprofilerate=1 memprofilerate , . , . , . .
:
$ go tool pprof -alloc_space converttest.test mem.out (pprof) top 15.41MB of 15.48MB total (99.59%) Dropped 73 nodes (cum <= 0.08MB) flat flat% sum% cum cum% 15.41MB 99.59% 99.59% 15.43MB 99.67% github.com/mkevac/converttest.BenchmarkPrint 0 0% 99.59% 15.47MB 99.93% runtime.goexit 0 0% 99.59% 15.42MB 99.66% testing.(*B).launch 0 0% 99.59% 15.43MB 99.67% testing.(*B).runN , 15 MiB . Where?
(pprof) list BenchmarkPrint Total: 15.48MB ROUTINE ======================== github.com/mkevac/converttest.BenchmarkPrint in /home/marko/goprojects/src/github.com/mkevac/converttest/convert_test.go 15.41MB 15.43MB (flat, cum) 99.67% of Total . . 9:func BenchmarkPrint(b *testing.B) { . . 10: var buf bytes.Buffer . . 11: var s string = "test string" . . 12: for i := 0; i < bN; i++ { . . 13: buf.Reset() 15.41MB 15.43MB 14: fmt.Fprintf(&buf, "string is: %s", s) . . 15: } . . 16:} fmt.Fprintf(). Good. ?
(pprof) list fmt.Fprintf Total: 15.48MB ROUTINE ======================== fmt.Fprintf in /home/marko/go/src/fmt/print.go 0 12.02kB (flat, cum) 0.076% of Total . . 175:// These routines end in 'f' and take a format string. . . 176: . . 177:// Fprintf formats according to a format specifier and writes to w. . . 178:// It returns the number of bytes written and any write error encountered. . . 179:func Fprintf(w io.Writer, format string, a ...interface{}) (n int, err error) { . 11.55kB 180: p := newPrinter() . 480B 181: p.doPrintf(format, a) . . 182: n, err = w.Write(p.buf) . . 183: p.free() . . 184: return . . 185:} . . 186: . , , … - . 15 , 12 . - .
:
. . 466edb: CALL bytes.(*Buffer).Reset(SB) . . 466ee0: LEAQ 0x98b6b(IP), AX . . 466ee7: MOVQ AX, 0x70(SP) . . 466eec: MOVQ $0xb, 0x78(SP) . . 466ef5: MOVQ $0x0, 0x60(SP) . . 466efe: MOVQ $0x0, 0x68(SP) . . 466f07: LEAQ 0x70d92(IP), AX . . 466f0e: MOVQ AX, 0(SP) . . 466f12: LEAQ 0x70(SP), AX . . 466f17: MOVQ AX, 0x8(SP) . . 466f1c: MOVQ $0x0, 0x10(SP) 15.41MB 15.41MB 466f25: CALL runtime.convT2E(SB) . . 466f2a: MOVQ 0x18(SP), AX . . 466f2f: MOVQ 0x20(SP), CX . . 466f34: MOVQ AX, 0x60(SP) . . 466f39: MOVQ CX, 0x68(SP) . . 466f3e: LEAQ 0x10b35b(IP), AX . . 466f45: MOVQ AX, 0(SP) . . 466f49: MOVQ 0x58(SP), AX . . 466f4e: MOVQ AX, 0x8(SP) . . 466f53: LEAQ 0x99046(IP), CX . . 466f5a: MOVQ CX, 0x10(SP) . . 466f5f: MOVQ $0xd, 0x18(SP) . . 466f68: LEAQ 0x60(SP), CX . . 466f6d: MOVQ CX, 0x20(SP) . . 466f72: MOVQ $0x1, 0x28(SP) . . 466f7b: MOVQ $0x1, 0x30(SP) . 12.02kB 466f84: CALL fmt.Fprintf(SB) - runtime.convT2E . What is it?
, fmt.Fprintf():
func Fprintf(w io.Writer, format string, a ...interface{}) (n int, err error) , . , , void* .
«» , .. . , ? Why? Go.
Go , string, chan, func, slice, interface .. .
, string, .. :
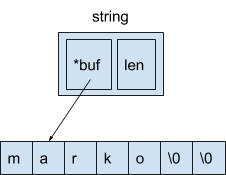
— 16 . 8 — , , , , 8 — .
interface. Interface 8- .
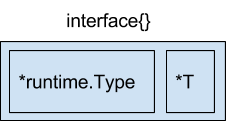
8 — , , 8 — .
var s string = "marko" var a interface{} = &s , 8 .
. , :
var s string = "marko" var a interface{} = s Go runtime.convT2E.
:
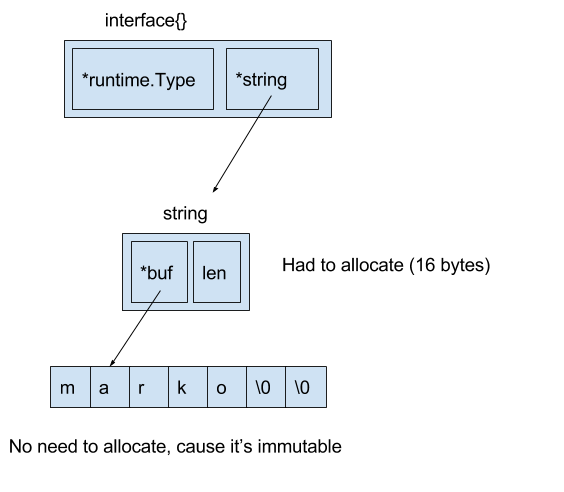
16 go test.
«» .
fmt.Fprintf :
package main import ( "bytes" "testing" ) func BenchmarkPrint(b *testing.B) { var buf bytes.Buffer var s string = "test string" for i := 0; i < bN; i++ { buf.Reset() buf.WriteString("string is: ") buf.WriteString(s) } } 0 :
$ go test -bench=BenchmarkPrint -benchmem testing: warning: no tests to run BenchmarkPrint-8 50000000 27.5 ns/op 0 B/op 0 allocs/op PASS ok github.com/mkevac/converttest01 1.413s 4 .
(2)
«» , cgo. ( char * ) — , , . , .
Go, , . — , .
package main import ( "fmt" ) func main() { var array = []byte{'m', 'a', 'r', 'k', 'o'} if string(array) == "marko" { fmt.Println("equal") } } , . . git-blame , . , , (do not escapes to heap), , .
. , , , , . runtime. , , , , 2010 , , .
.
- , Go- , escapes to heap.
:
package main import ( "bytes" "testing" "unsafe" ) var s string func BenchmarkConvert(b *testing.B) { var buf bytes.Buffer var array = []byte{'m', 'a', 'r', 'k', 'o', 0} for i := 0; i < bN; i++ { buf.Reset() s = string(array) buf.WriteString(s) } } $ go test -bench=. -benchmem testing: warning: no tests to run BenchmarkConvert-8 30000000 42.1 ns/op 8 B/op 1 allocs/op reflect unsafe.
func BytesToString(b []byte) string { bh := (*reflect.SliceHeader)(unsafe.Pointer(&b)) sh := reflect.StringHeader{bh.Data, bh.Len} return *(*string)(unsafe.Pointer(&sh)) } func BenchmarkNoConvert(b *testing.B) { var buf bytes.Buffer var array = []byte{'m', 'a', 'r', 'k', 'o', 0} for i := 0; i < bN; i++ { buf.Reset() s = BytesToString(array) buf.WriteString(s) } } .
$ go test -bench=. -benchmem testing: warning: no tests to run BenchmarkConvert-8 30000000 44.5 ns/op 8 B/op 1 allocs/op BenchmarkNoConvert-8 100000000 19.2 ns/op 0 B/op 0 allocs/op PASS ok github.com/mkevac/bytetostring 3.332s , Go — . , Go runtime , , , : , , , .. Go runtime/trace.go .
— . , Chrome -.
, , .
Example
- GC- debugcharts.
runtime.ReadMemStats() , GC- .
, « », debugcharts.
package main import ( "net/http" _ "net/http/pprof" "time" _ "github.com/mkevac/debugcharts" ) func CPUHogger() { var acc uint64 t := time.Tick(2 * time.Second) for { select { case <-t: time.Sleep(50 * time.Millisecond) default: acc++ } } } func main() { go CPUHogger() go CPUHogger() http.ListenAndServe("0.0.0.0:8181", nil) } trace, , .
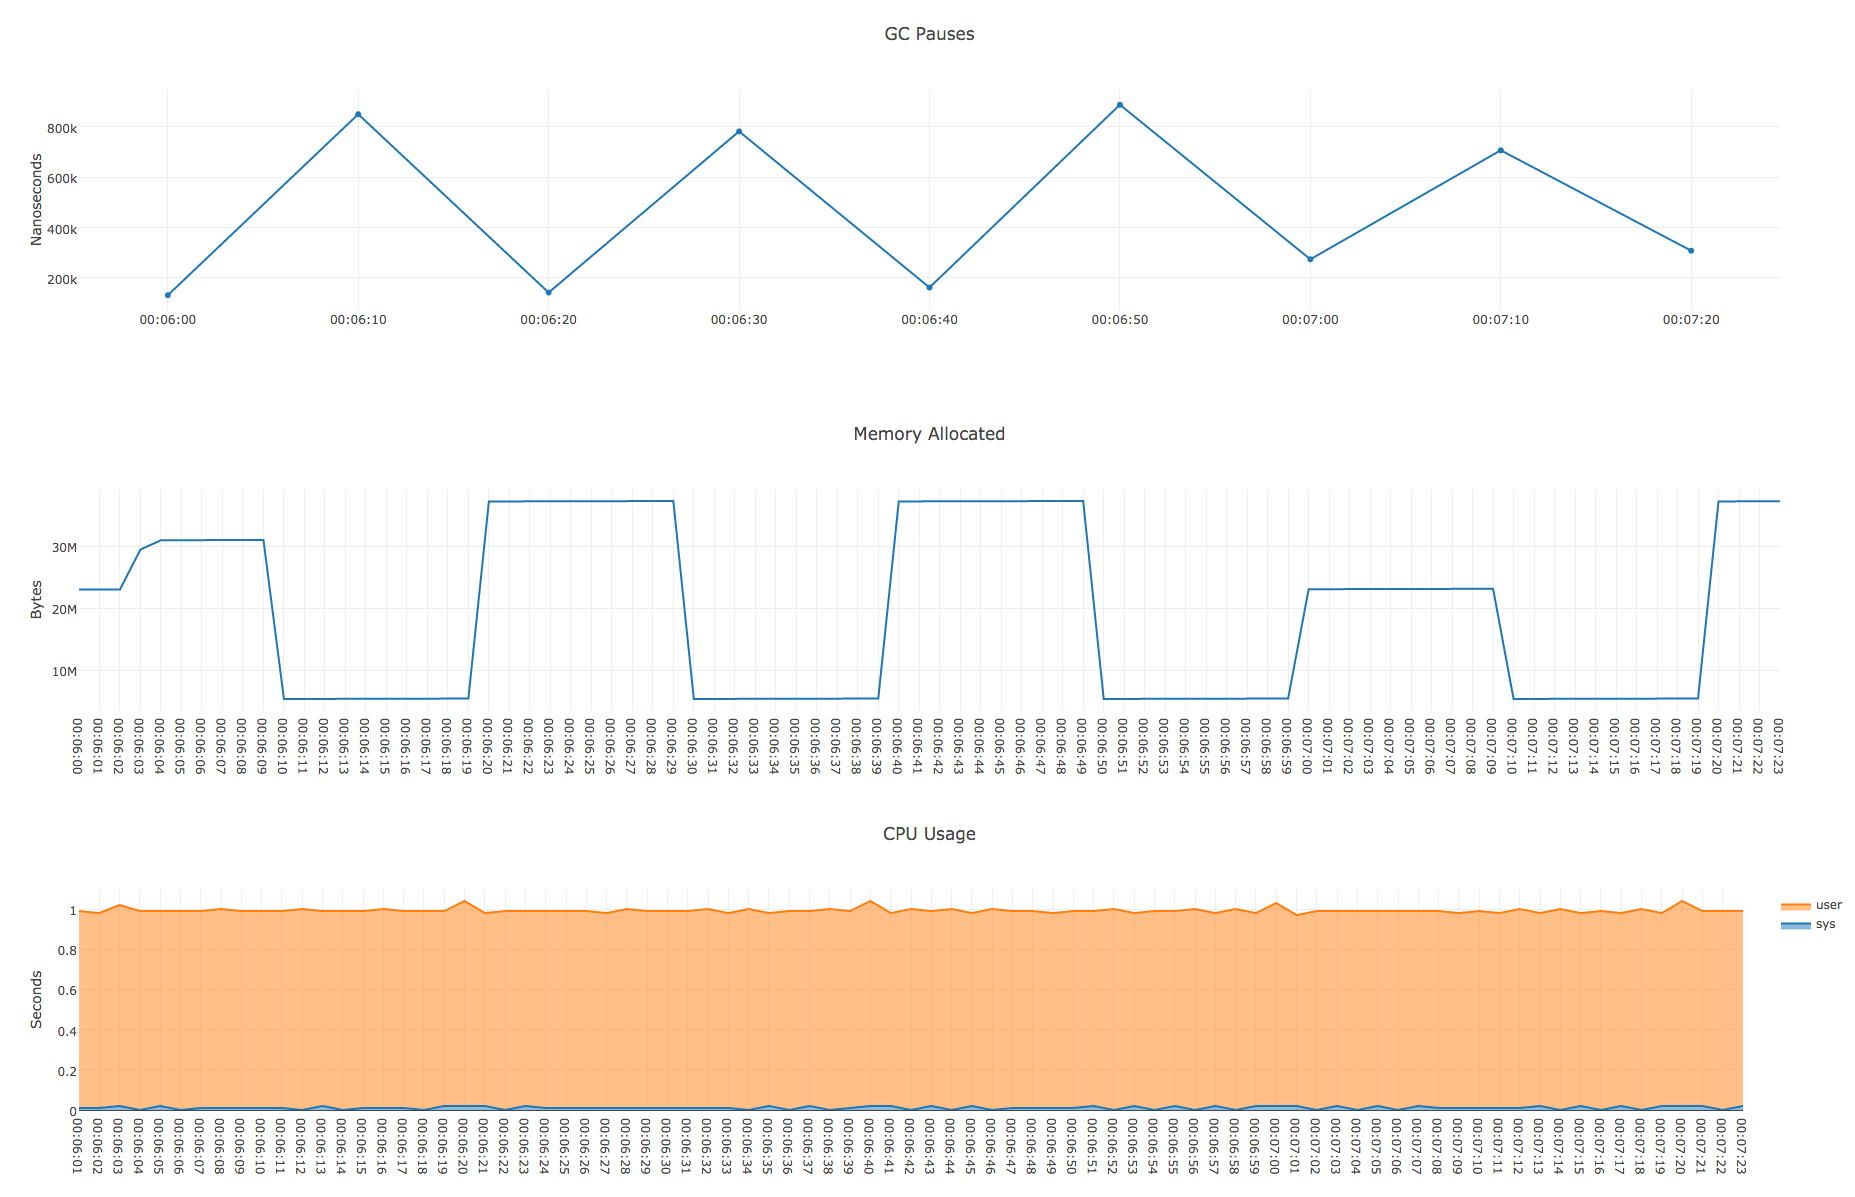
10 . : runtime - , 1-3 . , Chrome JavaScript .
curl http://localhost:8181/debug/pprof/trace?seconds=10 -o trace.out go tool trace , :
go tool trace -http "0.0.0.0:8080" ./tracetest trace.out , :
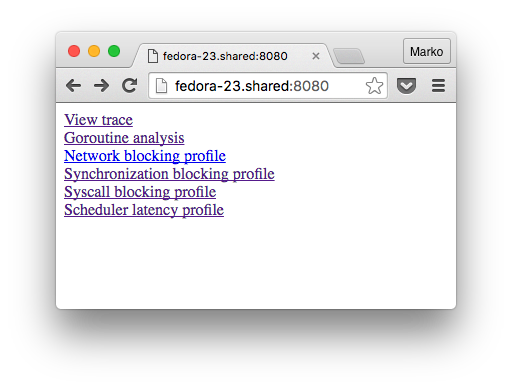
:
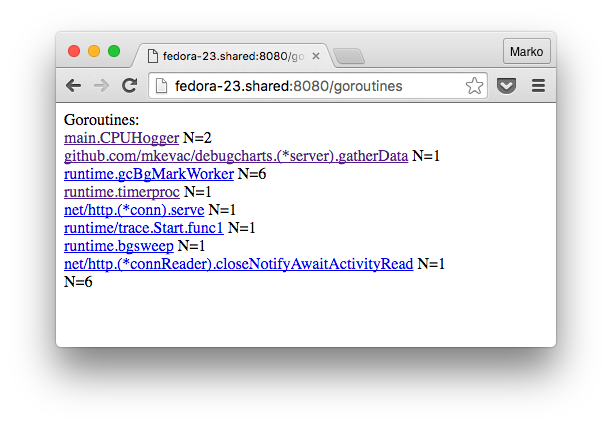
, , , . , , .
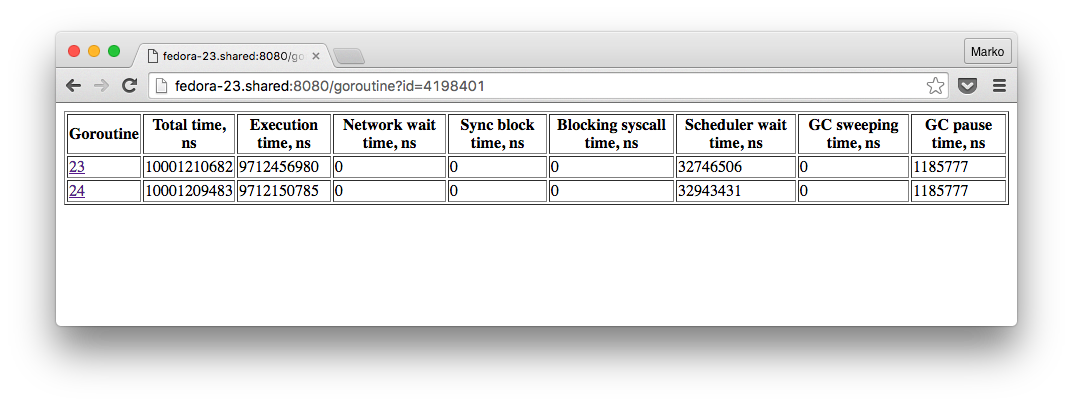
, , , , :

, 4 , , 2 50 , . , - , , , debugcharts. , .
, debugcharts:
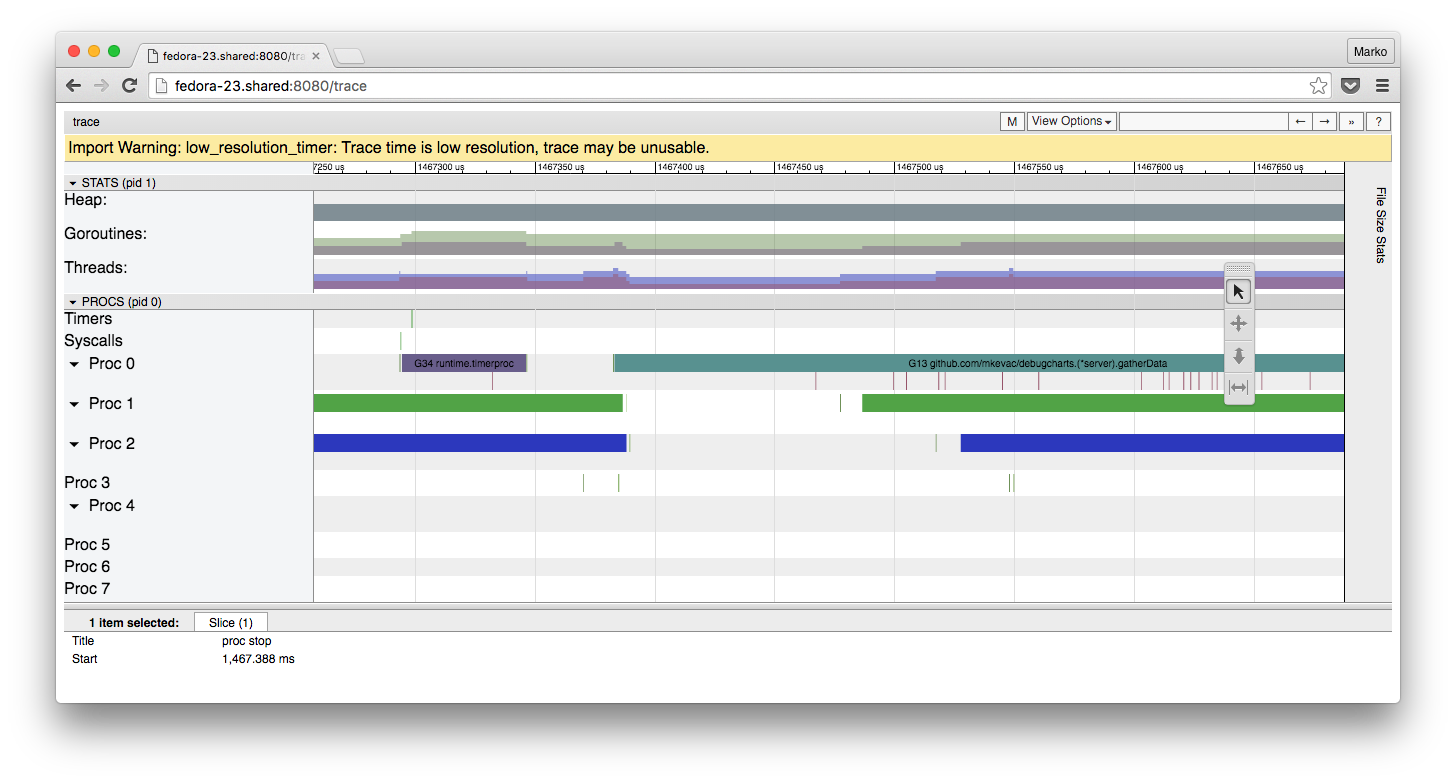
- . Debugcharts , , , . .
, , , proc stop proc start .
, , debugcharts . latency .
runtime.ReadMemStats() , .
180 // ReadMemStats populates m with memory allocator statistics. 181 func ReadMemStats(m *MemStats) { 182 stopTheWorld("read mem stats") 183 184 systemstack(func() { 185 readmemstats_m(m) 186 }) 187 188 startTheWorld() 189 } . .
, debugcharts .
Conclusion
, , .

, Go:
- CPU;
- ;
- ;
- escape-;
- ;
- ;
- ;
- ;
- , CPU GC .
, Go , , , .
Go, , . perf SystemTap. .
, — , , , — .
, . Stay curious!
, C/C++
Source: https://habr.com/ru/post/301990/
All Articles