IPython notebook data processing for SEO tasks

In performing the analytical tasks of SEO, SMM, marketing, we are faced with an excessively growing amount of data processing tools. Each is tailored to its capabilities or accessibility for the user: Excel and VBA, third-party SEO tools, PHP and MySQL, Python, C, Hive, and others. Various systems and data sources add problems: counters, advertising systems, CRM, webmaster tools of Yandex and Google, social networks, HDFS. A tool is needed that combines ease of setup and use, modules for receiving, processing and visualizing data, as well as working with various types of sources. The choice fell on iPython notebook (more recently Jupyter notebook), which is a platform for working with scripts in 40 programming languages. The platform is widely used for scientific computing, among specialists in data processing and machine learning. Unfortunately, Jupyter notebook is rarely used to automate and process marketing data.
For tasks of web analytics and data processing for SEO, Jupyter notebook is suitable for several reasons:
- easy setup
- processing and visualization of data without the need to write code
- with a lack of personal computer resources, you can simply run notebook on a more powerful virtual machine (for example, using Amazon Web Services) and calculate the necessary data without changing the script code
')
In this article, we will look at three examples that will help you start using Jupyter notebook for solving practical problems:
Yandex Metrics API
Often there are tasks of preparing reports on site visits, data for these reports can be collected automatically by setting up the system once. The time gain is obvious. In the example, let's see how to download the statistics of all search phrases for several projects from Yandex Metrics (in this case, getting all the statistics from the web interface is rather difficult).
Word2vec
There are complex algorithms for automatic processing of textual data, let's see how you can simply use them to analyze specifically your data. Tasks that can be solved using word2vec - search for typos in words, search for synonyms, search for "similar" words.
PageRank calculation
SMO specialists will be interested in how to use the PR calculation algorithm to find the most authoritative community members. Slightly changing the script settings as well you can find the page with the highest PageRank on your site. We will also see how to visualize users of the VKontakte group using D3js.
The report was presented at the first SEO Meetup “Data Driven SEO” on February 4 in Rambler & Co ( link to video ).
Ready-made codes of these examples can be taken on GitHub .
Install Jupyter notebook
For installation on a personal computer, only 2 actions are required:
1. Install the Anaconda python distribution
2. On the command line, run: conda install jupyter
To run notebook on the command line, run: jupyter notebook
In case of a successful installation in the browser, a view window will open:
Downloading reports from Yandex Metrics
( example code )
Let's see how to automatically unload data from the “Search phrases” report. The problems of manual unloading of such a report are quite obvious: Yandex Metrica cannot always unload the entire table at once (for large projects, the number of lines is in the hundreds of thousands), and regular uploading for several projects is, in principle, quite tiresome. For those who are unfamiliar with the python syntax, let’s analyze this example in detail.
habrastorage.org/files/385/ae6/980/385ae698096d4b7b9df4e116ede90525.jpg
We import the necessary library for requests to the API and working with the JSON format:
# -*- coding: utf-8 -*- import requests import json Ctrl + Enter - execute the line. Shift + Enter - execute the line and go to the next.
We get a token for requests to our counters:
1. On the page https://oauth.yandex.ru/ we start the application and give it permission to get statistics Yandex Metrics. Screenshots can be viewed in the article https://habrahabr.ru/post/265383/
2. Substitute the application ID in the URL https://oauth.yandex.ru/authorize?response_type=token&client_id=
As a result, we obtain an authorization token, which we will use in each request to Yandex Metric. Copy the received token to the token script variable.
We set the parameters of our upload:
project - a list of your counters, which will get the data (eight-digit number in the list of meters metrika.yandex.ru)
startDate and endDate - the date of the beginning and end of the unloading period in the format 'YYYY-MM-DD'. For example, startDate = '2016-01-31'
limit - how many lines will be unloaded per request. For example, if we have 500,000 rows in a report, then with the limit value = 10000 (the maximum value for the current API version), the script will make 50 queries to unload the entire table.
We clean the file in which the data will be written (so as not to do it manually with each new upload). The file name can be set by any:
f = open('search phrases.txt', 'w') f.close() Further in the cycle we go through all the numbers of the meters listed in the projects list:
for project in projects: For each number of the project counter, we start unloading from the first line (offset = 1), and in each cycle we increase this value by limit. Parameters in API requests (link to tech.yandex.ru/metrika/doc/api2/api_v1/intro-docpage documentation):
oauth_token - the token we received
id - counter number
accuracy = full - accuracy, the value of 'full' corresponds to the position of the slider 100%
dimensions and metrics - measurements (rows of the table) and metrics (columns)
The result (how to work with JSON https://docs.python.org/2/library/json.html ) is added to the delimited tab file (\ t). The final upload is copy-paste into familiar reports and tools like Excel.
Word2vec
( example code )
To use the Word2Vec library , first additionally install gensim pypi.python.org/pypi/gensim (not included in the Anaconda distribution by default). At the input of the model is a list of sentences from the original list of search phrases. That is, a sheet of the form [['watch', 'movies', 'online'], ['rate', 'ruble'], ...].
Next, set the model parameters:
- num_features - the dimension of the space of vectors. The larger the value, the more “accurate” the model will take into account the input data (sometimes increasing the dimension does not improve the quality of the model). Usually use values from 10 to several hundred. Accordingly, the larger the dimension, the more computing resources will be required.
- min_word_count - allows to take into account only frequently encountered words in the final dictionary of the model. Most often, values from 5 to 100 are taken. As a result, we will significantly reduce the size of the dictionary, leaving only words that have a practical meaning.
- num_workers - how many processes in parallel will build a model
- context - how many words in the context should be taken into account by the algorithm. Searches are very short "sentences"
- downsampling - exclude frequently occurring words in the text. Google recommends values from .00001 to .001
In this example, the model was built on 5 million. searches about 40 minutes on a laptop with 2GB of free RAM. This amount of data can be used for SEO tasks:
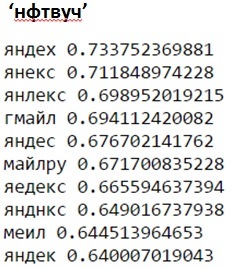
1. Search for typos and semantically close words (opposite to the word, the cosine measure of proximity of the corresponding vectors is indicated):
Types of typos and semantically close words for the query 'yandex' in the Russian layout:
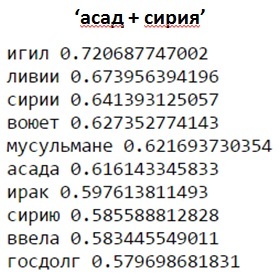
An example of close words to the query 'Syria + Asad':
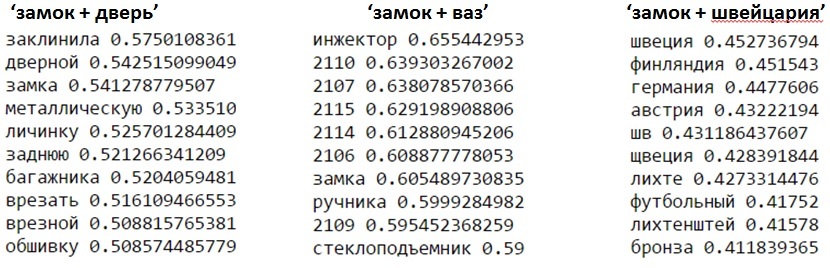
In phrases, you can distinguish requests for "meaning" (in terms of proximity of the corresponding vectors). Issuance for door and car locks will differ from the windows of Switzerland:
2. Finding relationships of entities. This model query will show words that apply to Russia as well as the dollar relates to the United States. It is logical that these should be the currencies related to Russia from search queries:

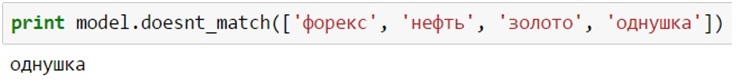
3. Definition of "extra" words in the list
The words "forex", "oil" and "gold" will be much closer to each other in the vector space from search queries than "odnushka":
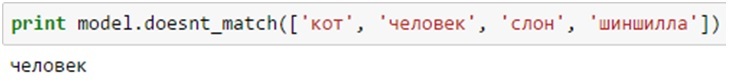
Similarly, from the list "cat", "man", "elephant", "chinchilla" a request without an "animal" attribute will be superfluous:
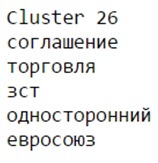
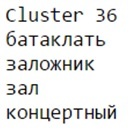
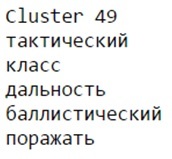
4. Automatic content clustering
Having a model built using Word2Vec, you can automatically cluster words in a vector space using popular clustering algorithms. For example, using the KMeans algorithm for the Lenta.ru model for 1000 texts, we obtain the main news items:
- embargo against Ukraine
- terrorist attacks in Paris (the word “bataklat” was obtained as a result of stemmer’s processing of the name of the theater “Bataclan”)
- C-400 in Syria
Working with graphs in Neworkx
(code for uploading data by API Vkontakte , processing and visualization )
In technical terms, graphs are a set of nodes interconnected by edges. In practice, users of a social network or a group of a site’s page can act as nodes. As edges - the presence of friendship between a couple of users, messages, marks like in the posts of the group, links to other pages of the site. The Networkx library allows you to build such graphs and count various graph characteristics. Let's look at the example of the VKontakte group how to calculate the PageRank of each user and visualize it in the browser.
As an example, one of the relatively small groups of 660 participants was taken (for visual visualization), in which many participants are familiar with each other. To build a graph, it’s enough to upload a list of group members (VKontakte groups.getMembers method), and then for each member, get a list of his friends (friends.get method). The result of the upload is recorded in a text file in the format:
{
User ID,
[friend list]
}
As a result, the nodes of the graph g are the IDs of the group members, and the edges are the IDs of the friends of this user. To calculate the PageRank, we use the function: x = networkx.pagerank (g). We display the top members of the group:

For visualization we use the library D3.js, force-collapcible . As the size of the node take its pagerank:
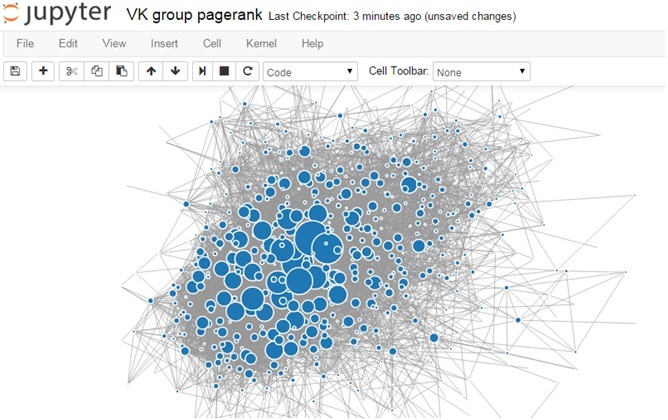
When hovering over a node, we can see which ID it belongs to. You can view detailed information about users by their ID using the users.get method: https://api.vk.com/method/users.get?user_id=12345
Source: https://habr.com/ru/post/301640/
All Articles