Which CMS spam more often?
The statistics is based on data from the antispam service CleanTalk , for the period from April 2015 to March 2016. The analysis was conducted on the following CMS: WordPress, Joomla, 1C Bitrix, Drupal, phpBB3.0, phpBB3.1, IP.Board, SimpleMachines, MediaWiki.
All POST requests processed by the service, such as comments, registrations, contact forms, orders, feedback and others, took part in the analysis.
Comments 65.5% of sites
Registration 53%
Contacts 68.5%
Other 45%
')
Contacts and comments 49%
Contact and registration 21%
Comments and Registrations 21%
Sites with:
1 form 23%
2 forms 34%
3 forms and more than 41%

As we can see, MediaWiki is very different from the rest of the CMS. In our opinion, such a significant gap is due to the fact that for this CMS there are no sufficiently effective remedies, and it is very difficult for administrators to track changes made to articles. This leads to the fact that spammers are convenient to place links in articles.
The low proportion of spam on phpBB is due to the relatively low prevalence of this platform.
It should be noted that in October 2015 we launched the SpamFireWall service, with some of the spam attacks blocked by them and not counted for the Anti-Spam service. It is also worth noting about SpamFireWall statistics, since not only POST requests are blocked, but also all GET requests to the site.
As can be seen from the graph, the number of spam on web sites is only growing and has some seasonality. In the summer and autumn, the growth of spam stops, or slightly decreases, but with the onset of winter, growth always begins.
Statistics show that the proportion of spam in the comments / registration / contacts, etc. exceeds 90%. In our opinion, spammers consider promotion links to be still effective, and if not to advance in search, then to attract the site’s audience to their resources.
About CleanTalk Service
CleanTalk is a cloud service to protect websites from spambots. CleanTalk uses protection methods that are invisible to website visitors. This allows you to abandon the methods of protection that require the user to prove that he is a person (captcha, question-answer, etc.).
All POST requests processed by the service, such as comments, registrations, contact forms, orders, feedback and others, took part in the analysis.
Distribution of the main forms on the sites:
Comments 65.5% of sites
Registration 53%
Contacts 68.5%
Other 45%
')
Contacts and comments 49%
Contact and registration 21%
Comments and Registrations 21%
Sites with:
1 form 23%
2 forms 34%
3 forms and more than 41%
Distribution of spam attacks per day per site, divided by CMS
Top CMS for spam attacks
| CMS | Number of spam attacks |
| Mediawiki | 657.92 |
| Joomla | 172.45 |
| 1C Bitrix | 129.27 |
| Drupal | 118.14 |
| IP.Board | 98.70 |
| Wordpress | 49.75 |
| Simplemachines | 41.75 |
| phpBB 3.1 | 27.51 |
| phpBB 3.0 | 25.88 |
| The average | 146.82 |
As we can see, MediaWiki is very different from the rest of the CMS. In our opinion, such a significant gap is due to the fact that for this CMS there are no sufficiently effective remedies, and it is very difficult for administrators to track changes made to articles. This leads to the fact that spammers are convenient to place links in articles.
The low proportion of spam on phpBB is due to the relatively low prevalence of this platform.
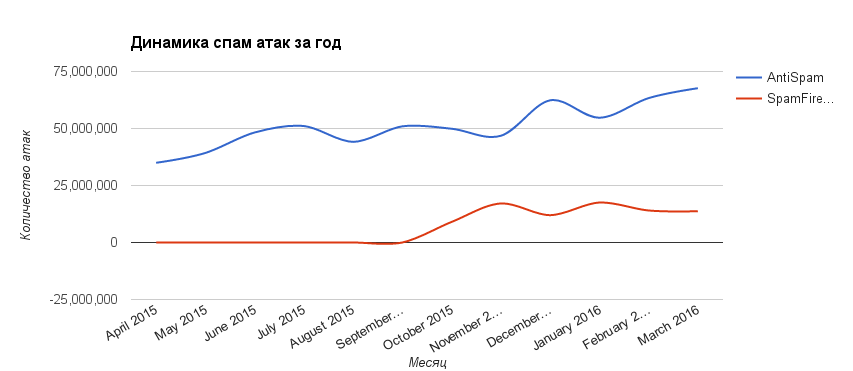
Dynamics of spam attacks for the year
The number of blocked spam attacks for the period
| Month | Anti-spam | SpamFireWall |
| April 2015 | 34,956,588 | 0 |
| May 2015 | 39,269,843 | 0 |
| June 2015 | 48,258,175 | 0 |
| July 2015 | 51,081,673 | 0 |
| August 2015 | 44,131,678 | 0 |
| September 2015 | 50,954,715 | 0 |
| October 2015 | 49,895,055 | 9,026,116 |
| November 2015 | 46,807,047 | 17,129,574 |
| December 2015 | 62,355,098 | 11,971,351 |
| January 2016 | 54,720,390 | 17,540,442 |
| February 2016 | 63,326,170 | 14,036,018 |
| March 2016 | 67,676,972 | 13,710,624 |
| April 2016 | 68,038,697 | 13,413,217 |
It should be noted that in October 2015 we launched the SpamFireWall service, with some of the spam attacks blocked by them and not counted for the Anti-Spam service. It is also worth noting about SpamFireWall statistics, since not only POST requests are blocked, but also all GET requests to the site.
As can be seen from the graph, the number of spam on web sites is only growing and has some seasonality. In the summer and autumn, the growth of spam stops, or slightly decreases, but with the onset of winter, growth always begins.
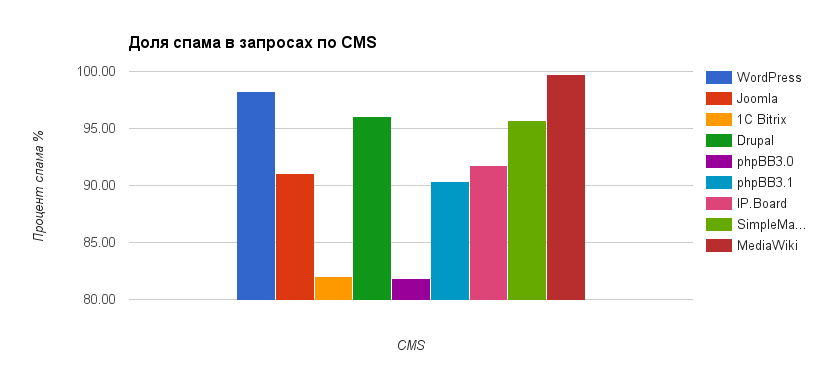
The proportion of spam in POST requests for CMS
| CMS | % spam |
| Mediawiki | 99.76 |
| Wordpress | 98.21 |
| Drupal | 96.08 |
| Simplemachines | 95.74 |
| IP.Board | 91.72 |
| Joomla | 91.04 |
| phpBB 3.1 | 90.35 |
| 1C Bitrix | 82.03 |
| phpBB 3.0 | 81.87 |
| The average | 91.87 |
Statistics show that the proportion of spam in the comments / registration / contacts, etc. exceeds 90%. In our opinion, spammers consider promotion links to be still effective, and if not to advance in search, then to attract the site’s audience to their resources.
About CleanTalk Service
CleanTalk is a cloud service to protect websites from spambots. CleanTalk uses protection methods that are invisible to website visitors. This allows you to abandon the methods of protection that require the user to prove that he is a person (captcha, question-answer, etc.).
Source: https://habr.com/ru/post/301498/
All Articles