Panamanian documents. From the world by thread
 As many people know from the press, the International Consortium of Investigative Journalists (ICIJ) laid out in free access the so-called “Panamanian Archive”: information about persons associated with offshore companies around the world obtained by unknown persons from the Panamanian law firm Mossack Fonseca .
It is possible to relate differently to the data itself, to the way they are received and published in open access. But, if we abstract away from these questions, then this is just information that can be processed and which can be viewed from different angles (in the truest sense).
Data overview
According to a consortium of these journalists, the processed data is in their Neo4j format (which they later promise to post), but so far only the data of individual nodes in the csv-files and the file of links between the nodes have been published.
On their website, visualization is presented in graph form, but it will also be convenient to see all the basic data in a single table, which is done.
So, there are 4 csv-files with data and a communication file between them, each file has an identifier (not unique), and the connectivity between nodes provides a communication file, in which the connection type is specified in the rel_type column. By analyzing the files, their identifiers, drawing lines and arrows on paper, it was determined that the connectivity is provided as follows ( Fig. 1 ).
rice 1 The scheme of communication between data in files
The final table includes data on the beneficiaries of offshore companies (file Officers ), their addresses ( Adresses ), and the offshores themselves ( Entities ).
Considering that identifiers are not unique (there are common intersecting sets), it is definitely impossible to combine tables in pairs by key, then the tables were joined one by one, left joins and common intersections. All this was done in R using the tidyr and dplyr packages . Further, some insignificant columns were excluded. The total number of unique entities (that is, all beneficiaries with offshore companies associated with them) was 1.4 million records.
Interface
Graphical web interface is traditionally the interface shiny-dashboard , which uses only the main panel with two tabs.
Globe Mapping
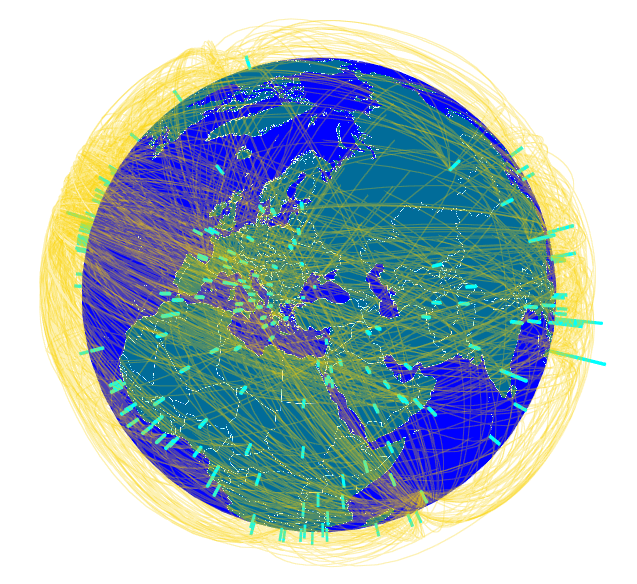
After combining the data of interest, it is possible to visualize them, but given that all values are categorical, and in such a larger amount (including unique ones), then visualization of such data in some convenient form is not representable. Since the graph form shows the data on the ICIJ site itself, and some aggregated analysis (frequency tables — the total number of offshore by country, the number of offshore countries, etc.) is already presented in the press, I decided to present flows between countries beneficiaries and offshore companies on the globe, at the same time counting the number of such pairs and displaying them on this diagram ( Fig. 2 ).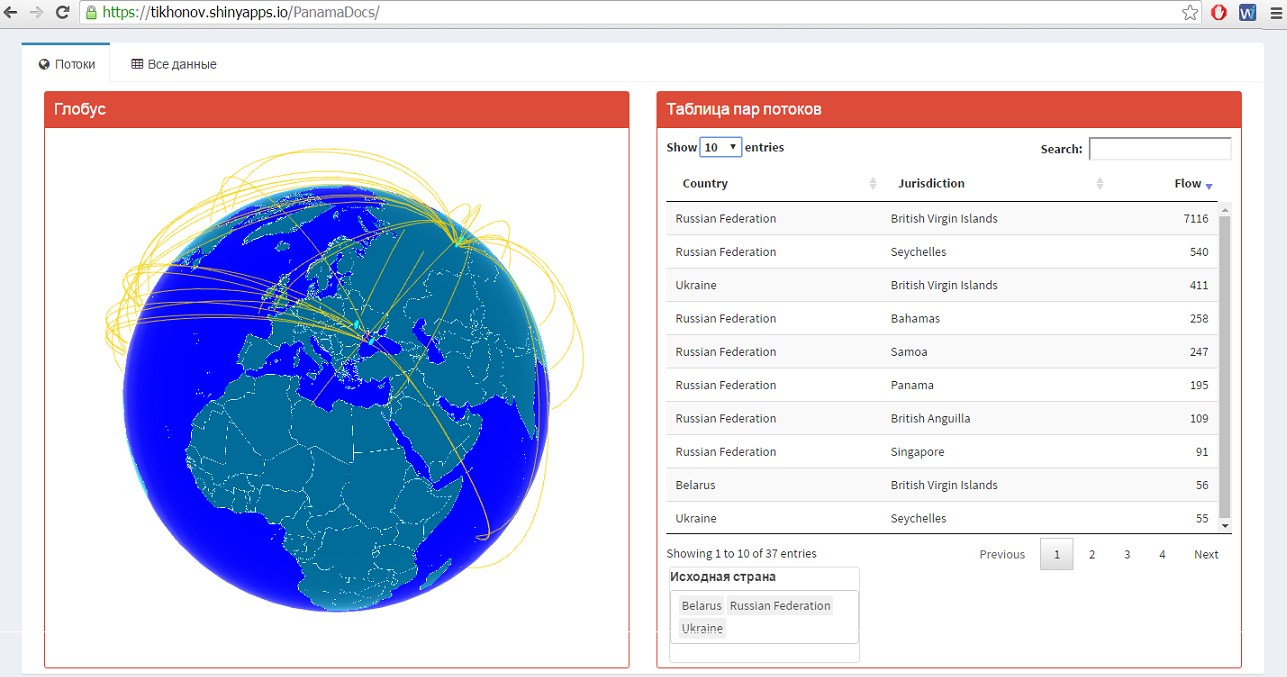
rice 2 First tab
For displaying streams on the globe, the threejs package is used , for rendering, in this case, map generation is used (and not a ready-made picture of landscape cover). On the globe, columns show all countries in which there are owners of offshore companies (there were 220 of them, that is, virtually all countries of the world), the height of the column reflects the number of owners of offshore companies relative to other countries. And the arcs marked all offshores from all countries, the thickness of the arcs depends on the number of offshore companies in this direction. For details, you can select specific countries and see what offshore owners they are. The table in the next block shows the total number of offshore companies for the pair - the country of the beneficiary and the country of the offshore.
Table
The second tab ( Fig. 3 ) shows a table with merged data, and given the significant amount of data (1.5 million lines), the Data Table object is used to calculate the table with calculations (filtering, sorting, searching) on the server side, this is provided by the DT package (a wrapper to the JS DataTables library). For each column, it is possible to sort, search for the desired values (the search takes about 3-4 seconds).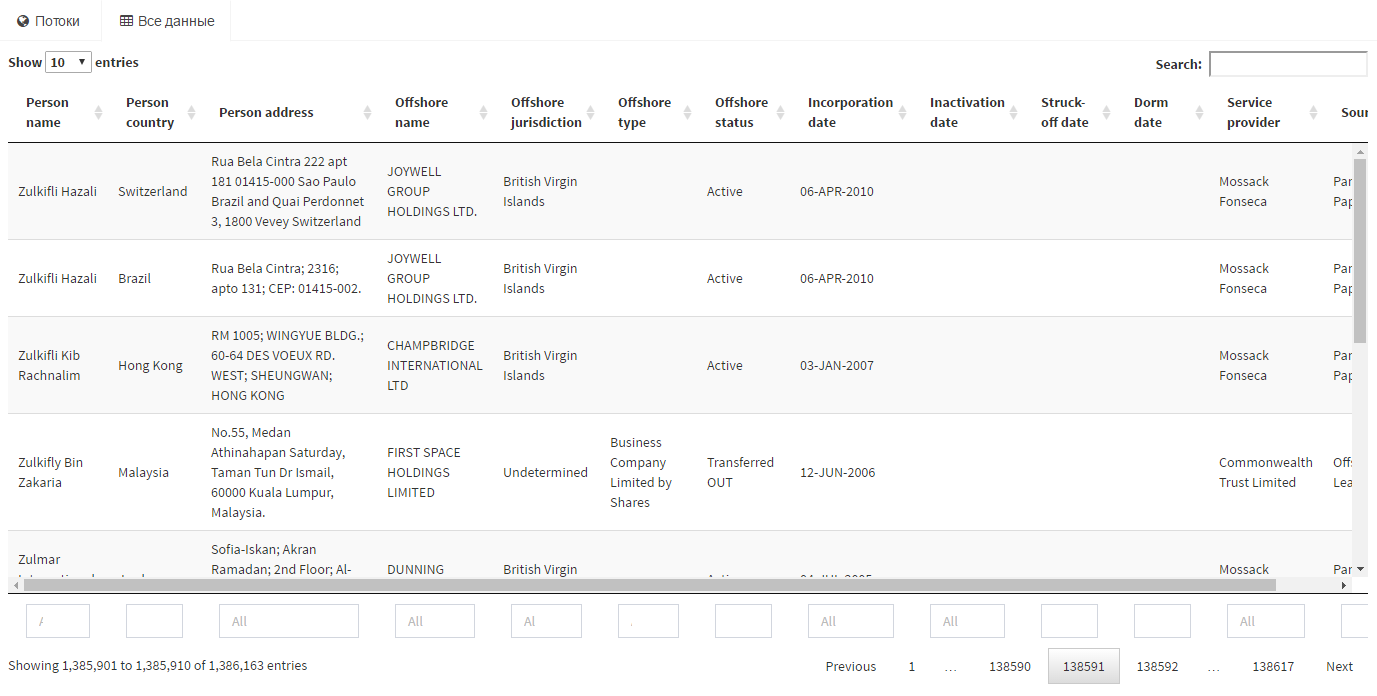
rice 3 Second tab
Conclusion findings
And everyone draws conclusions himself ...
')
Source: https://habr.com/ru/post/300850/
All Articles