5 scenarios for analyzing levels in your application
In March 2016, we have a new report Users by level in devtodev. As the name implies, it is useful for projects in which each user has a level. These are mostly games, but any other services where the user moves through the levels — for example, learning applications — can also be included here. Let's talk about analyzing levels in a bit more detail.
The report is based on the date of the last activity of users . For greater accuracy, you can add another criterion - the date of the first entry into the application . Then you choose the metrics to display: there are nine of them , and in one report you can choose up to three of the most interesting:
How to apply level analysis in practice? Below are five possible scenarios.
Select the Passed the level, Remaining on the level, and% of remaining users metrics. You will receive a funnel in which you can estimate the total number of users stuck at the level in absolute values and as a percentage. It will show how many users have been at the level for the considered period. You will see how users react to the complexity of the levels in your project, where they prefer to stop and what the level distribution is at the moment.
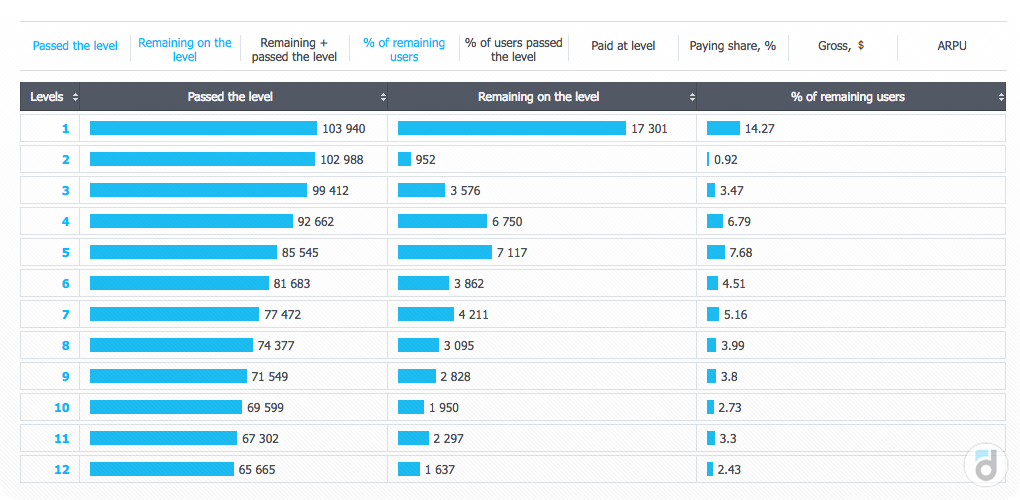
Do you see? 14% of users do not even go through the first level - the thing does not seem to be complexity, but that the user understood what was required of him and was not interested in the application. But those who reach level 2, pass it almost certainly (the percentage remaining at the level is less than one percent). Interesting and the high proportion remaining at 4 and 5 levels.
')
Select metrics Remaining on the level, Paying share, Gross. This version of the report shows the current distribution of users by level, as well as the income that each level brings, and the proportion of people paying. Knowing where the share of paying is higher, you can better understand the behavior of people who bring you money. When do they decide to pay? What are they paying for? How much money did each level bring? It is these questions that will help answer the report.

In the screenshot we see that levels 1 and 2 do not make money at all, and this is logical - most likely, here the user is not yet required to pay to the project. The main income comes from levels 7 through 17, and the task of the developer is to ensure the maximum flow of users to these levels. For example, at 3-4 levels in a lot of players focused, and you need to move them further to increase income.
By changing the Install date filter in the report, we can select users who have registered for the project at different times. For example, it is worth comparing the distribution of the levels of two cohorts of users: registered a week ago and two weeks ago. Thus, we will be able to track the dynamics of their flow by levels and predict where users registered a week ago will be in a week.


See how different is the distribution of users registered a week and two ago? Earlier users have already been distributed in levels from 3 to 10, and newbies are still focused on levels 1-4.
You can build a model of the flow of users from level to level and, knowing the ARPU of each level, to predict the flow of money into the project for a week or more ahead.
The “All users” button allows you to filter users by various parameters and build a report only on selected segments.

For example, you can select users who use the Galaxy S3 and S4, and compare them with users of the Galaxy S5-S7. Thus, it will be possible to estimate the number of users from different devices (to know what to optimize in the first place), and efficiency - for example, on which devices is higher than ARPU.
We apply a filter on Install date, select user distribution metrics by levels, build a report on two versions of the application for the same period.
Have all users updated from version 2 to version 3? Let's first build a report for version 2:

Now for version 3:

On version 3, there are already 452 users, and on version 2 there are 35 users (7% of the total audience). So, 93% of the audience has already updated the version of the application. Moreover, perhaps, users of version 2 should be borne in mind - they have not forgotten about your application, they are still moving through the levels.
Game levels are important in analytics: in a sense, having a level gives a project a significant advantage in analysis. With the levels you can study in detail the behavior of the players, their dynamics in the project, factors affecting monetization. And that means making more accurate, efficient and balanced decisions for the development of the project.
The report is based on the date of the last activity of users . For greater accuracy, you can add another criterion - the date of the first entry into the application . Then you choose the metrics to display: there are nine of them , and in one report you can choose up to three of the most interesting:
- Passed the level - the number of users who have visited the level and passed it;
- Remaining on the level - the number of users who visited the level but did not pass it;
- Remaining + passed the level - the number of users who have visited the level;
- % of remaining users - the percentage of users (of all who have visited the level) who have not passed the level;
- % of users passed the level - the percentage of users (of all who have been at the level) who have passed the level;
- Paid at level - the number of users who have made at least one payment during their stay at the level;
- Paying share,% - the share of users who have made at least one payment during their stay at the level of all who have visited the level;
- Gross, $ - total income from user payments made at this level
- ARPU - the average income from a single user who visited this level.
How to apply level analysis in practice? Below are five possible scenarios.
1. Funnel passing levels
Select the Passed the level, Remaining on the level, and% of remaining users metrics. You will receive a funnel in which you can estimate the total number of users stuck at the level in absolute values and as a percentage. It will show how many users have been at the level for the considered period. You will see how users react to the complexity of the levels in your project, where they prefer to stop and what the level distribution is at the moment.
Do you see? 14% of users do not even go through the first level - the thing does not seem to be complexity, but that the user understood what was required of him and was not interested in the application. But those who reach level 2, pass it almost certainly (the percentage remaining at the level is less than one percent). Interesting and the high proportion remaining at 4 and 5 levels.
')
2. Monetization efficiency levels
Select metrics Remaining on the level, Paying share, Gross. This version of the report shows the current distribution of users by level, as well as the income that each level brings, and the proportion of people paying. Knowing where the share of paying is higher, you can better understand the behavior of people who bring you money. When do they decide to pay? What are they paying for? How much money did each level bring? It is these questions that will help answer the report.
In the screenshot we see that levels 1 and 2 do not make money at all, and this is logical - most likely, here the user is not yet required to pay to the project. The main income comes from levels 7 through 17, and the task of the developer is to ensure the maximum flow of users to these levels. For example, at 3-4 levels in a lot of players focused, and you need to move them further to increase income.
3. Cohort analysis by level
By changing the Install date filter in the report, we can select users who have registered for the project at different times. For example, it is worth comparing the distribution of the levels of two cohorts of users: registered a week ago and two weeks ago. Thus, we will be able to track the dynamics of their flow by levels and predict where users registered a week ago will be in a week.
See how different is the distribution of users registered a week and two ago? Earlier users have already been distributed in levels from 3 to 10, and newbies are still focused on levels 1-4.
You can build a model of the flow of users from level to level and, knowing the ARPU of each level, to predict the flow of money into the project for a week or more ahead.
4. Efficiency of devices / countries / languages
The “All users” button allows you to filter users by various parameters and build a report only on selected segments.
For example, you can select users who use the Galaxy S3 and S4, and compare them with users of the Galaxy S5-S7. Thus, it will be possible to estimate the number of users from different devices (to know what to optimize in the first place), and efficiency - for example, on which devices is higher than ARPU.
5. Updating application versions
We apply a filter on Install date, select user distribution metrics by levels, build a report on two versions of the application for the same period.
Have all users updated from version 2 to version 3? Let's first build a report for version 2:
Now for version 3:
On version 3, there are already 452 users, and on version 2 there are 35 users (7% of the total audience). So, 93% of the audience has already updated the version of the application. Moreover, perhaps, users of version 2 should be borne in mind - they have not forgotten about your application, they are still moving through the levels.
Game levels are important in analytics: in a sense, having a level gives a project a significant advantage in analysis. With the levels you can study in detail the behavior of the players, their dynamics in the project, factors affecting monetization. And that means making more accurate, efficient and balanced decisions for the development of the project.
Source: https://habr.com/ru/post/300734/
All Articles