Vanilla metrics: how we cheat ourselves, management and customers

The base of subscribers is 50,000 people, 10,000 visitors to the site, 700 downloads of the application, 500 likes on Facebook, 300 followers on Twitter - sounds good, right? We insert these figures in the report to the management, show them in the presentations to the clients and always receive enthusiastic responses. For example, "I have 14,000 article views on the Megamind." The crowd together says: "Wow, you're cool." But what do these numbers ultimately give? What is the end result? Let's talk about it?
Often when analyzing our activities we use the following indicators:
• number of registered users;
• group size and number of followers in social networks;
• the number of downloads of your application in Google Play or the Apple Store;
• size of email database;
• number of site views;
• time spent by the user on the site.
These are the so-called “vanilla metrics”. This concept includes any non-objective indicators, as a rule, these are big beautiful figures, but it is not possible to judge about the quality of the result and the availability of the result itself. In presentations, such graphs of these indicators have the appearance of a hockey stick =)

')
I come across vanilla metrics every day, many do not understand that this way it is impossible to evaluate work.
Despite the fact that these metrics, frankly, stupid, you should not abandon them. There are areas where these metrics are used successfully, but usually not from a good life:
1) Sales.
We need to convince the buyer that we have a super-reliable company with high performance. Here, various vanilla metrics and ratings and recommendations of various fearful companies, associations and unions are used.
When I worked in one network company to form a successful image, we also added to these metrics ratings of high ratings of consulting companies, about which few have ever heard, but these figures can be grasped.
"Our company according to the consulting company Horns and Hoofs has an AAA + rating, only Deutsche Bank has one and a couple of other companies, even Microsoft has a lower one."
2) Reports.
When there is no result, but the result is necessary to show - here, too, we are rescued by big beautiful figures. In business, this does not always work (except for situation 3 in the figure), but in government institutions this happens very often. The management and the founders love to see the dynamics, if you show that last year there were 5,000 visitors on the corporate site, and this year there are 7,000 visitors, then you are well done, you work well.
The main thing is a successful and steady growth, no matter what the growth of vanilla metrics. If you ask how many of these visitors have become customers and how much money they have brought, the answer will be depressing, but this does not occur to anyone. Although, maybe this is just a game of giveaway. The management does not invest money in this direction and, therefore, overlook this reporting.
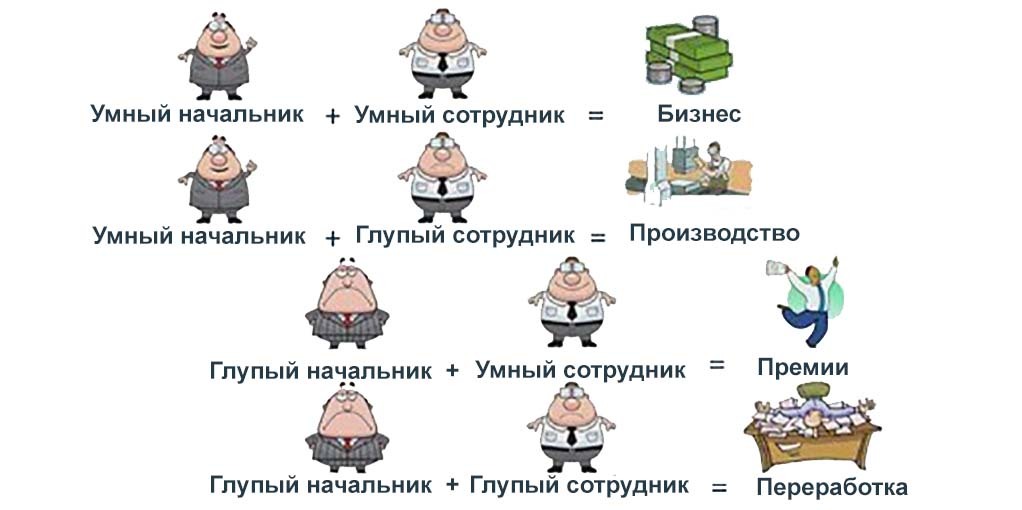
As can be seen from the figure, such a tactic is especially effective in the third case, when a stupid boss and an intelligent employee.
A separate example is the site performance reports. Google Analytics and Yandex Metrics are configured by default to vanilla metrics. Few people customize them for their own needs, setting goals and monitoring conversion. Rejoicing at the incredibly beautiful indicators, managers choose some of the most beautiful ones to demonstrate to management. The bosses are happy with the graphics, the marketers justify the costs. Total profit!
Correct metrics.
Now I will say a few words about the correct metrics.
The main criteria for correct metrics are:
1) If the metric changes, and you do nothing, then this bad metric means. Changing metrics should change our behavior. The correct metric is its indicator of whether everything is going smoothly or problems are observed somewhere. If the metrics do not respond, why even measure them?
2) Metrics should be Comparative (compare X1 with X2) and relative (in%). For example, sales growth in April compared with March was 10%. Here sophisticated civil servants are moving to a new level by making comparative vanilla metrics, as was the case in the report example above.
Dave McClure, creator of "Metrics for Pirates (AARRR)" highlights 5 key metrics:
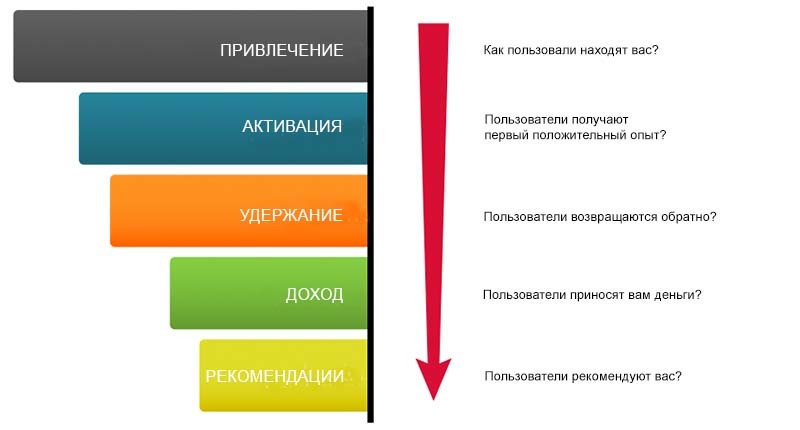
Attraction - attracting users to the site from different channels. Vanilla metrics show thousands of downloads, but most of them are dead souls. Note the number of conversions and the bounce rate.
Activation - visitors are satisfied with the first visit and received the first "positive experience" of working with the service / product. I looked through more than 2 pages, subscribed to the newsletter, downloaded the application. The first stage of the sales funnel is completed, what is the conversion?
Hold - visitors regularly return to the site, often visit it, begin to use the service or application.
Revenue - users begin to pay for the services and services offered, thereby confirming the monetization model hypotheses
Recommendations - users like the product so much that they start recommending it to friends.
Steve Blank, founder of Customer Development, describes this process of attracting and developing customers as follows:
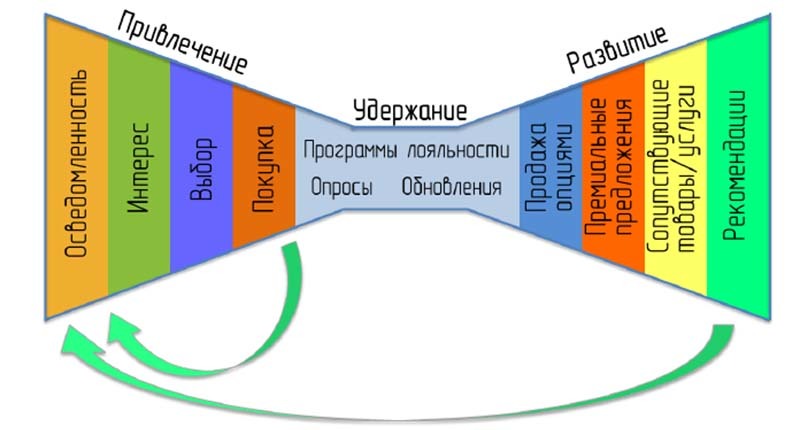
Stage 1 - the attraction and activation of consumers
Stage 2 - customer retention (loyalty program, contests, updates)
Stage 3 - growing consumers (additional sales, next sales, cross-sales, recommendations).
Each stage in both funnels can be measured by separate metrics.
Read more about Steve Blanca and his concept “Customer Development will be discussed in one of the following articles.
Which metrics are still important to track?
- CAC - cost of customer acquisition
- LTV is the lifetime value of the client (the total profit from the client received during the whole period of cooperation with him).
- The ratio of CAC and LTV. Ideally, the LTV should be three times the CAC.
- ARPU - revenue from the user.
There are many other metrics that are beyond the scope of this article. Write in the comments if you are interested in learning more about this.
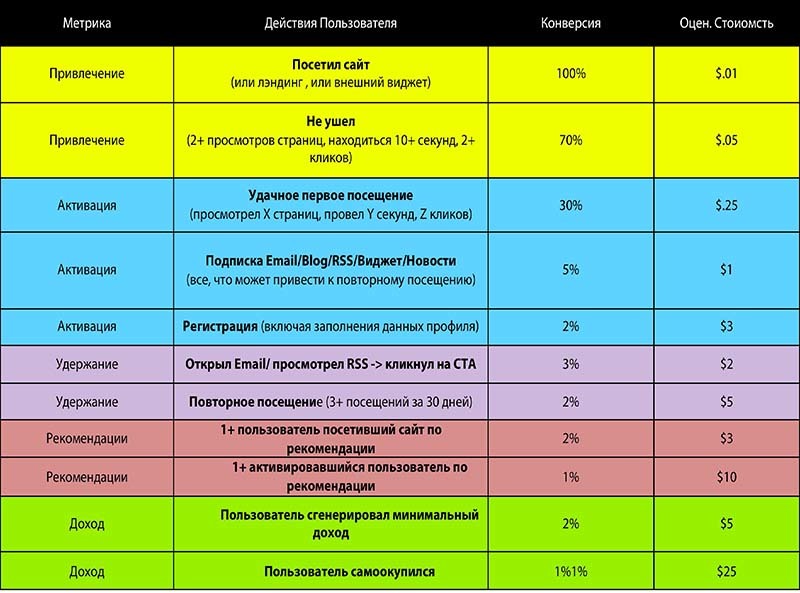
An example of the use of "pirated metrics" (Dave McClur)
Summary.
Vanilla metrics are good for powdering someone’s brains, but if you follow them when analyzing the effectiveness of a business or startup development, it will lead to a disastrous result.
Source: https://habr.com/ru/post/300558/
All Articles