E-commerce: Russia vs. China. Part I

Russian, especially unprofitable and investment, e-commerce projects very often asserted that one should not be afraid of China (for example). But practice has proven the opposite. As part of this article, we will try to compare the original sources: statistics on Chinese and Russian retail.
Briefly about the story
The origin of global e-commerce is associated with 1960, when for the first time an automatic passenger check-in system (SABER) was created for American Airways. Electronic commerce of Russia and China, despite the relatively late inception, has sufficient potential for further development.
')
In 1994, the .ru national domain for the Russian Federation was officially registered, and in the same year, the first site in the RU zone was created at www.ru (the archive version at www.1-9-9-4.ru ). In September 1995, for the first time in Russia, a mechanism for trading CDs via the Internet was created on the basis of the provider “Netklab” (the store was closed almost immediately due to unprofitability). On August 30, 1996, a new attempt was made to create a Russian online store, and this time successful: the Symbol online store (www.symbol.ru), now called Books.ru, opened. In March 1997, the first RIF (Russian Internet Forum) was held. On April 10, 1998, the virtual bank IMTB appeared on the Russian financial services market. November 20, 1998 - the first transfer of funds through Webmoney - the first publicly available electronic payment system - was completed. In 2000, the highest growth rates of online stores were observed, Russian entrepreneurs sought to find their niche on the Web.
The history of e-commerce in China began its development in 1997, at which time the first B2B platforms (ChemNet), (Trade easy.com) began to appear. 1999 can be considered a turning point - this year, the e-commerce giant of China is created, occupying a leading position to this day - Alibaba Group. 2003-2005 can be considered an important period in the history of e-commerce in China, atypical pneumonia (SARS) was raging in China, buyers were afraid to get infected, went out less and bought more on the Web, thereby provoking an e-commerce boom. The modern period is characterized by the continuous modernization of China’s e-commerce and its development; according to the latest data, China’s e-commerce volume reached 16.2 trillion. yuan
Dynamics of development of online stores
Today in Russia there are more than 40 thousand online stores and about 35 million customers. Despite the fact that the overall statistics of online stores shows growth, the number of closed projects also increased.
Dynamics of the number of online stores in Russia from 2007 to 2014 as follows:
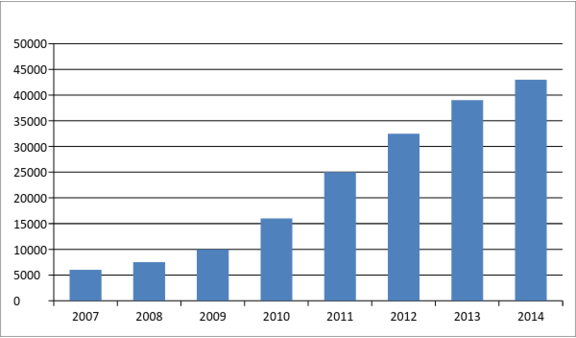
Source: Digital Marketing-Up Agency
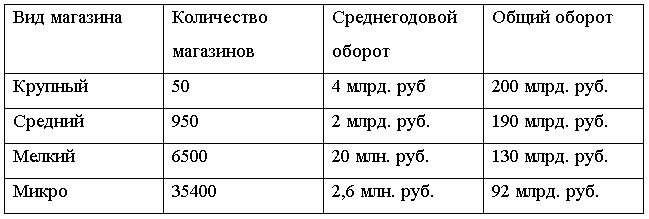
The number of large online stores has noticeably increased - there are about 50 of them, they are actively developing and expanding. Most of the stores fall on the category of micro-stores (the number of stores is about 35,400), the category of medium-sized stores accounts for 950 stores, small ones - 6,500.
The largest number of new stores falls on the product category “Building materials”, “Home goods”, “Gifts”, “Equipment”. The tendency of exceeding closed stores over new ones is observed in the categories “Flowers”, “Electronics and Home Appliances”, “Computers and Laptops”.
In general, it can be noted that there has recently been a tendency to withdraw from the market of weak stores that are sensitive to an unstable course and are oriented towards sanctioning goods. In the meantime, the larger stores are expanding product categories, becoming multi-level.
Back in 2001, 362 online stores were present in Russia, with 85% of them not supporting online payments of electronic money transfer systems. Dynamics of development of online stores in 2007-2014 for such indicators as the Internet audience, the share of Internet buyers among Runet visitors, as well as the number of Internet buyers is as follows:
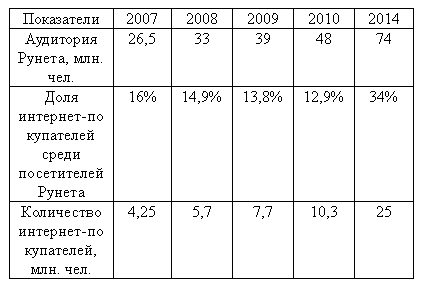
According to FOM
If we talk about the leaders, then you can see that in the Top-100 rating from Data Insight agency there are also unprofitable projects, among them the holding Ozon.ru, which in 2013 increased its revenue to 7.4 billion from 6.4 billion, at the same time, the loss of the company increased from 610 million rubles. up to 619.7 million rubles, while in 2011 the loss was only 211 million rubles ... Also, the Sotmarket is a loss-making project, with a net profit of 18.8 million rubles. changed to a loss of 70.1 million. Net losses increased and the store Enter.ru. The growth of company losses is due to the growth of projects, an increase in purchases. In addition, Ozon, for example, being a project for the sale of books and CDs, maintains its financial performance by selling non-core goods, but the proceeds from the sale are still not enough to cover losses.
If we talk about investment projects, the Russian e-commerce has long attracted investment, but in 2014, media and software pushed e-commerce into the background. According to a study by Venture Barometer, e-commerce topped the list of the least promising investment niches. If before venture money was actively involved in projects for booking hotels and air tickets, coupon services and online stores, now instead of e-commerce investors will choose the real sector, the cause of investor frustration is the low marginality of e-commerce.
According to CB Insight, in the first half of 2014, investments were attracted for $ 231.7 million. The largest transaction was the purchase by Yandex of auto.ru portal (the announced transaction amount was $ 175 million) and the purchase of an additional Ozon issue (10.8%) for $ 150 million AFK Sistema and MTS. Large transactions took place mainly in the e-commerce segment: in addition to Ozon.ru, this was the acquisition of the Food Club food delivery service aggregator by the international group of companies Foodpanda, transactions Naspers - Esky.ru, Vaizra Capital - Islet, Kinnevik - Avito, IFC - Lamoda. The Internet Initiatives Development Fund (IIDF) published in February 2016 a report on the state of the Russian market of direct and venture investments in the Internet and Information Technologies segment for 2015. The overall market dynamics is downward. The market decreased by 43% in terms of the amount of investments at all stages and by 20% in terms of the number of transactions. The average transaction value in 2015 amounted to 152 million rubles. against 210 million in 2014. Thus, there was a decrease in the average amount of the transaction by 29%.
In China, the number of B2B sites in 2014 reached 11,200, which compared with 2013 decreased by 6.7%. The reasons for the reduction in the number of B2B sites include foreign economic and internal stagnation, as well as the fact that many weak platforms in the face of fierce competition leave the market. Dynamics of B2B sites from 2010 to 2015:
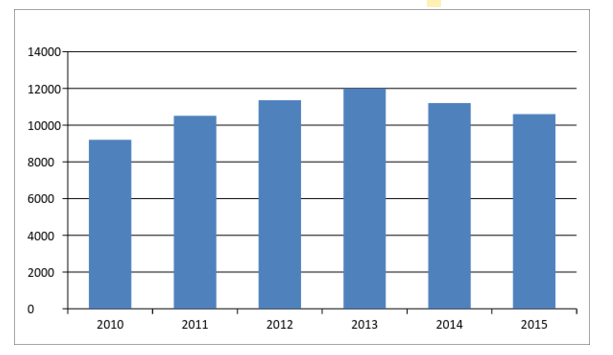
Source: 100ec.cn
The B2B platforms that occupy the most extensive niche in the e-commerce market include: Alibaba Group (38.9%), Mysteel.com (18.5%), Global Sources.com (4.8%), HC360.com (3, 78%), Focus Group (2.0%), Global Market Group (1.4%), Toocle.cn (0.6%), others - 30.2%.
It is worth noting that all the major venues of the B2B sector, with the exception of the Alibaba Group, in conditions of slowing macroeconomic growth, suffered losses of varying degrees.
Alibaba Group has an obvious advantage, despite a slight decline in the company's share in the total B2B sector, Alibaba continues to hold the leading position. Moreover, in the first half of 2015 alone, over 1,688 stores started operating on the platform.
My Steel's Shanghai platform has increased its market share by 0.7%, and the company is actively developing its own ecosystem, warehouse and logistics system. At the same time, the basis of the Shenzhen platform Global Sources is trade and exhibition activities, mainly the holding of the Hong Kong international electronics exhibition Sourcing Show, as well as the Shenzhen International Machinery Manufacturing Industry Exhibition.
The market share of HC360.com decreased due to the introduction of paid registration, which ultimately led to a decrease in the number of users, and thus to a decrease in revenues.
Among the largest B2C sites, occupying the largest market share in China: Tmall (59.3%), DJ.com (20.2%), Sunning (3.1%), Vip.com (2.8%), Gome (1.7%), Amazon.cn (1.5%), 1haodian (1.4%), Dandgdang (1.3%), Yixun (1.1%), Jumei (0.6%). These online stores offer product categories: “Clothes, shoes, accessories”, “Electronics, home appliances”, “Cosmetics, perfumery”, “Household goods”.
Among the investment projects, the most significant include: the creation of a cross-border e-commerce center in Yekaterinburg. The agreement was signed between representatives of the State Postal Bureau of China and representatives of the government of the Sverdlovsk region at the international exhibition Innoprom-2015. This project is considered as a practical component of the strategies of the Eurasian Economic Union and the Silk Road economic belt. It is assumed that the unique location of Yekaterinburg will help reduce the delivery time for goods from two weeks to 3-5 days.
The volume of online commerce in Russia, the share of online commerce in the total trade of the country
According to Data Insight, in 2014 the e-commerce market volume reached 645 billion rubles. (16.7 billion dollars). The volume of the domestic market amounted to 560 billion rubles. ($ 14.5 billion). The volume of cross-border trade amounted to 85 billion rubles. ($ 2.2 billion.) Dynamics of e-commerce in Russia 2011-2017:
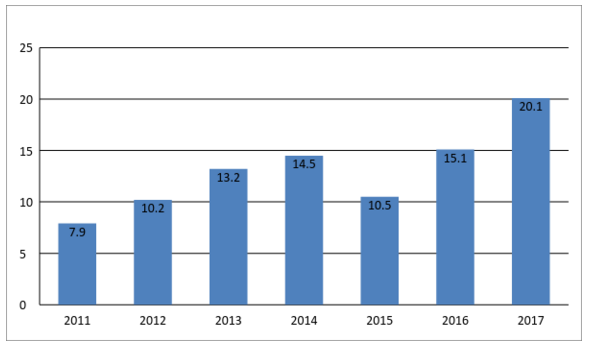
Source: Data Insight Analytical Agency Annual Report 2014
According to the study, the growth of the domestic market was 35%, taking into account purchases in foreign online stores - 42%. The market volume increased mainly due to the increase in prices, the real market growth was about 17%, which is 1.5 times lower than in the previous year.
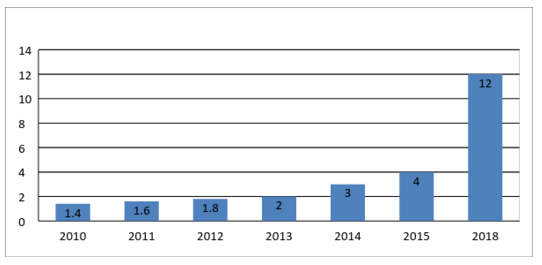
The share of e-commerce in Russia's GDP in 2014 was about 2%, in the total volume of retail trade in Russia, the share of e-commerce was 3%. According to forecasts, by 2018, the share of online commerce in total retail sales will be 12%.
The volume of e-commerce in China, the share of online commerce in the total trade of the country
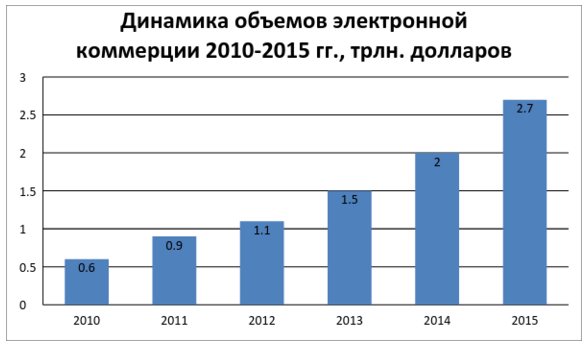
According to the center of analytics and statistics of China, the volume of the e-commerce market in 2014 amounted to 13.4 trillion. yuan (2 trillion. dollars). Of these, the B2B sector accounts for about 74.6% of the market, the B2C sector accounts for 21% of the e-commerce market. Dynamics of electronic commerce from 2011 to 2015:
Source: 100ec.cn
The share of e-commerce in China’s GDP was 7%, in addition, in 2014, the volume of exports and imports of China reached 4.16 trillion. dollars, of which 0.59 trillion. accounts for cross-border trade, with 80% of which is exported. According to the results of the period from January to August 2014, PRC's income from e-commerce amounted to 1.5 trillion. dollars, which is 25% more than in the same period last year. In September, the retail turnover of e-commerce grew by 36.2% and reached 2.59 trillion. yuan
Internet penetration in Russia and China
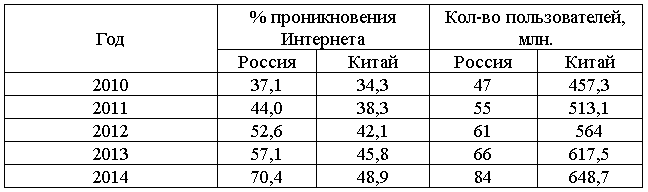
In Russia, as of 2014, 70.4% of the population have access to the Internet, 84 million people aged 16 years and older are Internet users. The penetration of the Internet in Russia is uneven, the largest share of Internet users by region is occupied by Moscow (83% of the population use the Internet), in cities with a population of 100 thousand and more 71% of the population have access to the Network, in small towns and villages 66%.
Among the key factors explaining regional differences are differences in the standard of living, purchasing power and the development of broadband and wireless Internet access, as well as in computer and Internet literacy. The spread of the Internet and the intensity of its use are interrelated: the higher the percentage of Internet users, the higher the level of Internet activity and vice versa.
The Russian market of fixed broadband access in the segment of private users dates back to 2002, when there were only a few thousand subscribers in this segment. In 2007, the market moved to the stage of active growth and now, after another 7 years in 2014, it is already possible to mark the transition to the stage of maturity and gradual saturation of demand. According to preliminary estimates by J'son & Partners Consulting, the number of Russian households with fixed broadband Internet access in 2014 was 29.7 million, an increase of 5% compared to the 2013 figure. Service penetration reached 53.6%. According to preliminary results of J'son & Partners Consulting, the volume of the Russian broadband access market in the segment of private users in 2014 grew by 4% and amounted to almost 110 billion rubles.
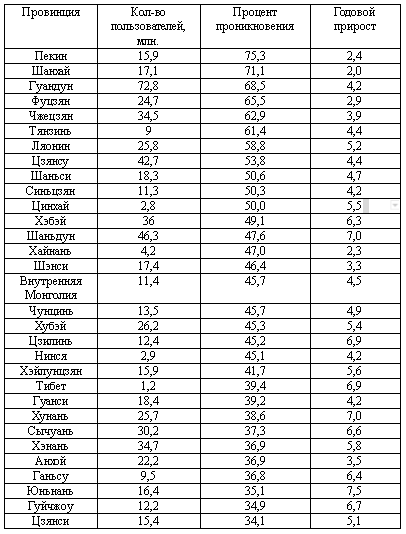
For several years in a row in China, there has been a trend of dependence on online shopping. By the middle of 2014, according to the China Internet Information Center (CNNIC), the percentage of Internet penetration in the country exceeded 48%, and the number of users exceeded 633.5 million people. More than 500 million people in the country regularly go online using mobile devices. The number of customers making regular online purchases at least once every 3 months is from 305 to 310 million people. About 75% of Internet users use mobile devices to search products and compare prices. For making small transactions, for example, for the purchase of everyday items, about 40% of buyers use mobile phones and tablets. However, for larger transactions, most buyers use a computer and laptop.
In addition, it is worth noting that e-commerce is booming in Chinese villages. So in October 2014, Alibaba Group announced the launch of a strategy for rural areas called the “Program of a thousand counties, tens of thousands of villages”, within which it is planned to invest 10 billion yuan over the next 3-5 years and create 1000 county service centers level, as well as 100 thousand service points at the village level.
The impact of the fall of the ruble and the crisis in Russia on online purchases
Russian buyers began to buy less in foreign American and European stores, the reason was the depreciation of the ruble. For Russian consumers, prices in European and American online markets have ceased to be attractive, moreover, now Russian buyers have begun to attract the Chinese market. Before the collapse of the ruble exchange rate in 2014, Russia was the leader in ordering on the American EBay website, but now the situation is different - Russian buyers began to buy goods in Chinese stores, particularly on Aliexpress.
The e-commerce market participants noted that in 2014, stores selling household appliances and electronics, nevertheless, were at the peak of popularity, as buyers sought to get rid of the depreciating ruble.
Online payments
Russia is characterized by the rapid growth of such type of payments as an electronic wallet. According to a PayPal study conducted in conjunction with Data Insight, the number of e-wallet users increased by 42%.
The share of the population with a bank card is 71%, since 2009 their share has more than doubled from 31%. The share of buyers using cash decreased significantly; if in 2013 their share was 69%, then in 2015 it was 56%.
Since 2013, the share of non-cash payments in online stores has significantly increased (55% now and 14% two years ago). The growth is due to the increase in the share of users of online stores.
With regard to online payments, the development of e-commerce for B2C and C2C models has become possible due to the active use by Chinese users of virtual money, which is calculated for online games, services distributed using the QQ instant messaging system, which is popular in China. The virtual money market has already exceeded the level of $ 1 billion and is constantly growing by about 30% per year. At the same time, due to the active proliferation of virtual money, the Chinese government introduced a number of restrictions on their use, one of which is the prohibition of the exchange of virtual money for real currency, i.e. The owner of virtual money can only spend it on payment for goods and services. The leader in the field of virtual money is a provider of network QQ instant messaging company Tencent. Users of this system can purchase the so-called Q-tokens in exchange for cash, via telephone cards for mobile communications, which are issued by China Mobile. Q-tokens can be used to purchase added mobile services, pay for licenses for antivirus and other software, electronic postcards, in some cases it is even possible to purchase real goods.
Chinese B2B Platform Revenue Data
According to the monitoring of the Center for the study of e-commerce in China, revenue B2B sector as a whole amounted to 1.65 trillion. dollars, which is 4.3% less than last year.
Due to the slowdown in economic growth in China, the companies holding the leading positions in the B2B sector (except for the Alibaba Group), the financial indicators of income and net profit received a negative growth.
- Alibaba Group (B2B sector) - the company's revenue amounted to 630 billion dollars, an increase of 25.3%. Revenues from international activities amounted to $ 360 billion, revenues from domestic activities - $ 270 billion. The company still retains its leading position, occupying almost half of the B2B sector. 1688 stores, which entered the global market, bring the main income for the company. Streamlining the supply chain and service also increases the competitiveness of the company.
- Global Sources (Guangdong Province, Shenzhen) - revenue of 86, 7 billion dollars (fell by 2, 26%). Net income amounted to 9.2 billion dollars. Company revenues are affected by trade shows, as well as currency fluctuations.
- Focus Group (Jiangsu Province, Nanjing) - revenue of 35 billion dollars, decreased by 12.44%. Net income - 16, 35 billion dollars (an increase of 51.9%). The company is trying to enter the international market, as well as attempts to introduce mechanisms to protect purchases and increase the security of payments to increase profits.
- HC360.com (Beijing) - revenue of 58.6 billion dollars (decreased by 15.9%), net profit - 6.1 billion dollars (decreased by 59.8%). After the paid registration was introduced on the platform, the number of users dropped sharply, which ultimately led to a decrease in profits.
- Toocle.cn (Zhejiang Province, Hangzhou) - revenue of 10, 9 billion dollars (decreased by 18.3%), net profit - 2, 58 billion dollars (decreased by 14, 6%) - at the moment the company is on ways to improve and modernize its activities, the company plans to introduce fees for servicing operations.
Distribution of stores to large, medium small and micro stores
Large stores are those where the daily number of orders exceeds 100.
Medium stores - more than 20 orders per day
Small shops - less than 20 orders per day
Micro less than 10 orders per day
Main indicators of 2014:
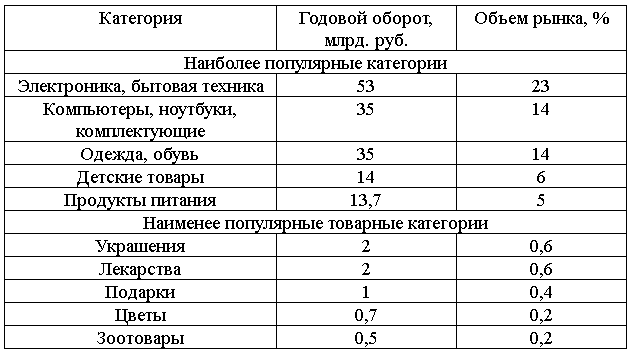
Dynamics of the top 5 most and least popular product categories, annual turnover (billion), market volume. (%)
2011
year 2012
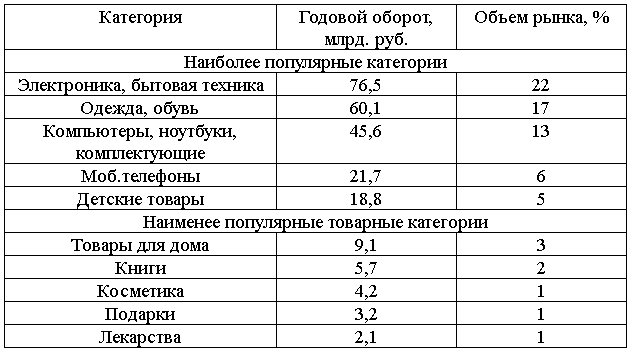
year 2013
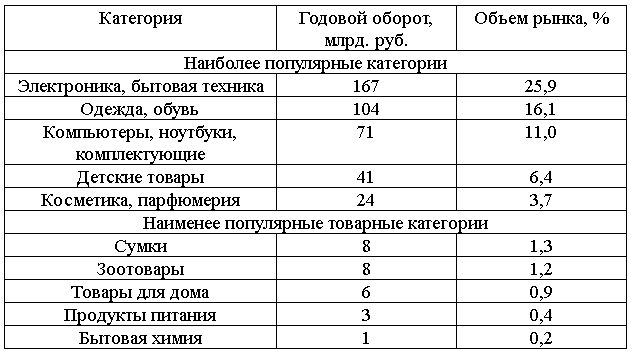
year 2014
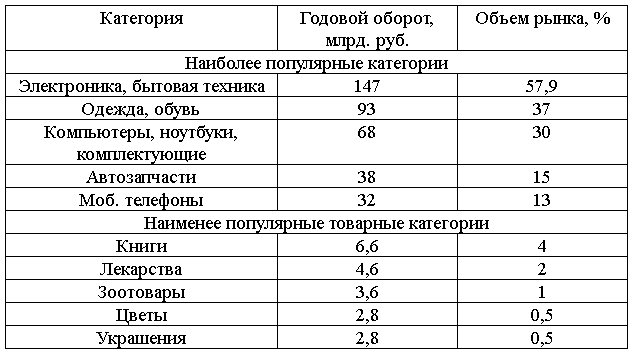
Sources: DataSight annual reports, InSales analytical bulletin
The spread of the Internet in Russia and China
In China, in 2014, the number of Internet users reached 649 million people, with an annual increase of 31.1 million people. The percentage of Internet penetration in 2014 reached 48.9%, which is 3.1% more compared to 2013.
Dynamics of Internet penetration in Russia and in China:
The geography of the spread of the Internet in China
The geography of the spread of the Internet in Russia
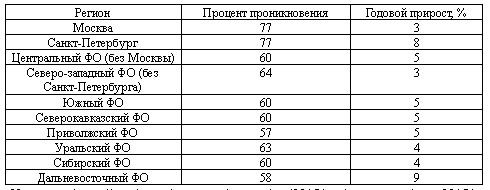
: yandex.ru/company/researches/2015/ya_internet_regions_2015
e-commerce
Alibaba 10 , e-commerce 100 000 3-5 . Alibaba Taobao, , . Alibaba , , . .
« , », Alibaba Group China Telecom ( $48), Uniscope, Ctyon Kingsun. , YunOS ( Android) . , Coolpad, Hisense TCL Taobao Mobile.
Alibaba , 2016 $75 . $80 $300 . , 480 000 Taobao.
Alibaba, , , . , , , 42 % e-commerce.
PS e-commerce , — , .. .
Source: https://habr.com/ru/post/300530/
All Articles