30+ cases: how site speed affects conversion
Correct measurement of site conversion is not an easy task. And the link speed of the site with the conversion - so almost impossible. At least over the past 8 years, only a few companies have been able to correctly link these two quantities: a little more than 30 published cases have accumulated. We carefully collected all of them, laid them out in metrics, found the original sources and bring to your attention.
Attention! There are three main metrics in site speed - server response time (TTFB), rendering time (DOMready) and full load time (onload). Part of the research is focused only on one of the metrics, and some - without these metrics at all. Applying the results of the research (and the proposed methods) to your site, you need to clearly understand what specific metric (and its improvement) we are talking about. Otherwise, the problems of your site will not be able to correlate with the results.
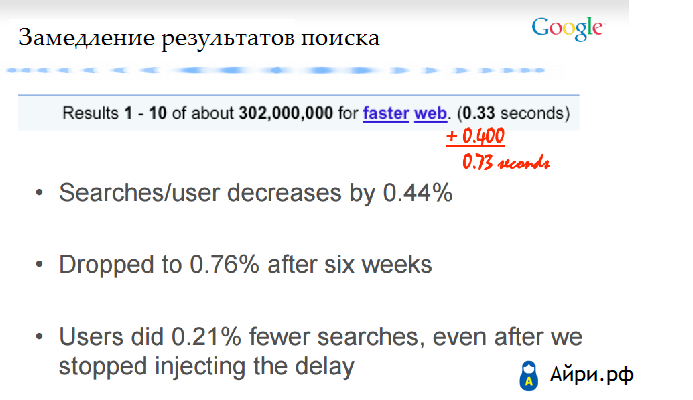
1. Google
What did: add a delay when displaying search results
What was measured: server response time (TTFB)
')
Result: 0.4 second delay reduced the number of search queries by 0.76%
Source (presentation)
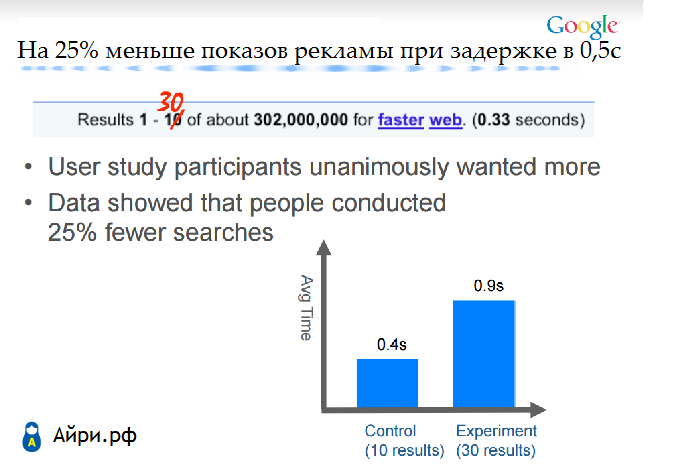
2. Google
What did: increase the number of results on the search page
What was measured: server response time (TTFB)
Result: 25% of search queries (advertising) with an increase in the delay of 0.5 seconds
Source (presentation)
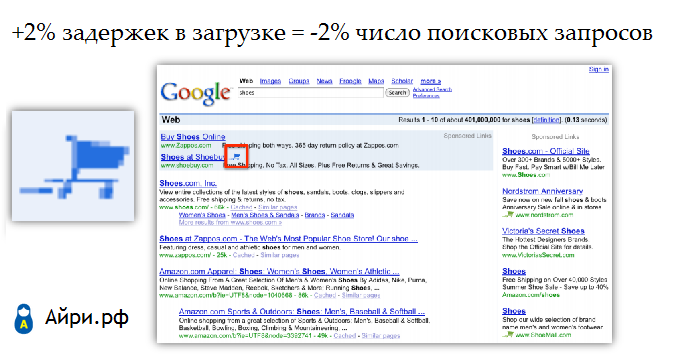
3. Google
What did: add a delay when displaying search results
What was measured: server response time (TTFB)
Result: 2% delay reduced the number of search queries by 2%.
Source (presentation)
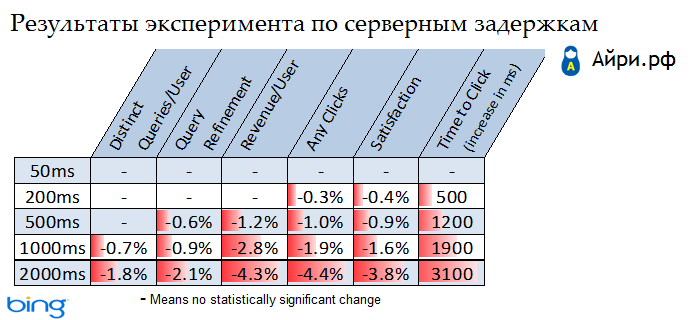
4. Bing
What did: add a server delay before issuing a page with search results
What was measured: server response time (TTFB)
Result: 0.5 seconds delay on the server reduces profits by 1.1-1.4%
Source (presentation)
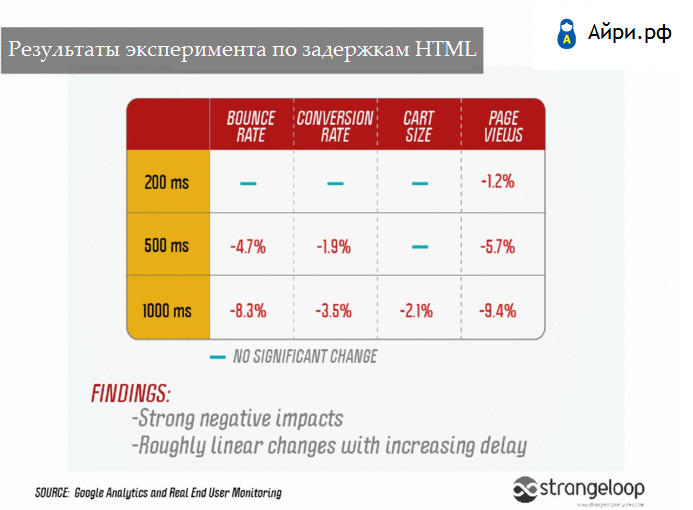
5. Strangeloop
What did you do: measured the relationship between server response time and site conversion
What was measured: server response time (TTFB)
Result: 0.5 seconds delay on the server takes 1.6-1.9% of the conversion, increases the bounce rate by 4.6-4.7%
Source (presentation)
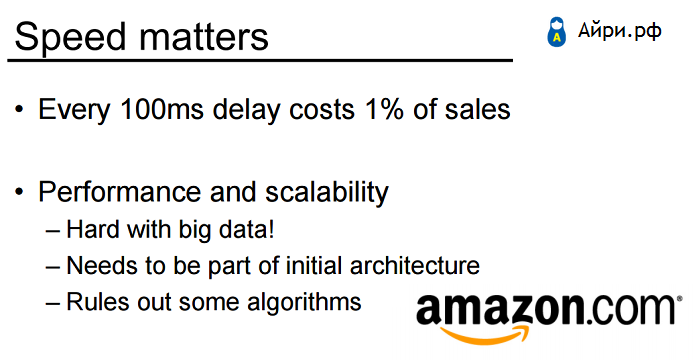
6. Amazon
What did you do: measure the relationship between server response time and revenue
What was measured: server response time (TTFB)
Result: 0.1 seconds increases revenue by 1%.
Source (presentation)
7. DoubleClick
What did: delete 1 redirect in the advertising transition
What was measured: server response time (TTFB)
Result: a decrease in server delays by 1.5 seconds increases advertising transitions by 12%.
Source (archive of the article)
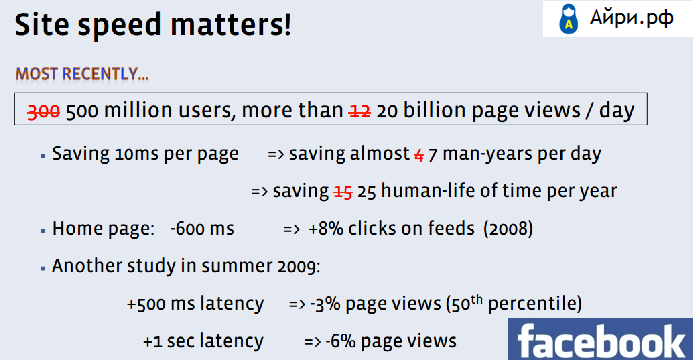
8. Facebook
What did: add a server delay before issuing pages
What was measured: server response time (TTFB)
Result: 0.5 seconds of delay reduces page views by 3%, 0.6 seconds of decreasing server response time gives + 8% of clicks on the tape
Source (presentation)
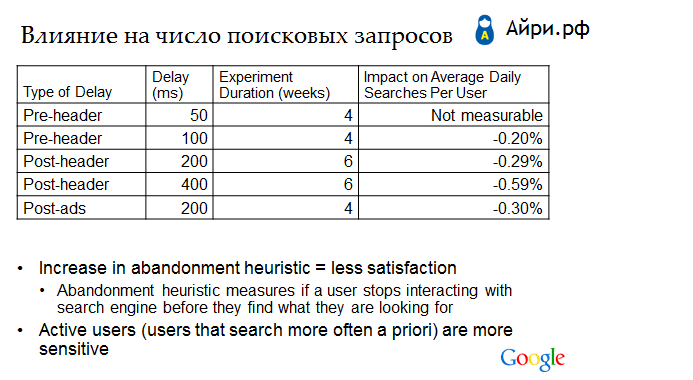
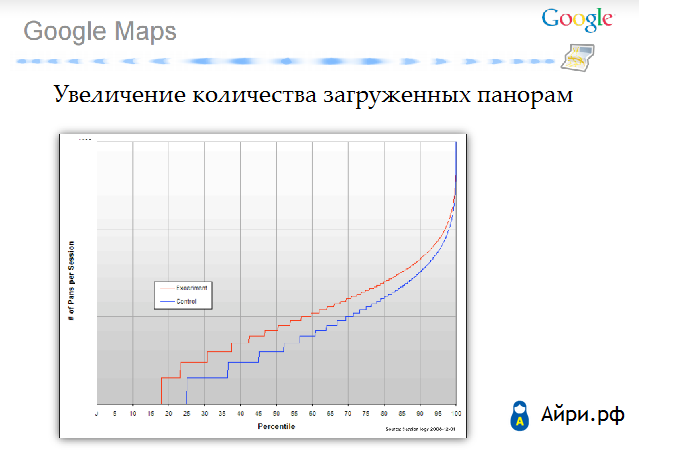
9. Google
What did: add a delay at different stages of loading pages
What was measured: server response time (TTFB), render time (DOMready)
Result: 0.2 second delay reduced the number of search queries by 0.3%.
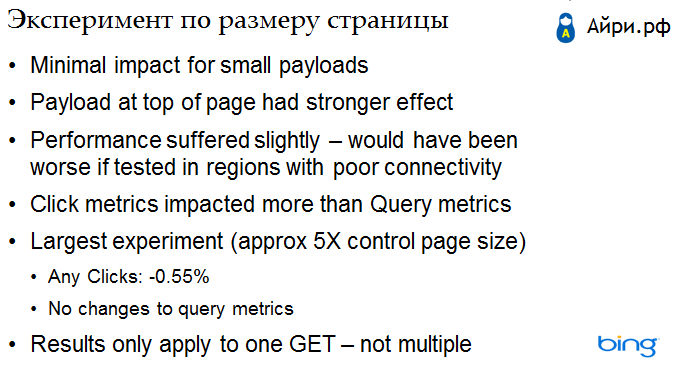
10. Bing
What did: made the page 5 times "harder"
What was measured: draw time (DOMready)
Result: “weighting” of the page 5 times reduced clicks by 0.55%
Source (presentation)
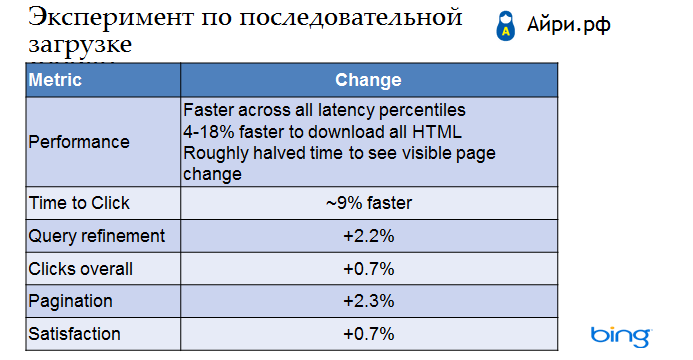
11. Bing
What did: accelerated the appearance of the first result on the browser screen
What was measured: draw time (DOMready)
Result: acceleration by 4-18% yielded 0.7% more clicks
Source (presentation)
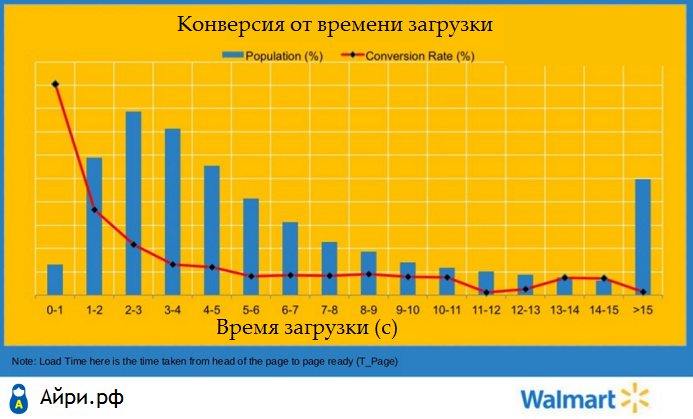
12. Walmart.com
What they did: measured the speed and conversion of the site, comprehensively accelerated the site
What was measured: the time from receiving a response by the user to full load (onload-TTFB).
Result: 1 second loading time gives + 2% conversion
Source (presentation)
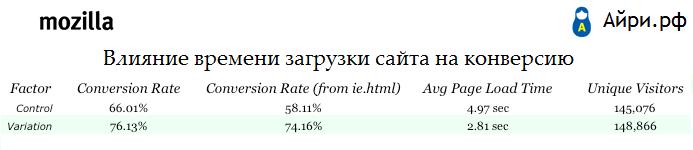
13. Firefox
What did: conducted A / B testing and comprehensive acceleration of the site
What was measured: time to fully load the page (onload)
Result: 2.16 seconds of download time gives 15.4% of the conversion (number of downloads)
Source (article)

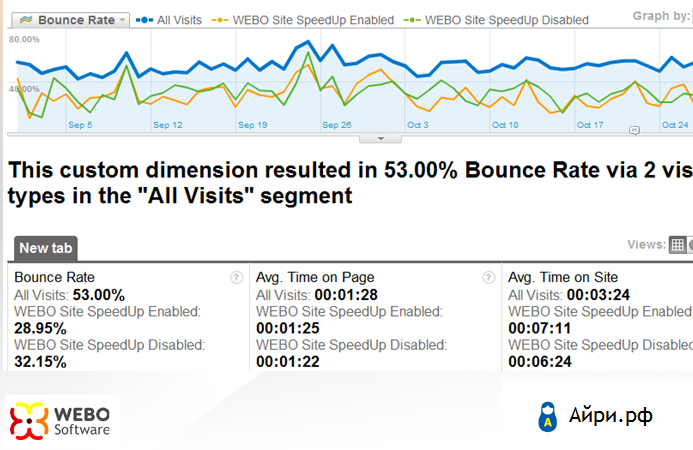
14. Manicurshop
What did: conducted a comprehensive acceleration of the site (vendor - WEBO Group)
What was measured: full load time (onload)
Result: reduction of the site loading time by 8.5 seconds gave + 40% conversion
Source (article)
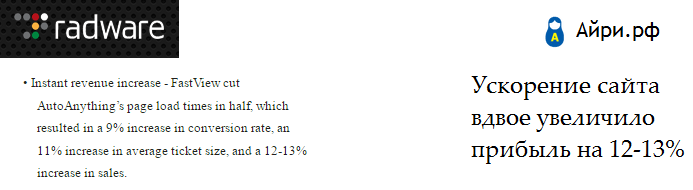
15. AutoAnything
What did: conducted a comprehensive acceleration of the site (vendor - Radware)
What was measured: full load time (onload)
Result: acceleration from 10 seconds to 5 seconds (twice) increased the conversion by 9%, the average check by 11% and revenue by 13%
Source (Google cache)
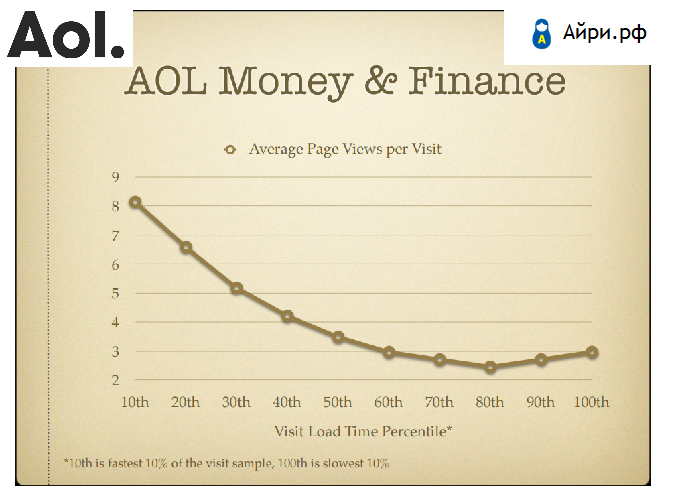
16. AOL
What did: measured the relationship between page load time and page views
What was measured: full load time (onload)
Result: the difference between the depth of site browsing for “slow” and “fast” users reaches 60%.
Source (presentation)
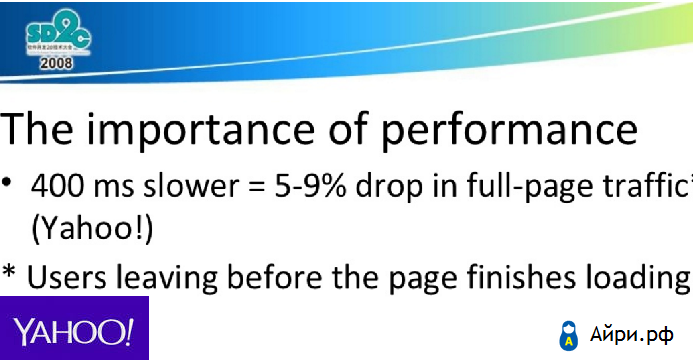
17. Yahoo!
What did you do: measured the relationship between page load time and bounce rate
What was measured: full load time (onload)
Result: 0.4 seconds of the site load time increase the bounce rate by 5-9%
Source (presentation)
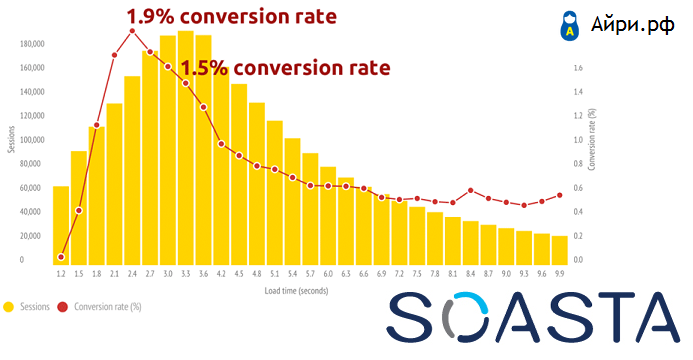
18. Soasta
What they did: measured the relationship between page load time and conversion for mobile users
What was measured: full load time (onload)
Result: when the difference in loading times of pages in 1 second, the difference in the conversion of mobile users reaches 27%, in the bounce rate - 56%
Source (article)
19. ICTTrainingen
What did: conducted A / B testing and comprehensive acceleration of the site (vendor - WEBO Group)
What was measured: full load time (onload)
Result: a decrease in the site loading time by 2.5 seconds increased the conversion by 2%, and the profit per visitor by 10%.
Source (article)

20. Etsy
What did: added 160 KB of images and measured the conversion
What was measured: full load time (onload)
Result: an additional 160 KB of images reduced the conversion of mobile users by 12%
Source (article)
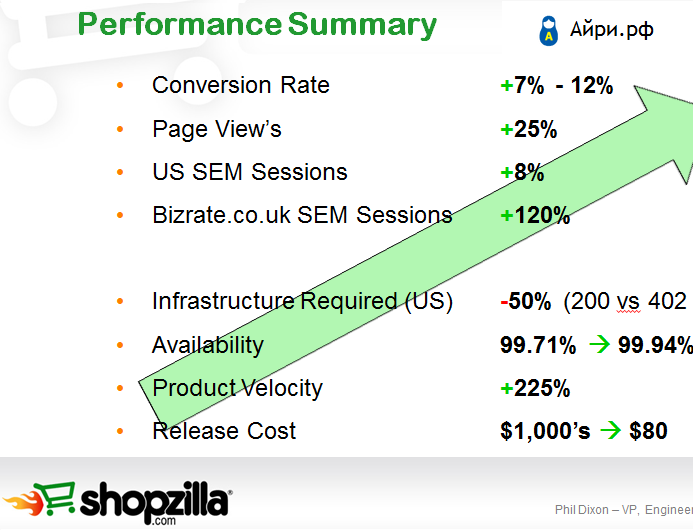
21. Shopzilla
What did: conducted a comprehensive acceleration of the site
What was measured: full load time (onload)
Result: a decrease in site loading time by 4.8 seconds increased conversion by 7-12% and page views by 25%
Source (presentation)
.
.
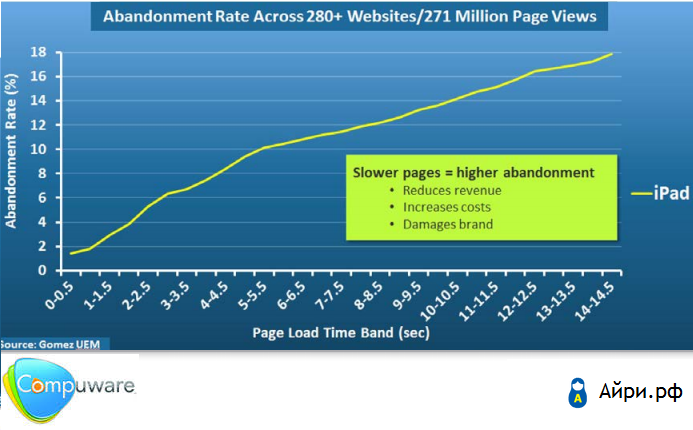
22. Compuware
What they did: measured the relationship between site load time and bounce rate (iPad)
What was measured: full load time (onload)
Result: 1 second delay in loading the site adds 2% to the bounce rate
Source (White Paper)
.
.
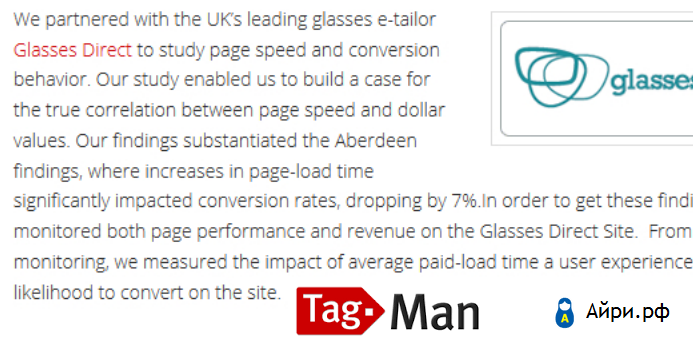
23. Glasses Direct
What did: conducted a comprehensive acceleration of the site (vendor - Aberdeen Group)
What was measured: full load time (onload)
Result: site acceleration for 1 second gave 6.7% conversion
Source (article print)
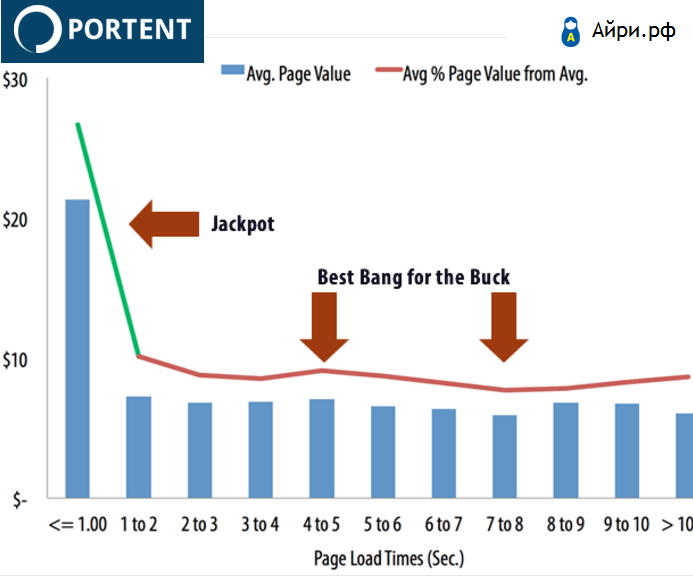
24. Portent
What did: measured the relationship between the load time of the site and the value of the page
What was measured: full load time (onload)
Result: website speeding up by 3 seconds increases page value by 18%.
Source (article)
.
.
.
.
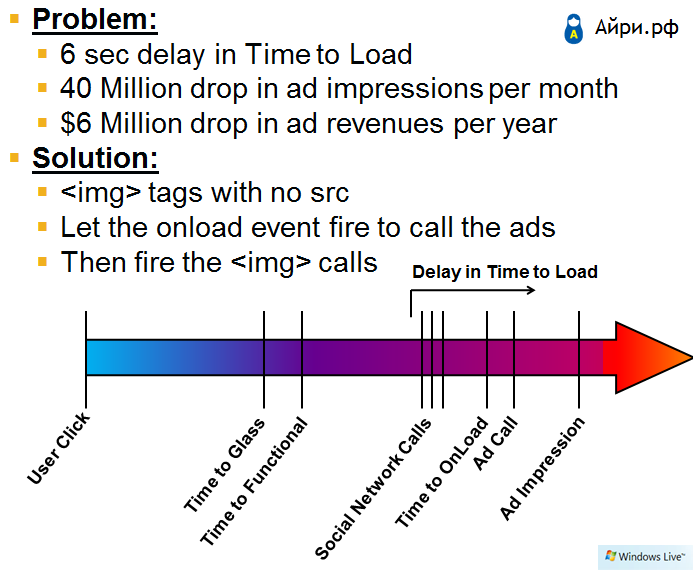
25. Hotmail
What did: optimize advertising downloads
What was measured: full load time (onload)
Result: the site acceleration for 6 seconds gave $ 6 million per year of advertising profit, 40 million more ad impressions per month
Source (presentation)
.
.
.
.
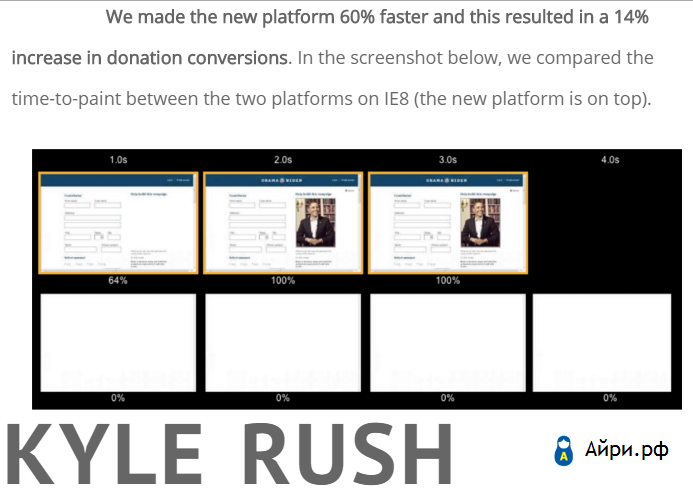
26. Kyle Rush
What did: conducted A / B testing and integrated acceleration of the site
What was measured: full load time (onload)
Result: website acceleration increased conversion by 2% by 2 seconds.
Source (article)
.
.
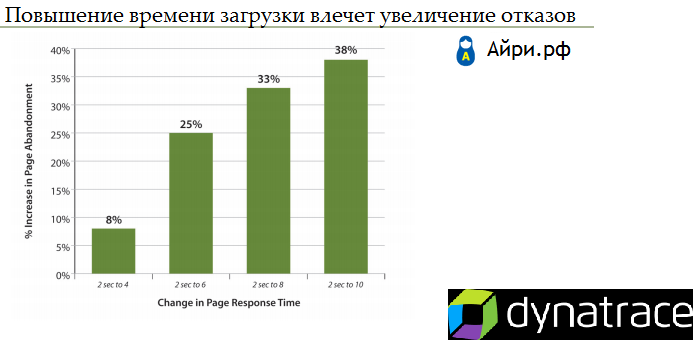
27. Compuware
What they did: measured the relationship between site load time and bounce rate
What was measured: full load time (onload)
Result: an increase in site loading time by 8 seconds increases the bounce rate by 38%.
Source (White Paper)
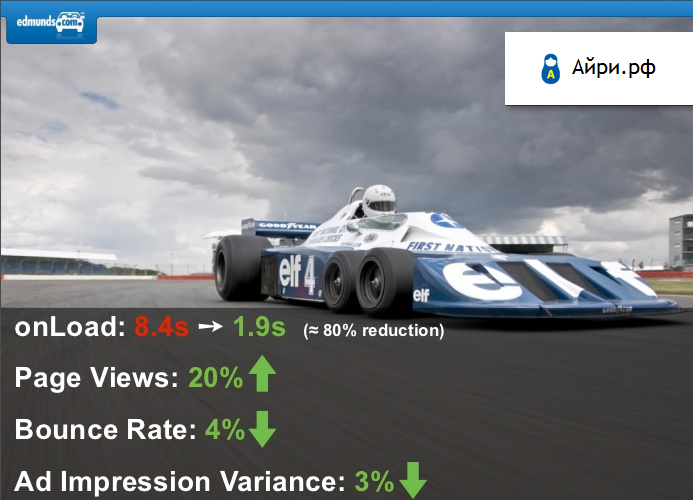
28. Edmunds
What did: conducted a comprehensive acceleration of the site
What was measured: full load time (onload)
Result: site acceleration by 6.5 seconds reduced failures by 4%, increased ad impressions by 3%, viewing depth by 20%
Source (presentation)
.
.
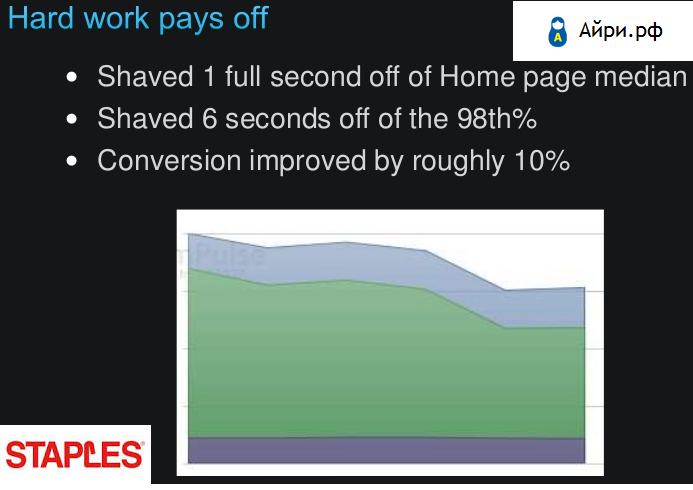
29. Staples
What did: conducted a comprehensive acceleration of the site
What was measured: full load time (onload)
Result: website acceleration increased conversion by 10% by 1 second.
Source (presentation)
.
.
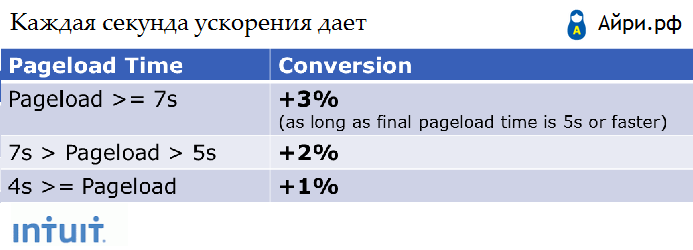
30. Intuit
What did: conducted A / B testing and integrated acceleration of the site
What was measured: full load time (onload)
Result: website acceleration increases conversion by 1% by 1 second.
Source (presentation)
31. Google
What did: worsened the quality of images for users with slow Internet
What was measured: full load time (onload)
Result: 30% reduction in page size gave 30% more requests from users.
Source (article)
Source: https://habr.com/ru/post/300210/
All Articles