Monetization of mobile games. Swrve research data

In February 2016, the Swrve marketing platform published the results of monetization studies. A separate chapter was devoted to mobile games, data for which was obtained by tracking the behavior and activities of millions of mobile players. The most interesting and relevant moments - in our article.
“Quality” of users
')
1.9% of players make purchases within applications during the month - this is a much more optimistic figure compared with January 2014 (only 1.5%).
What does this mean? The vast majority of players do not provide the application with any income. Therefore, the focus should be on quality, not quantity. Simply put, you need to take care of attracting those players who will be most active.
Time in mobile games
On average, monthly active players spend $ 24.66. This is $ 22 more than two years ago, which indicates an increase in the effectiveness of the marketing strategy in this area.
In-app purchases
In turn, the average number of purchases per month is 1.8, with an average price of $ 13.82. Without a doubt, users began to spend more time playing games.
The table below shows the percentage of “paid” players making the corresponding number of purchases - from 1 to 5 or more.
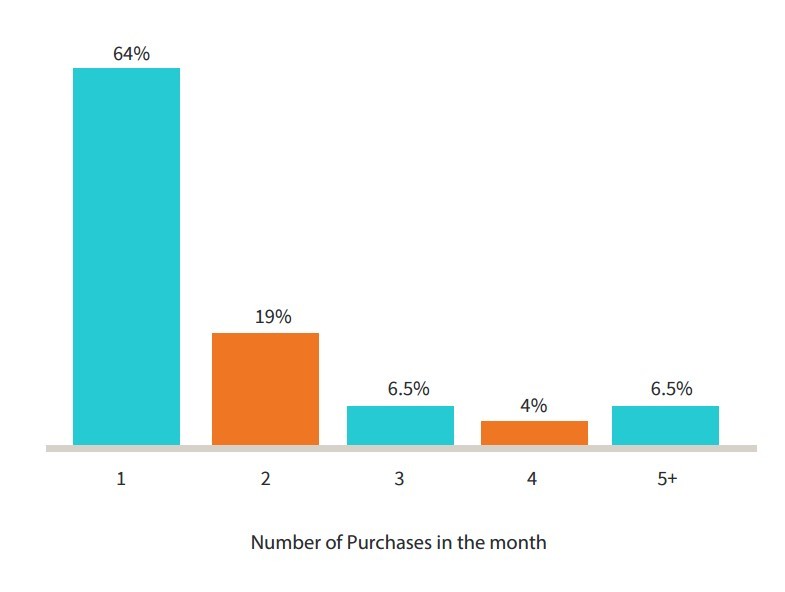
64% of all “paid” players make a single purchase per month . It should be noted that these data are relevant only for February 2016, and indicators for other months may be completely different.
7% of "paid" players make from 5 or more purchases per month . A trend is shown here - a small number of players make large purchases. “Merit” is whether users who are just starting to get acquainted with the game and use the maximum functionality for this, or developers who skillfully attract new players - is debatable.
The table below shows the number of purchases within applications (in dollars). Specified% of purchases from virtual baskets and% of total profits from baskets.
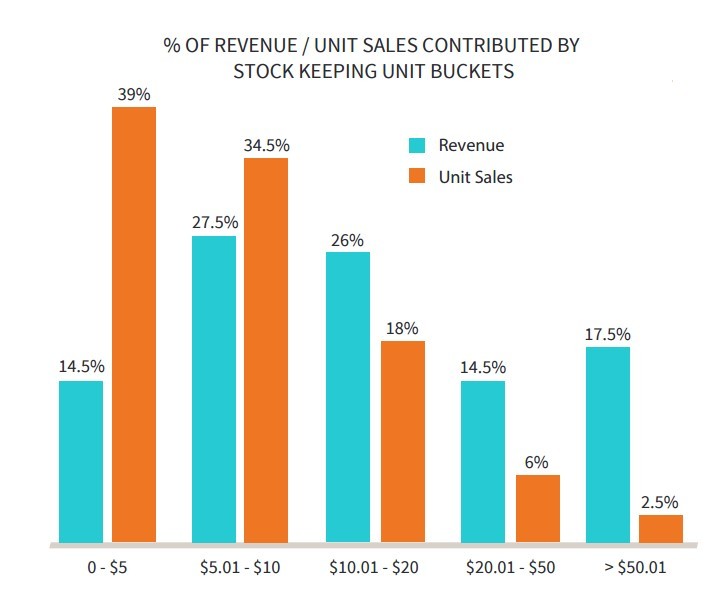
What do we see? Purchases from $ 0 to $ 5 make up 39% of the total number of purchases, but at the same time provide only 14.5% of total profits.
It is noteworthy that such a high volume of purchases (about $ 50), accounting for only 2.5% of the total number of purchases, represents as much as 18% of the total income.
This indicates the readiness of gamers to make purchases within applications from higher price categories.
"Paid" users
Of the total number of users, only a small part (10%) makes purchases during the month, which together account for more than 50% of total profits - less than 0.2% of all players. A year ago, this figure was close to 60%.
The graph below shows the income from the players. On the left - 10% of users who brought the smallest percentage of income. In the direction of the graph to the right - users who brought the greatest amount of income (10% of users as a unit).
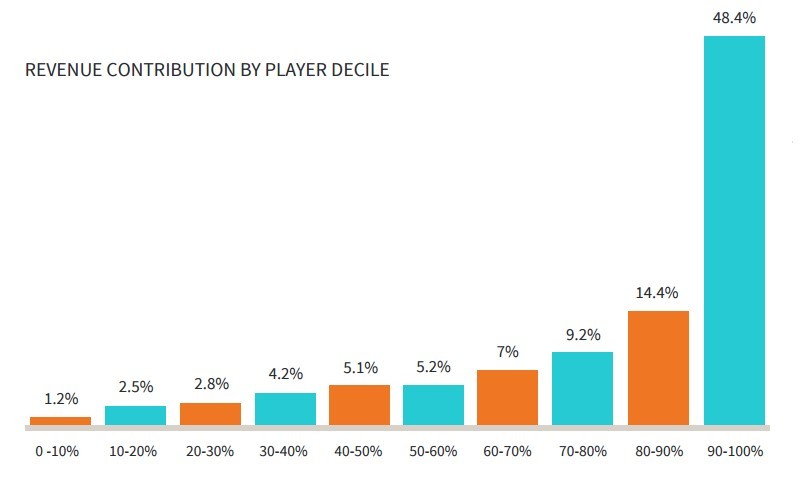
If you summarize these schedules, more than 48% of all revenues come from 0.19% of the total number of players!
60% of all “payers” (who make purchases per month) bring in just under 20% of total income. This suggests that not all “paid” players are equivalent in terms of the income they bring.
25% of all players were new, that is, they played games for the first time in February 2016 (the month of the study).
Conclusion: the mobile gaming market has become more “mature”, and their lifespan has lasted.
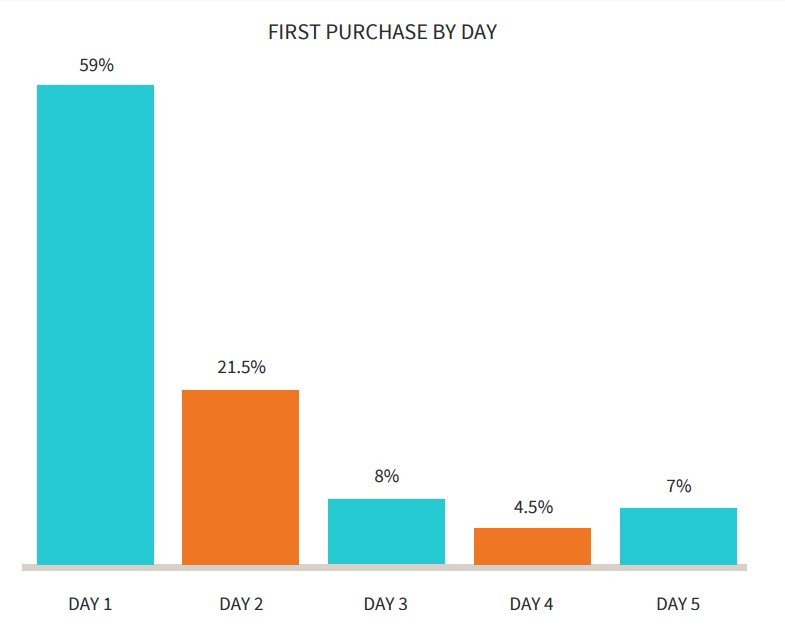
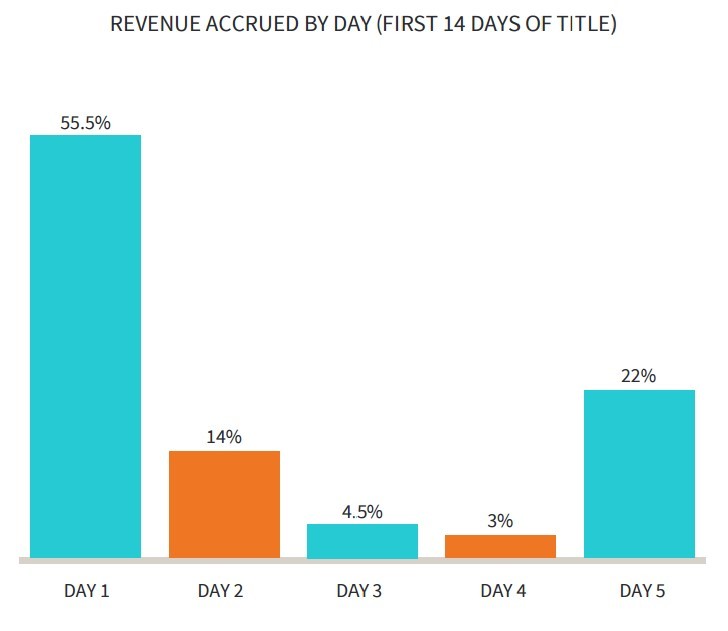
Shopping time
The graph shows the time of making the first purchase within 14 days. It is clearly visible that the players make the most purchases in the first days of the month.
New User Activity
The following graph shows the activity of new users. 55% of all users make purchases on the first day of registration.
The chart below shows repeated purchases of new users within 14 days after registration. As you can see, 56% of newbies make repeated purchases, and about 11% make 5 or more purchases in the first 14 days.


BYYD • Mobile Advertising Platform
Source: https://habr.com/ru/post/300098/
All Articles