5 reports that will be useful to each project
Competition between applications for traffic and per unit of free user time is constantly increasing. In such harsh conditions, it is important to correctly assess the state of your project, find bottlenecks and growth points, make quick decisions on its development — the analyst helps you in all these situations. We at devtodev have compiled a selection of the most important reports that will be useful for both the marketer, the analyst, and the project manager.
The main part of the analytical conclusions can be made on the basis of metrics - these are exactly those 20% of the system's functionality that answer 80% of the questions. The Usage and Payment metrics reports allow you to examine key metrics, compare them, and identify trends in project development.
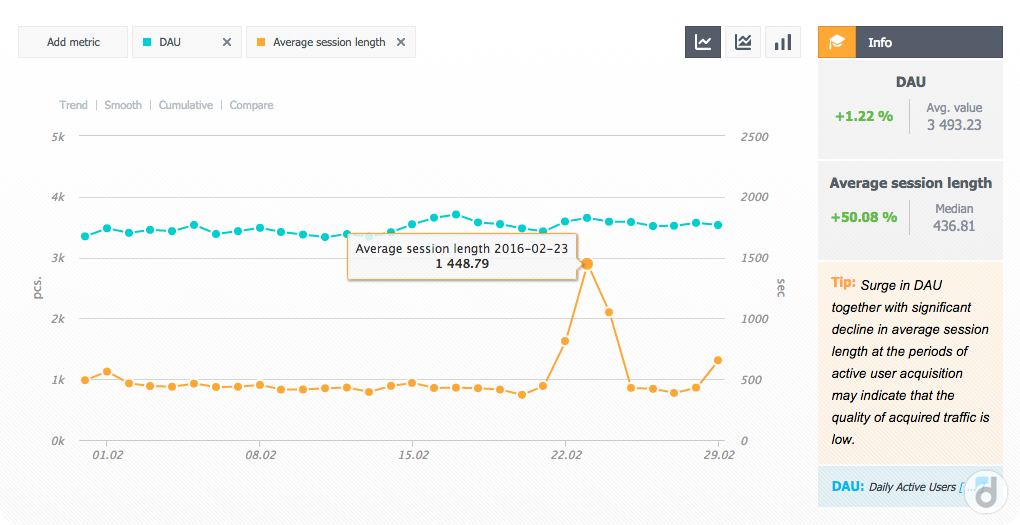
The Usage report was created in order to study user activity:
Usage is able to answer a variety of questions. For example, analyzing the average length of a user's session over a period of three months, it is possible to draw conclusions about whether the output of a new section in a project influenced user activity. And comparing the dynamics of DAU (daily audience) and MAU (monthly audience), one can assess how regularly users enter the project.
')
The Payment metrics report contains all payment metrics:

At the same time, both reports can be built both across the mass of users, and over any section: traffic sources, application versions, country, device, user language, any user segment.
Try to measure ARPU by country and determine where the average income per user is higher - this will help you plan to enter the market of this country.
In addition, in the Usage and Payment metrics reports, you can compare the values of metrics with any other period. This helps to assess the effectiveness of the new functionality of the application or to conduct a cohort analysis.
Let's say that in April you changed the prices inside the application, and you want to evaluate how this affected the income from the paying user. All you need to do is to build an ARPPU report (average income per paying user) for March and compare it with April data.
As a rule, analytical systems either work with traffic or build reports on user behavior. devtodev combines both functions: you can analyze behavior and traffic at the same time — for example, build conversion funnels for different traffic sources to compare the quality of the sources. In addition, devtodev can get traffic data from most modern trackers: Adjust, Tune, AppsFlyer.
The 3rd party attribution report invites you to select any metrics for analyzing traffic sources and any cuts in which you want to submit data. For example, you decided to evaluate the quality of the channels by metrics:

The report columns contain metrics (you can select up to 10 any metrics), and in the rows - sections of traffic sources: first, the data is broken down by campaign, then by sub publishers. You can also select any cuts: country, site, campaign, device, and so on.
With the help of 3rd party attribution, you can find inefficient sources of traffic and quickly turn them off, transferring traffic to those sources that pay off better. Direct savings!
By launching your project for the first time, the user answers the question whether he is interested in this application, how it differs from others, what is its value. The first session largely determines the further long-term retention and successful monetization of the project. Therefore, it is very important to make the moment of dating ideal for the user.
For this devtodev has a report Tutorial steps , which allows you to select more than a hundred (!) Steps in the first session, build a schedule of activity on these steps and find bottlenecks in which users experience difficulties and / or leave the application forever.

Example of working with Tutorial steps : one of our clients has integrated 120 steps of the game project tutorial. Among them were those that are not visible to the user: loading textures, loading levels, and so on. Thanks to such detailed integration, we found out that users fall off exactly on these steps, invisible from the outside. The project carried out technical optimization and reduced user outflow by 15%, which increased retention rates by 8-10%.
If users started to pay into your project - this is already great. Now we need to understand their behavior: when people pay and for what, how their activity changes over time, how regularly they pay, and so on. For this, there is a Payment analysis report group in devtodev, and we will analyze one of them - the Users & gross structure .
With the help of Users & Gross Structure, you can study the structure of the paying audience and income in terms of the time that has passed since the user registered.

On the first screen above, it is noticeable that the size of the paying audience is generally stable, but a cut in time from the moment of registration helps to notice the following signals:
We know that over time, user payments to the project usually grow, so the graph reflects a dangerous situation - the project loses those paying users who have been registered for a long time.
The second graph shows that the situation affects the dynamics of income. Income from users, from the moment of registration which has passed less than 3 months, is stable, and the general decline is explained by the decrease in payments from “old men”. Conclusion - you need to save the "oldies" and return them to the project. This can be done by sending them a push notification with a gift or bonus.
LTV prediction is one of the most difficult and interesting questions in analytics. Usually, the forecast is required urgently, but in order to get it accurate, you need to wait some time. It turns out to be a contradiction, and various methods of calculating LTV are trying to deal with it.
LTV helps to determine the price range for which you need to buy traffic - you need one average user to bring in more money than was spent on attracting traffic. devtodev allows you to predict LTV, and this is how it works:

The LTV forecast is quick and accurate, helping you to predict revenue and determine the purchase price of future users.
Thus, with the help of the devtodev reports you can at any time:
And these are just a few examples of how to improve the performance of your application with the help of analytics. Our reports do not just collect a large amount of incomprehensible data - they draw your attention to the problems of the project and help to find a quick way to solve them. See how it works with a demo project, or check on real data - for this we offer a free trial for 30 days with access to the full functionality of the platform.
Usage and Payment metrics reports
The main part of the analytical conclusions can be made on the basis of metrics - these are exactly those 20% of the system's functionality that answer 80% of the questions. The Usage and Payment metrics reports allow you to examine key metrics, compare them, and identify trends in project development.
The Usage report was created in order to study user activity:
- number of users (DAU, MAU, WAU),
- session options
- average time spent in the project (lifetime)
- the number of users online (updated every five minutes) and so on.
Usage is able to answer a variety of questions. For example, analyzing the average length of a user's session over a period of three months, it is possible to draw conclusions about whether the output of a new section in a project influenced user activity. And comparing the dynamics of DAU (daily audience) and MAU (monthly audience), one can assess how regularly users enter the project.
')
The Payment metrics report contains all payment metrics:
- ARPU and ARPPU,
- average check
- share of paying users,
- total income and so on.
At the same time, both reports can be built both across the mass of users, and over any section: traffic sources, application versions, country, device, user language, any user segment.
Try to measure ARPU by country and determine where the average income per user is higher - this will help you plan to enter the market of this country.
In addition, in the Usage and Payment metrics reports, you can compare the values of metrics with any other period. This helps to assess the effectiveness of the new functionality of the application or to conduct a cohort analysis.
Let's say that in April you changed the prices inside the application, and you want to evaluate how this affected the income from the paying user. All you need to do is to build an ARPPU report (average income per paying user) for March and compare it with April data.
3rd party attribution
As a rule, analytical systems either work with traffic or build reports on user behavior. devtodev combines both functions: you can analyze behavior and traffic at the same time — for example, build conversion funnels for different traffic sources to compare the quality of the sources. In addition, devtodev can get traffic data from most modern trackers: Adjust, Tune, AppsFlyer.
The 3rd party attribution report invites you to select any metrics for analyzing traffic sources and any cuts in which you want to submit data. For example, you decided to evaluate the quality of the channels by metrics:
- Gross (total revenue from users from one source)
- Installs (total number of users from source)
- Installs cost (total price of all users from the source)
- ARPU (average income brought by one user from a given source)
- 1-day retention (percentage of users from the source who returned to the application the day after the first visit)
- 7-days retention (percentage of users from the source who returned to the application seven days after the first visit)
- ROI 14 (measure of traffic payback 14 days after the start of the campaign)
- ROI 30 (indicator of traffic payback 30 days after the start of the campaign)
The report columns contain metrics (you can select up to 10 any metrics), and in the rows - sections of traffic sources: first, the data is broken down by campaign, then by sub publishers. You can also select any cuts: country, site, campaign, device, and so on.
With the help of 3rd party attribution, you can find inefficient sources of traffic and quickly turn them off, transferring traffic to those sources that pay off better. Direct savings!
Tutorial steps
By launching your project for the first time, the user answers the question whether he is interested in this application, how it differs from others, what is its value. The first session largely determines the further long-term retention and successful monetization of the project. Therefore, it is very important to make the moment of dating ideal for the user.
For this devtodev has a report Tutorial steps , which allows you to select more than a hundred (!) Steps in the first session, build a schedule of activity on these steps and find bottlenecks in which users experience difficulties and / or leave the application forever.
Example of working with Tutorial steps : one of our clients has integrated 120 steps of the game project tutorial. Among them were those that are not visible to the user: loading textures, loading levels, and so on. Thanks to such detailed integration, we found out that users fall off exactly on these steps, invisible from the outside. The project carried out technical optimization and reduced user outflow by 15%, which increased retention rates by 8-10%.
Users & gross structure
If users started to pay into your project - this is already great. Now we need to understand their behavior: when people pay and for what, how their activity changes over time, how regularly they pay, and so on. For this, there is a Payment analysis report group in devtodev, and we will analyze one of them - the Users & gross structure .
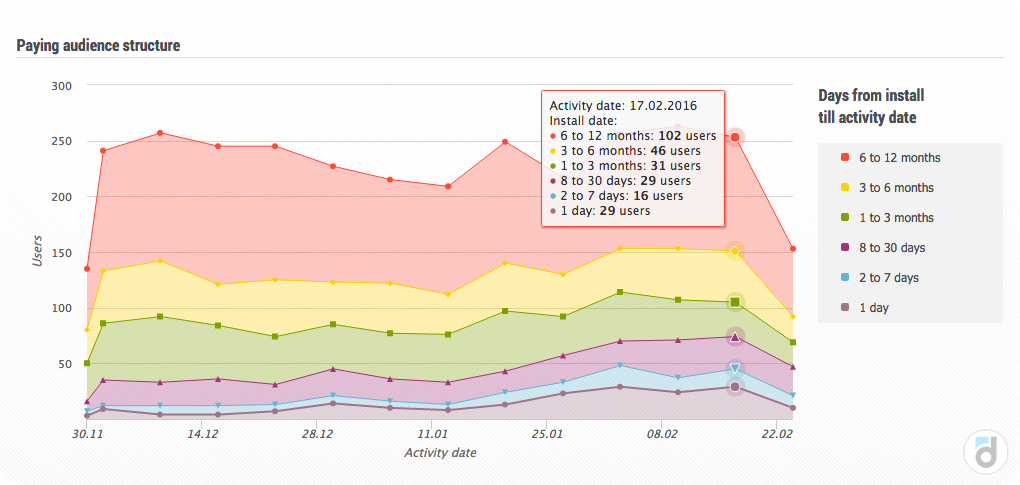
With the help of Users & Gross Structure, you can study the structure of the paying audience and income in terms of the time that has passed since the user registered.
On the first screen above, it is noticeable that the size of the paying audience is generally stable, but a cut in time from the moment of registration helps to notice the following signals:
- the number of paying novice users (less than a month from the date of registration) is growing;
- and the number of “oldies” paying users is decreasing.
We know that over time, user payments to the project usually grow, so the graph reflects a dangerous situation - the project loses those paying users who have been registered for a long time.
The second graph shows that the situation affects the dynamics of income. Income from users, from the moment of registration which has passed less than 3 months, is stable, and the general decline is explained by the decrease in payments from “old men”. Conclusion - you need to save the "oldies" and return them to the project. This can be done by sending them a push notification with a gift or bonus.
LTV forecast
LTV prediction is one of the most difficult and interesting questions in analytics. Usually, the forecast is required urgently, but in order to get it accurate, you need to wait some time. It turns out to be a contradiction, and various methods of calculating LTV are trying to deal with it.
LTV helps to determine the price range for which you need to buy traffic - you need one average user to bring in more money than was spent on attracting traffic. devtodev allows you to predict LTV, and this is how it works:
- the monetization of the project is taken as a basis; knowing that payments change over time, we count how much they will bring to you for the entire time you are in the project;
- in parallel, in the devtodev database, we are looking for projects that are similar to yours by genre, by platform, by metric values; their data help to correct the forecast.
The LTV forecast is quick and accurate, helping you to predict revenue and determine the purchase price of future users.
Reports that really help
Thus, with the help of the devtodev reports you can at any time:
- understand what is happening with your project right now (Usage, Payment metrics),
- find bottlenecks in the process of familiarizing the user with the application (Tutorial steps report),
- determine the growth points of your project (Users & Gross structure),
- analyze party traffic (3rd party attribution)
- determine in advance how much money one user will bring (LTV Forecast).
And these are just a few examples of how to improve the performance of your application with the help of analytics. Our reports do not just collect a large amount of incomprehensible data - they draw your attention to the problems of the project and help to find a quick way to solve them. See how it works with a demo project, or check on real data - for this we offer a free trial for 30 days with access to the full functionality of the platform.
Source: https://habr.com/ru/post/299090/
All Articles