Love Index on the map of Russia, spring 2016: a study of the emotional state of social media users
Spring is a time of love. And let the beginning of the calendar spring be marked for the Russians by extreme snowfalls and weather cataclysms - love won again. Brand Analytics presents new data on the emotional state of social network users in the regions of Russia. The sixth study showed another record of the ratio of positive and negative emotions in public messages of Russian social media users: “Love Index” in February-March 2016 was 5.9 , which means that Russians left 6 times more messages about love in social media than hate
As in previous studies, Russian-language references to “love” and “hatred” from the first person in the present tense were analyzed : positive emotions (for example, “I love”, “I love”, “I am crazy”, “I am happy” , etc. p.) and negative ( “I hate,” “annoys me,” “enrages,” “hate tweet,” etc.). To determine the messages that meet the above criteria, for the specified period of time, 580 million Russian-language messages from 37 million authors from popular social networks were analyzed: VKontakte, Facebook, Twitter, LiveJournal, Instagram, etc. The research period is February 4 - March 3, 2016
During the study period, positive and negative emotions were cumulatively mentioned in 8.5 million messages , of which 85.2% messages were about love and only 14.8% were about hate .
')
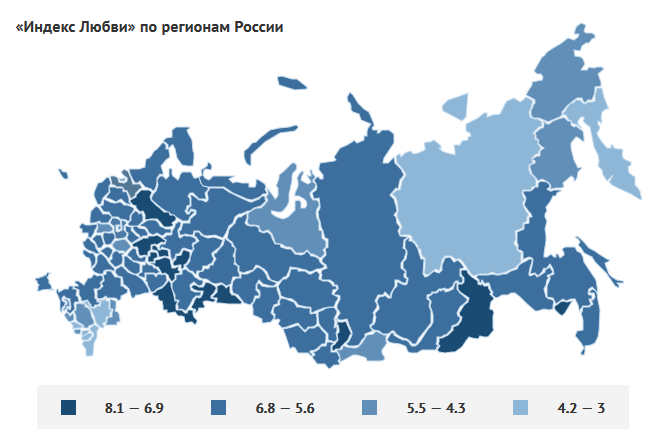
For each subject of the Russian Federation, the “Index of Love” * was calculated, based on which regions of the most positive and negative could be identified. At the same time, the “Index of Love” in the regions of Russia expanded the range of values. If in the summer of 2015 the index changed from 2.7 to 5.1, then in the spring the values of the index vary from 3.0 to 7.8.
However, it is worth noting that despite the growth of the “Index of Love”, user messages have become less personal than in previous surveys. If earlier most of the messages about love related to loved ones - children, parents, spouses, now users more often “confess their love” to their favorite musicians, songs, films, good weather and cats.
Leading regions:
The Leningrad region moved to the first place in the ranking , which occupied the second line in the summer, with an index of 7.8. In second place, with an index of 7.4 - Trans-Baikal Territory . Next - Kurgan and Jewish Autonomous Region with an index of 7.2 , Orenburg Region - 7.1 , and the fifth line with the index of 7.0 was divided by the Udmurt Republic and the former leader of the rating - the Republic of Mari El.
Regions with the lowest “Love Index” value:
Among the regions with the lowest Love Index, all regions have increased their indices. On the 85th line of the rating is the Chechen Republic with an index of 3.0. On the 84th line - the Republic of Ingushetia with an index of 3.1, on the 83rd - the Republic of Dagestan with an index of 3.3 . The index in the Kabardino-Balkarian Republic and the Republic of Sakha (Yakutia) is slightly higher - 3.6 and 4.0, respectively .
The most significant rotations in changing positions occurred in regions with an average “Love Index”.
Growth leaders:
The largest growth of positions in the ranking was shown by the Jewish Autonomous Region - plus 43 points compared to last summer. It is significant that it was in the residents of the Jewish Autonomous Region that a high number of personal emotional declarations of love for friends and lovers were published. Thus, it can be said that a wave of love has truly swept the growth leader.
The Penza region also rose significantly in positions in the rating in 36 positions in the rating , the Irkutsk region in 35 positions, the Oryol region in 33 positions, and the Altai Territory in 30 positions .
It is important to note that despite the abundance of negative news in the media, social media users maintain a positive attitude and generate a positive information field around themselves. In this study, as in all previous ones, we observed a steady increase in positive in Russia. The “Love Index” in Russia as a whole grew from 2.6 in July 2013 to the current figure of 5.9.
“Love Index” by regions of Russia
* The index is calculated as the ratio of the number of messages of love to the number of messages of hate.
As in previous studies, Russian-language references to “love” and “hatred” from the first person in the present tense were analyzed : positive emotions (for example, “I love”, “I love”, “I am crazy”, “I am happy” , etc. p.) and negative ( “I hate,” “annoys me,” “enrages,” “hate tweet,” etc.). To determine the messages that meet the above criteria, for the specified period of time, 580 million Russian-language messages from 37 million authors from popular social networks were analyzed: VKontakte, Facebook, Twitter, LiveJournal, Instagram, etc. The research period is February 4 - March 3, 2016
During the study period, positive and negative emotions were cumulatively mentioned in 8.5 million messages , of which 85.2% messages were about love and only 14.8% were about hate .
')
For each subject of the Russian Federation, the “Index of Love” * was calculated, based on which regions of the most positive and negative could be identified. At the same time, the “Index of Love” in the regions of Russia expanded the range of values. If in the summer of 2015 the index changed from 2.7 to 5.1, then in the spring the values of the index vary from 3.0 to 7.8.
However, it is worth noting that despite the growth of the “Index of Love”, user messages have become less personal than in previous surveys. If earlier most of the messages about love related to loved ones - children, parents, spouses, now users more often “confess their love” to their favorite musicians, songs, films, good weather and cats.
Leading regions:
The Leningrad region moved to the first place in the ranking , which occupied the second line in the summer, with an index of 7.8. In second place, with an index of 7.4 - Trans-Baikal Territory . Next - Kurgan and Jewish Autonomous Region with an index of 7.2 , Orenburg Region - 7.1 , and the fifth line with the index of 7.0 was divided by the Udmurt Republic and the former leader of the rating - the Republic of Mari El.
Regions with the lowest “Love Index” value:
Among the regions with the lowest Love Index, all regions have increased their indices. On the 85th line of the rating is the Chechen Republic with an index of 3.0. On the 84th line - the Republic of Ingushetia with an index of 3.1, on the 83rd - the Republic of Dagestan with an index of 3.3 . The index in the Kabardino-Balkarian Republic and the Republic of Sakha (Yakutia) is slightly higher - 3.6 and 4.0, respectively .
The most significant rotations in changing positions occurred in regions with an average “Love Index”.
Growth leaders:
The largest growth of positions in the ranking was shown by the Jewish Autonomous Region - plus 43 points compared to last summer. It is significant that it was in the residents of the Jewish Autonomous Region that a high number of personal emotional declarations of love for friends and lovers were published. Thus, it can be said that a wave of love has truly swept the growth leader.
The Penza region also rose significantly in positions in the rating in 36 positions in the rating , the Irkutsk region in 35 positions, the Oryol region in 33 positions, and the Altai Territory in 30 positions .
It is important to note that despite the abundance of negative news in the media, social media users maintain a positive attitude and generate a positive information field around themselves. In this study, as in all previous ones, we observed a steady increase in positive in Russia. The “Love Index” in Russia as a whole grew from 2.6 in July 2013 to the current figure of 5.9.
“Love Index” by regions of Russia
| N | Region | Index | Love | Hatred | Delta |
| one | Leningrad region | 7,8 | 88.64% | 11.36% | one |
| 2 | Transbaikal region | 7.4 | 88.04% | 11.96% | 14 |
| 3 | Kurgan region | 7.2 | 87.86% | 12.14% | nineteen |
| four | Jewish Autonomous Region | 7.2 | 87.84% | 12.16% | 43 |
| five | Orenburg region | 7.1 | 87.65% | 12.35% | 2 |
| 6 | Mari El Republic | 7.0 | 87.55% | 12.45% | -five |
| 7 | Udmurtia | 7.0 | 87.43% | 12.57% | 14 |
| eight | Vologodskaya Oblast | 6.9 | 87.41% | 12.59% | -five |
| 9 | Chelyabinsk region | 6.9 | 87.40% | 12.60% | -four |
| ten | Republic of Tatarstan | 6.9 | 87.35% | 12.65% | -four |
| eleven | Nizhny Novgorod Region | 6.9 | 87.30% | 12.70% | four |
| 12 | Oryol Region | 6.8 | 87.25% | 12.75% | 33 |
| 13 | Republic of Karelia | 6.8 | 87.23% | 12.77% | -9 |
| 14 | Arkhangelsk region | 6.7 | 87.05% | 12.95% | 0 |
| 15 | Kostroma region | 6.7 | 87.02% | 12.98% | -four |
| sixteen | Nenets Autonomous Okrug | 6.7 | 86.98% | 13.02% | 9 |
| 17 | Ivanovo region | 6,6 | 86.90% | 13.10% | eleven |
| 18 | Republic of Bashkortostan | 6,6 | 86.86% | 13.14% | -ten |
| nineteen | Komi Republic | 6,6 | 86.85% | 13.15% | -9 |
| 20 | The Republic of Buryatia | 6,6 | 86.85% | 13.15% | 12 |
| 21 | Kirov region | 6,6 | 86.79% | 13.21% | -3 |
| 22 | Pskov region | 6,6 | 86.76% | 13.24% | -2 |
| 23 | Ulyanovsk region | 6.5 | 86.64% | 13.36% | -four |
| 24 | Lipetsk region | 6.5 | 86.64% | 13.36% | 17 |
| 25 | The Republic of Mordovia | 6.4 | 86.53% | 13.47% | 14 |
| 26 | Penza region | 6.4 | 86.52% | 13.48% | 36 |
| 27 | Smolensk region | 6.4 | 86.50% | 13.50% | 7 |
| 28 | The Republic of Khakassia | 6.4 | 86.41% | 13.59% | -nineteen |
| 29 | Tambov Region | 6.3 | 86.35% | 13.65% | -sixteen |
| thirty | Novgorod region | 6.3 | 86.32% | 13.68% | -7 |
| 31 | Irkutsk region | 6.3 | 86.24% | 13.76% | 35 |
| 32 | Sevastopol | 6.2 | 86.19% | 13.81% | 18 |
| 33 | Tver region | 6.2 | 86.18% | 13.82% | -2 |
| 34 | Yaroslavskaya oblast | 6.2 | 86.13% | 13.87% | 3 |
| 35 | Sverdlovsk region | 6.2 | 86.05% | 13.95% | -eleven |
| 36 | Vladimir region | 6.1 | 85.98% | 14.02% | 12 |
| 37 | Tyumen region | 6.1 | 85.97% | 14.03% | -20 |
| 38 | Altai region | 6.1 | 85.97% | 14.03% | thirty |
| 39 | Kemerovo region | 6.1 | 85.92% | 14.08% | -one |
| 40 | Belgorod region | 6.1 | 85.83% | 14.17% | 2 |
| 41 | Chuvash Republic | 6.0 | 85.81% | 14.19% | -29 |
| 42 | Bryansk region | 6.0 | 85.80% | 14.20% | -7 |
| 43 | Novosibirsk region | 6.0 | 85.78% | 14.22% | 17 |
| 44 | Moscow region | 6.0 | 85.73% | 14.27% | -17 |
| 45 | Sakhalin region | 6.0 | 85.72% | 14.28% | 12 |
| 46 | Perm region | 6.0 | 85.71% | 14.29% | 13 |
| 47 | Samara Region | 6.0 | 85.62% | 14.38% | -four |
| 48 | Republic of Crimea | 6.0 | 85.61% | 14.39% | -four |
| 49 | Krasnodar region | 5.9 | 85.47% | 14.53% | four |
| 50 | Rostov region | 5.9 | 85.42% | 14.58% | 2 |
| 51 | Kaliningrad region | 5.8 | 85.38% | 14.62% | -15 |
| 52 | Omsk region | 5.8 | 85.37% | 14.63% | 12 |
| 53 | Saratov region | 5.8 | 85.37% | 14.63% | 18 |
| 54 | Krasnoyarsk region | 5.8 | 85.34% | 14.66% | -25 |
| 55 | Altai Republic | 5.8 | 85.27% | 14.73% | 0 |
| 56 | Khanty-Mansi Autonomous Area | 5.8 | 85.26% | 14.74% | -26 |
| 57 | Kursk region | 5.8 | 85.26% | 14.74% | -24 |
| 58 | Murmansk region | 5.8 | 85.19% | 14.81% | 0 |
| 59 | Tula region | 5.7 | 85.18% | 14.82% | -3 |
| 60 | Tomsk region | 5.7 | 85.08% | 14.92% | 15 |
| 61 | Volgograd region | 5.6 | 84.96% | 15.04% | -7 |
| 62 | Amur region | 5.6 | 84.93% | 15.07% | 12 |
| 63 | Khabarovsk region | 5.6 | 84.88% | 15.12% | 6 |
| 64 | Voronezh region | 5.6 | 84.81% | 15.19% | one |
| 65 | Primorsky Krai | 5.6 | 84.73% | 15.27% | eight |
| 66 | Ryazan Oblast | 5.5 | 84.62% | 15.38% | -five |
| 67 | Astrakhan region | 5.5 | 84.60% | 15.40% | -four |
| 68 | Chukotka Autonomous Region | 5.4 | 84.33% | 15.67% | eleven |
| 69 | Yamalo-Nenets Autonomous District | 5.3 | 84.24% | 15.76% | -18 |
| 70 | Moscow | 5.3 | 84.11% | 15.89% | -21 |
| 71 | St. Petersburg | 5.2 | 83.90% | 16.10% | -four |
| 72 | Stavropol region | 5.1 | 83.67% | 16.33% | -2 |
| 73 | Kaluga region | 5.1 | 83.62% | 16.38% | -27 |
| 74 | Republic of Adygea | 5.1 | 83.61% | 16.39% | -2 |
| 75 | Tyva Republic | 4.9 | 83.16% | 16.84% | -35 |
| 76 | Magadan Region | 4.9 | 83.01% | 16.99% | one |
| 77 | Republic of Karachay-Cherkessia | 4.7 | 82.43% | 17.57% | 3 |
| 78 | Republic of North Ossetia | 4.4 | 81.38% | 18.62% | 0 |
| 79 | Kamchatka Krai | 4.2 | 80.78% | 19.22% | -3 |
| 80 | Republic of Kalmykia | 4.1 | 80.41% | 19.59% | -54 |
| 81 | The Republic of Sakha (Yakutia) | 4.0 | 80.09% | 19.91% | one |
| 82 | Kabardino-Balkaria | 3.6 | 78.10% | 21.90% | -one |
| 83 | The Republic of Dagestan | 3.3 | 76.61% | 23.39% | one |
| 84 | The Republic of Ingushetia | 3.1 | 75.37% | 24.63% | -one |
| 85 | Chechen Republic | 3.0 | 75.26% | 24.74% | 0 |
* The index is calculated as the ratio of the number of messages of love to the number of messages of hate.
Source: https://habr.com/ru/post/299078/
All Articles