My Circle Results Report for January 2016
We continue to publish our monthly reports on what specialties in the IT industry are the most popular according to statistics from My Circle . Let's see how many responses were on average to the vacancy in the most popular areas of activity in January. Then take a look at the overall trend in the average response over the past 4 months. And finally, let's look at the most popular vacancies in January by the number of responses.
In December, we made our clients a New Year offer , according to which, vacancies placed from December 9 to 31, at the end of the placement period, will be automatically extended by us for another month. We had about 250 such vacancies. In total, together with them, 688 vacancies were placed in January. In this case, when calculating the average response, we consider only those responses that were left directly in January.
')
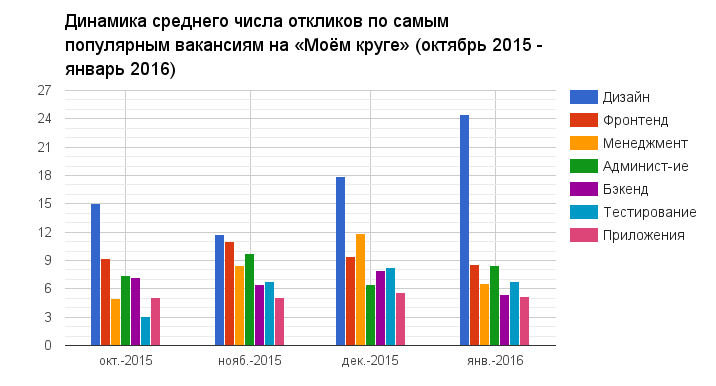
Next, we look at the overall trend in the average number of responses in the most popular areas of activity.
Then look at the traditional top of the most popular IT-vacancies of the month: one vacancy from each activity. The popularity of a vacancy is measured by the number of responses to it. All these vacancies are open at the time of publication of the report, you can respond to them.
In December, we made our clients a New Year offer , according to which, vacancies placed from December 9 to 31, at the end of the placement period, will be automatically extended by us for another month. We had about 250 such vacancies. In total, together with them, 688 vacancies were placed in January. In this case, when calculating the average response, we consider only those responses that were left directly in January.
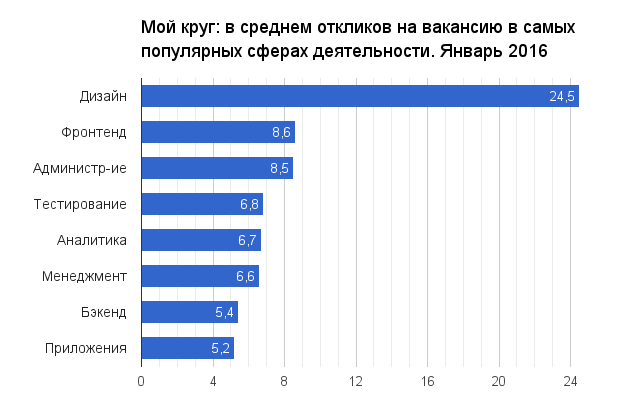
- For the fourth month in a row on My Circle, the easiest way is to find a designer. Design vacancies set another record: in January, on average, one vacancy accounted for as much as 24.5 responses
- It was not very difficult in January to find a maker-up and an administrator. Each vacancy in these fields of activity accounted for an average of 8.5 responses.
- More difficult this month was to find a tester, analyst and manager. On average, each job in these specialties had 6.7 responses.
- Traditionally, the most difficult to find a developer of mobile applications: 5.2 vacancy response. Suddenly, this month it was also difficult to find a programmer: 5.4 responses per job, versus traditional 6-8 responses.
')
Next, we look at the overall trend in the average number of responses in the most popular areas of activity.
- Design vacancies firmly occupy the first place in demand among specialists: in January, another record with 24 vacancy responses.
- In January, the traditionally large number of responses to programmer vacancies unexpectedly fell: 5.4 responses instead of 6-8. Let's hope that this jump will not become a general trend.
- It is consistently the most difficult to find a developer of mobile applications: the number of responses here remains at the level of 5-6 per job.
Then look at the traditional top of the most popular IT-vacancies of the month: one vacancy from each activity. The popularity of a vacancy is measured by the number of responses to it. All these vacancies are open at the time of publication of the report, you can respond to them.
AdministrationLinux system administrator , 39 responsesSt. Petersburg. Part-time work. You can remotely. Furious 50 company. Web services development. | |
AnalyticsSystem analyst , 12 responsesFrom 80,000 rubles. Moscow. Full time work day. Cinimex company. We are engaged in improving business performance through information technology. | |
BackendPHP backend developer , 72 responsesFrom 140,000 to 320,000 rubles. Tallinn. Full time work day. You can remotely. Heaven 11 is a global musical repertoire database. | |
DesignInterface Designer , 90 ResponsesSt. Petersburg. Full time work day. You can remotely. Company "Artkrim." Development of own services. | |
MarketingInternet marketer / product specialist in shipping startup , 11 responsesMoscow. Full time work day. WE SHIP 2 YOU. | |
ManagementHead of IT projects , 37 responsesFrom 60,000 to 140,000 rubles. Moscow. Full time work day. You can remotely. Company SpaceShipsApps. Making the world more mobile. | |
ApplicationsIOS Developer , 31 ResponsesFrom 100,000 rubles. Full time work day. You can remotely. Chatlas is a mobile application for accessing professional translation services. | |
Software developmentDatabase Developer (junior) , 30 responsesMoscow. Full time work day. Avito company. Top 10 sites Runet and Top 5 best employers in Russia looking for talent. | |
TestingTester, technical writer , 50 responsesPart-time work. You can remotely. Company WorkPoint. SaaS application development. | |
FrontendHTML / CSS Developer , 66 ResponsesMoscow. Full time work day. You can remotely. CSSSR company. Ray of common sense. |
Source: https://habr.com/ru/post/298526/
All Articles