Planning sales of seasonal products with changing economic conditions
The development of a sales plan, and the provision of this plan, is a pressing issue in the current economic situation. An incorrectly compiled plan results in direct losses, both in the case of excess storage of goods in the warehouse, and indirectly in the event of shortage of goods in the warehouse, which leads to loss of profits, deterioration of service, and even excess payments of bonuses to sales managers.
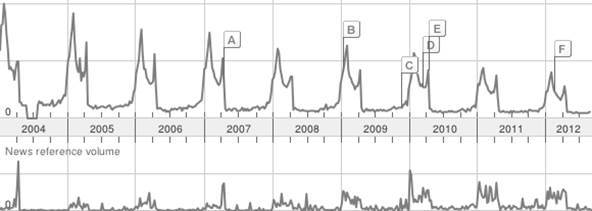
One of the problems that strongly influence the development of a plan is the seasonality of sales of certain products. Some products, such as running shoes, are more popular in summer than in winter. But the heaters are sold better in the cold season. These products are seasonal.
')
Disorder also introduces an unstable macroeconomic situation, when inflation pushes prices up, and declining consumer demand forces sales to decrease in quantitative terms. In addition to negative factors, positive factors can also influence - both for the company as a whole - if the company is actively growing and for specific product positions - if you invest a lot in product marketing, then the demand for them can grow faster than the growth of the company. All this makes a corrective element in the forecasts, because it is no longer so straightforward to focus on information about the history of sales, without taking into account the real situation.
Therefore, when drawing up a sales plan, consider the seasonal factor, and trends in the company.
How can I calculate my plan for seasonal fluctuations?
What is the seasonal factor - "seasonality"? This is a planned and regular deviation of sales of goods from average values. Seasonality is often calculated monthly for a calendar year relative to the previous calendar year for each product, on which the sales plan is built and for each outlet individually, and the final plan is compiled by consolidating from the values obtained.
For the calculation of the coefficients, I recommend counting in unit terms. If you count in monetary terms, the number of influencing factors increases many times and this, in addition to increasing the volume of calculations, also greatly increases the chance of error.
It is quite simple to calculate annual seasonality ratios - you need to take the average monthly sales at the end of the year (the sum of sales per year divided by the quantity), and then, for each month, calculate the deviation of actual sales from the annual average.
(Monthly Consumption / Annual Average Consumption = Seasonal Ratio)
If our sales schedule is like this:
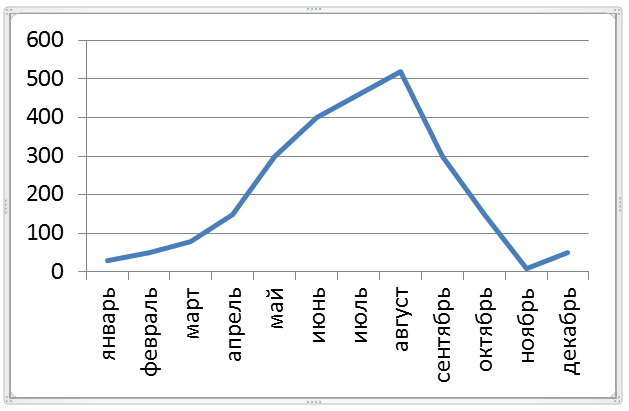
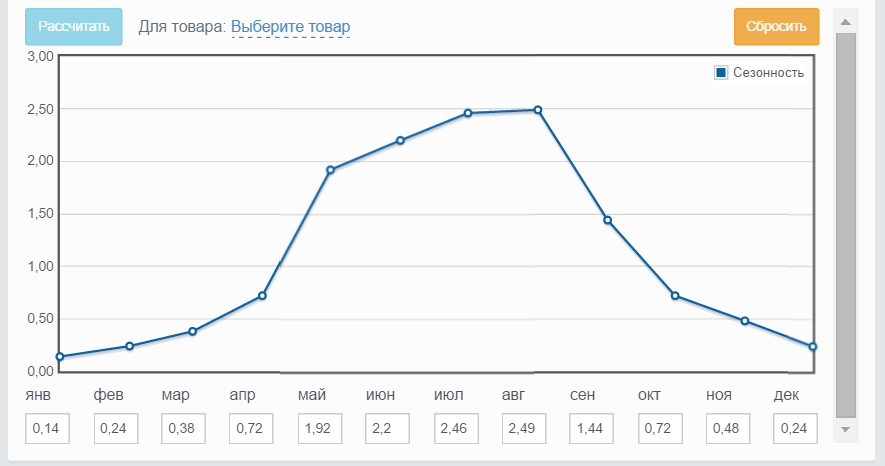
Then, according to the results of the calculation, you should get something like this for the calculation (for 2010):

Seasonal factors:
But the task is not to calculate the coefficients as such, but to calculate the sales plan, according to the current actual values of sales in the year. Suppose that we conduct an analysis at the end of April 2011 and expect a sales plan for May 2011:
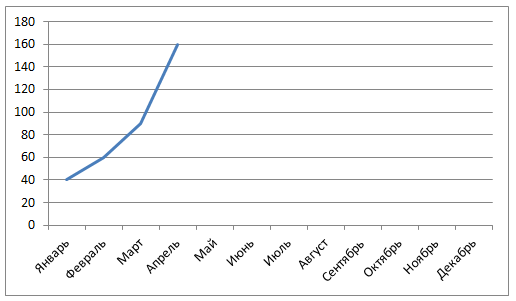
And our tablet will look like this:

The task is to understand how much we have to sell for May, taking into account current actual sales volumes and seasonality. To do this, we will bring each of the months of the current year to a single base, removing the seasonal coefficient from them, which we know.
(Fact Consumption per month / Seasonal coefficient = Ots Average annual consumption)
We get the following values:
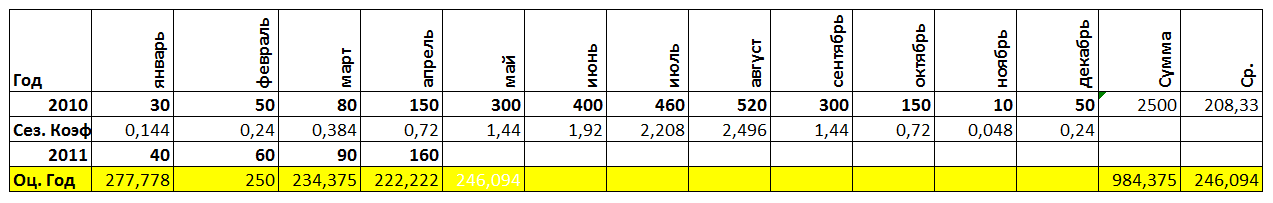
Which means that if seasonal factors are taken into account, then the expected average monthly for a year is 246 units / month.
From this, knowing the expected average for the year and the seasonal ratio in May (calculated at the previous step), we calculate how much sales are expected in the month of May, multiplying the expected average annual sales by the calculated seasonal ratio: 246 * 1.44 = 354.4 pieces.

Thus, we continue to formulate a sales plan for each month until the end of the year, adjusting according to actual sales data.
Unfortunately, these laconic calculations are not entirely correct ...

We took into account the effect of seasonal fluctuations, but did not calculate the effect of the general trend. If your demand drops (or grows) by 10% every month for objective reasons, without taking these movements into account, your newly drafted plan will become untenable, and, as we said above, it will lead to losses.
How to assess the impact of the trend?
Selecting and calculating a trend is in itself a difficult task. I recommend using the method developed by Robert Hodrick and Edward Prescott to analyze business cycles. The main “features” of the method: the method is more sensitive to long-term trends than to short-term ones (which we need), and it can be adjusted to the desired trend assessment period (which is useful when building a trend both within a year and for several years). To learn more about this method please follow the link: http://mycroftbs.ru/trend-filtr-hodrik-preskotta/
The result of calculating it looks something like this (orange line):

The problem is that this method is difficult to use in calculations in Excel. But you can try to use just linear functions, considering the average monthly sales at the state “at the beginning of the year” and “at the end of the year” (taking into account seasonality), and assessing how it has changed over time. Or simply taking as a target value, the one you would like to focus on (“I am sure that sales should grow by 10%”).
Be that as it may, the result of the calculations is the obtained monthly “slope” ratios of the trend for each of the goods for each of the outlets for each month where you calculate the sales plan. The problem is also that in a normal situation, within the year it is not a straight line, but gently bends.
The obtained coefficients are used to adjust the estimate of the average annual sale, which, let me remind you, we rely on the estimate of future sales.
If we assume that in current economic realities, the demand in piece terms will fall by 10% by the end of the year, then the monthly correction factor should be approximately equal to 0.987. This means that by this coefficient we will change the estimated average monthly within the current year according to the trend coefficient for each month:
(Actual Cons. Per month / Sez. Rate * Trend. Ratio = Oz Average annual consumption)
And the calculation of current values will look like this:

We noticed that the result was 349.8 pcs. instead of the previously calculated 354.4 units? It seems that this is not very much, but if you have billionth turnovers, then such an error is worth a lot.
In order to increase the quality of work with seasonality, recalculation of annual seasonal coefficients over the previous year is also required, relative to the identified trends. But with the reluctance to produce a large amount of computation, even such a small refinement for the current year is already capable of a qualitative improvement in planning.
It is important that these calculations were carried out and corrected regularly, according to actual data, in order to get the most adequate sales plan and understand how you will provide and control it.
In real work, professionals usually use more sophisticated approaches. The calculation is carried out not by months, but by week, or even by day. Target values are affected by more factors. And the forecast model goes beyond the usual average calculations. But the above approach is something that anyone who is engaged in planning can apply, even without special tools.
If this is too time consuming to do in "manual mode", and if you have 10 outlets and 15,000 products, then welcome to us. Our solution will do everything for you. Mycroft Assistant in real-time automatically collects sales data, analyzes the current state of sales, independently calculates the optimal work model and influence factors. And on the basis of the data obtained, it forms a sales forecast for each of the goods at each of the outlets. And on the basis of these forecasts, issues recommendations on the need for replenishment of stocks, so that you rationally provide this sales plan. So, if you want to optimize the work of the company, but do not know how best to do it - welcome to us.
We also invite you to the Effective Inventory Management webinar, which is conducted by our partner Corus-Consulting. Registration is available at: http://korusconsulting.ru/press-center/events/demonstracia-upravlenie-zapasami-03-02-2016.html.
Source: https://habr.com/ru/post/298236/
All Articles