Why do I need to know LTV

LTV, also known as Lifetime Value, or Customer Lifetime Value (CLV), is an indicator of customer lifetime value. It shows how much money one user will bring on average for all the time the product is used. The LTV indicator is universal, it is calculated both in web analytics and in mobile. It is considered for most types of products, be it Starbucks coffee shops, mobile operators, banks, SaaS products, or games. In this article we will talk about why you need to know LTV and how to use it.
We must immediately make the reservation that Lifetime Value, calculated across the entire user base, is such a spherical horse in a vacuum. It can be used, but a more accurate result is given by the indicator calculated by individual cuts. For what exactly - read below.
')
LTV> CPI
This is the main formula of the entire traffic analysis and the main condition for attracting efficiency. The user must make more money than was spent on his attraction.
Under CPI (Cost Per Install) in this case we mean the average cost of attracting one user through all channels at once . If you are accustomed to the abbreviation CPA (Cost Per Acquisition), traditional for web products, use it in the further formulas in this article.
Actually, the average CPI, the average CPA are rather conditional indicators, as a rule, we pay one partner the sum A, the other the sum B, the third the sum C, and the total average CPI is most likely a value that is not neither A, nor B, nor C. LTV is better to be considered separately by attraction channels, by campaigns , and therefore we come to the following application of this indicator.
Evaluation of the quality of the traffic source
Each source has its own user acquisition price (CPI or CPA) and its quality of traffic, and therefore its LTV. Therefore, it will be more efficient to calculate the LTV for each channel separately.
At the same time, you can get the total average LTV more than the total average CPI, but in the context of attraction channels you will see inefficient channels where this condition is not met. What to do in this situation? You can, of course, immediately turn off the source of traffic that has fallen into disfavor. However, it will be more efficient to examine it in detail, “cut” it across campaigns, countries and platforms, and disable those of them where LTV is less than CPI. Better yet, enter such an analysis into regular practice and disable the ineffective SubIDs that appear to the traffic provider.
ROI calculation
Analysts operate with metrics, and owners and investors give money. And it is important for these serious people to know whether their investments will pay off. For this, a metric of ROI (Return On Investment) was invented, which takes into account both LTV and the cost of attraction.
ROI can be considered differently, we are now talking about the formula ROI = LTV / CPI * 100% . According to the results of calculations, ROI should be more than 100%.
I also recommend to calculate ROI for certain fixed time intervals from the moment of registration (first entry) of the user: ROI N days = Cumulative ARPU N days / CPI * 100% .
Here we are introducing the new Cumulative ARPU metric N days, which shows how much money an average user brought for the first N days of product use. By selecting different N, you better understand the dynamics of ROI and can calculate another important indicator. Namely…
Payback period
When will the money invested in the project pay off? See the chart:
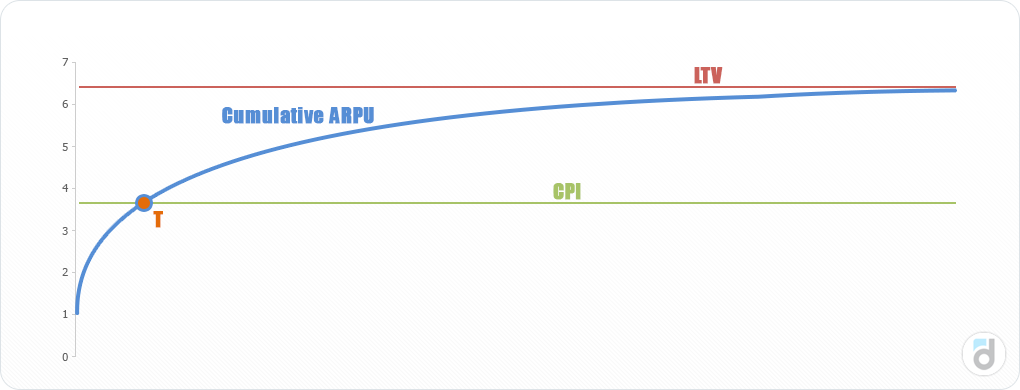
The blue line is a measure of Cumulative ARPU, it shows how much money one user brings on average per N days of product use. The LTV indicator is the limit of Cumulative ARPU with N tending to infinity (although in practice taking fixed N values like 120, 180, 360 days).
If the business works well and the traffic pays off, then there is a point T at which the blue line (money brought by the user) becomes higher than the green line (money spent on the user). And the day on which this important event took place is called the payback period . Now you can tell the owner exactly when the money is repaid and when ROI exceeds 100%.
Cost planning
Let's return to the basic formula: LTV> CPI .
When calculating, it is important to know about the concept of net LTV, that is, LTV minus other expenses : shop commission, publisher commission and royalties, taxes eventually.
CPI is not all that simple either. To start purchasing traffic, you must first agree (manager’s salary), sign an agreement (lawyer’s salary), integrate (programmer’s salary), and this we still do not take into account the fixed signing fee from some counterparties. Therefore, we will move from CPI to the effective price of attracting eCPI (by analogy with the effective bank rate).
As a rule, in the project there are also costs for maintaining user activity - technical support, community management, servers and others. The final formula takes the following form: Net LTV> eCPI + costs per user (variable, fixed) .
From this it follows that the costs must be planned so that the condition is fulfilled after the deduction of all commissions from the LTV and the addition of all costs to the CPI.
Project Dynamics
LTV is based on the value of many metrics. It is influenced by both the retention of users (retention), and the share of paying (Paying Share), and income from the paying (ARPPU). Instead of tracking the dynamics of several metrics, you can track the dynamics of LTV — this will show you how effective the changes you make to the project.
If LTV is growing from month to month - fine, keep up the good work. If it falls (and in most projects, LTV has a downward trend along the time axis), then it’s time to take measures and improve the project.
Predicting future earnings
If you know how to predict LTV, and even count it in the context of channels, countries, platforms, etc., then you can easily predict how much money you will receive in N months. For example, you can answer such questions:
- what will happen to the revenue in 3 months if we now reduce the paid traffic by 50%;
- if we enter the new country’s market in April, how much money we will get from it by the end of the year;
- if we make a change to the project that will increase the retention of users by 3%, how will this affect our revenue;
- when the traffic we bought from partner X will pay off;
- and so on.
As you can see, LTV is the most important indicator in project analytics. But there is one difficulty - it takes time to calculate it, and, as a rule, there is no time. If you consider LTV in a short time, the forecast will not be the most accurate. If you make a calculation for a long period, then the question of forecasting ceases to be relevant, the future overtakes us.
How to count LTV?
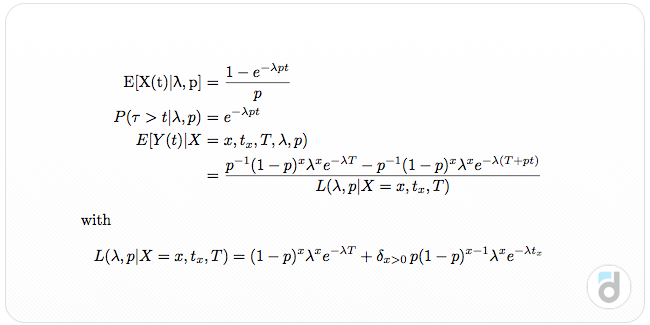
This is a question that cannot be answered in one sentence. For example, here is a screenshot of the LTV calculation from the book “Database Marketing: analyzing and managing customers” (a good and powerful book on analytics and marketing, if you like hardcore):
There are many ways to calculate LTV, and among them are those that allow you to get an accurate forecast in a few days. So that you can study this indicator in practice, we invite you to a free webinar , which will be held on February 1 at 18:00 Moscow time. I will talk about the different methods of calculating LTV, as well as analyze several practical questions on the prediction and use of this metric. Sign up !
PS And, yes, there won't be such a hardcore on the webinar as in the last screenshot :)
Source: https://habr.com/ru/post/298158/
All Articles