How did we make analytics better
Analytics should help the developer to quickly make decisions, and not complicate his life with new questions. Therefore, the whole of 2015 we in devtodev worked to make our platform comfortable and understandable for everyone, and today I will tell you what we managed to do and where we are going.

To an untrained person, the analyst seems difficult. This is partly true, but everything can be learned. To do this, we launched our own educational center . Every week a new article about metrics, methods, live hacks and real-life cases appears in it, and once every three weeks I (lead analyst) conduct an open webinar. In 2015, we conducted 26 webinars for almost 3,500 people , and all videos and presentations were made publicly available. Use!
If you do not want to immerse yourself in analytics, and you feel a slight panic from the charts and reports, we take on these tasks. In November 2015 , analytics consulting services appeared among devtodev functions. It is available in two modes: as full support or as a one-time consultation. Now you can connect our experts to the permanent work on your project or simply ask for advice in a difficult situation. Details on this page .
')
In 2015, we integrated with Adjust, and now we analyze traffic from all the big three installers : Adjust, MobileAppTracker (aka Tune) and AppsFlyer. We learn from trackers where the user came from, and create a detailed analysis of his behavior in the project. This allows the application owner to assess the quality of traffic sources, optimize costs and, as a result, increase the project's ROI. About how and why to analyze the traffic, I told in the webinar .
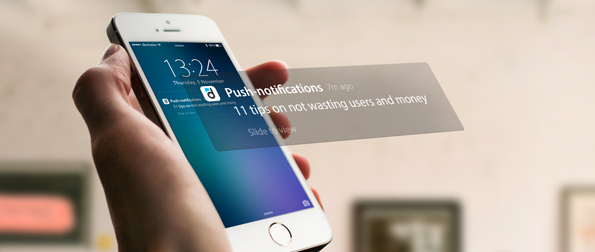
For a long happy life of the application, traffic alone is not enough - you need to communicate with users , returning them to the project. Now through the devtodev system, you can create push notifications for a project and analyze how they affect the audience. The secret of success is to send friendly and relevant messages - we even recorded a separate webinar on this topic .
The subject of our special pride this year is new reports on the analysis of paying users . They show the frequency and size of payments in the app, as well as demonstrate how the structure of the paying audience and the incoming money changes over time. Want to know more? Watch a detailed report webinar .

And for those who create applications for several platforms at once, we added the possibility of cross-platform analytics . It allows you to study the behavior of users who use several platforms simultaneously, compare the effectiveness of platforms, calculate metrics for each of them separately and for the project as a whole. How to do it - see here .
It is customary to give promises before the New Year, so here are our plans for 2016 :
Thank you for being with us in 2015, and see you next year!
To an untrained person, the analyst seems difficult. This is partly true, but everything can be learned. To do this, we launched our own educational center . Every week a new article about metrics, methods, live hacks and real-life cases appears in it, and once every three weeks I (lead analyst) conduct an open webinar. In 2015, we conducted 26 webinars for almost 3,500 people , and all videos and presentations were made publicly available. Use!
If you do not want to immerse yourself in analytics, and you feel a slight panic from the charts and reports, we take on these tasks. In November 2015 , analytics consulting services appeared among devtodev functions. It is available in two modes: as full support or as a one-time consultation. Now you can connect our experts to the permanent work on your project or simply ask for advice in a difficult situation. Details on this page .
')
In 2015, we integrated with Adjust, and now we analyze traffic from all the big three installers : Adjust, MobileAppTracker (aka Tune) and AppsFlyer. We learn from trackers where the user came from, and create a detailed analysis of his behavior in the project. This allows the application owner to assess the quality of traffic sources, optimize costs and, as a result, increase the project's ROI. About how and why to analyze the traffic, I told in the webinar .
For a long happy life of the application, traffic alone is not enough - you need to communicate with users , returning them to the project. Now through the devtodev system, you can create push notifications for a project and analyze how they affect the audience. The secret of success is to send friendly and relevant messages - we even recorded a separate webinar on this topic .
The subject of our special pride this year is new reports on the analysis of paying users . They show the frequency and size of payments in the app, as well as demonstrate how the structure of the paying audience and the incoming money changes over time. Want to know more? Watch a detailed report webinar .
And for those who create applications for several platforms at once, we added the possibility of cross-platform analytics . It allows you to study the behavior of users who use several platforms simultaneously, compare the effectiveness of platforms, calculate metrics for each of them separately and for the project as a whole. How to do it - see here .
It is customary to give promises before the New Year, so here are our plans for 2016 :
- Learn how to predict user behavior in an application based on all the data we process;
- Add LTV forecast function so that application owners can see how much money a new user will bring to them;
- Embed functionality for A / B tests;
- Learn to analyze applications in comparison with other projects of the same genre on the market;
- Create a built-in recommendation system that will tell you how to improve application metrics.
Thank you for being with us in 2015, and see you next year!
Source: https://habr.com/ru/post/297622/
All Articles