We evaluate the effectiveness of advertising sites on the Internet. Easy!
Anyone who has ever launched media or contextual advertising campaigns has been confronted with questions: which sites to choose and how to evaluate their effectiveness in order to reorganize after the test campaign?
As a rule, before the start of the campaign, the advertiser collects a ton of site data, and after the end of the campaign he has another ton of statistics. And here the most interesting begins - what to do with it?
Of course, you can estimate by eye which area is better, but how can you really calculate how much better it is? 2 times or 3.5?
')
In fact, this can be easily assessed by making a rating of sites using an applied method based on a simple mathematical model.
So, initially for a proper assessment of the effectiveness of an advertising campaign, its goals are determined. They may sound different:
Of course, the whole set of goals can be reduced to two - “Sales” and “Recognizability”, but for choosing sites, the goal is to formulate more precisely - this will help you choose the data necessary for analysis. Of course, for different purposes of an advertising campaign, the weight (value) of site selection criteria will be different.
Only those indicators that can be measured can be the selection criteria for the ranking. Moreover, for the initial selection of sites, the list of such criteria is shorter, and the data for them is provided by the advertising sites themselves. Typically, this is:
The last two indicators should be treated with caution: first, they are forward-looking, and secondly, they largely depend on the quality of your ad.
After conducting a test advertising campaign, we will have much more criteria for the effectiveness of sites for their subsequent reorganization:
We now turn directly to the method:
At the first stage, all data (number of impressions in units, cost in rubles, CTR as a percentage, etc.) must be reduced to some single value that can be subsequently added.
Folding rubles, interest and thousands of impressions is likely to be a bad idea. :)
It is necessary to bring them to a single value through the normalization of each parameter at each site.
We will normalize either to the maximum or to the minimum, depending on the parameter. If the parameter “the more, the better” (for example, this is the number of ad impressions), then we will normalize to the maximum. In the opposite case (most often these are cost indicators: the lower the cost per click, the better in 99% of cases) we will carry out normalization to a minimum.
Normalization to the maximum , for example, for the number of hits.
Initially we have the following data:

In this parameter, the best place showed itself №3. We take it for the basis of normalization.
Further, all the data is divided by the base: the estimate for the site number 1 - 10 000/12 500 = 0.8, area number 2 - 5 000/12 500 = 0.4, area number 3 - 12 500/12 500 = 1. In A cell with a normalization base always produces 1.
Thus, we have a formula for normalizing to the maximum: IndNorm = Indus / MaxInd , where
As a result, we get the following table:

Normalization at a minimum is identical.

According to the cost of the click the most profitable was the Site №2. Take it for a foundation.
It is important to note that when normalizing to a minimum, we divide the basis on the indicator values for each site using the formula IndNorm = Minind / Indus , where MinInd is the minimum value of the criterion for all sites.
Score for the site number 1 - 7/10 = 0.7, area number 2 - 7/7 = 1, area number 3 - 7/8 = 0.875. In a cage with a base - again 1.
Summary data:

Weight is determined based on the goals of the advertising campaign. The more important the parameter, the more weight. The sum of the scales must be equal to 1.
For example, we have the cost per click, the number of conversions, the number of impressions and conversions.
The goal of the campaign: increase conversion and minimize its cost. In this case, the most weight is assigned to the number of conversions, for example, 0.4. The rest is distributed by other parameters, for example: the cost per click is 0.3, the number of transitions is 0.2, the number of impressions is 0.1. In total - 1.
If the goal of the campaign is to increase traffic to the site, then the number of transitions will be at the forefront, if recognition and branding - the number of hits, etc.
We multiply the normalized estimates for each criterion by the weight of this criterion and summarize the estimates for all criteria / indicators. If the weight of the “Number of impressions per period” criterion was 0.2, and the “Cost per click” criterion was 0.8, then we end up with the following rating:
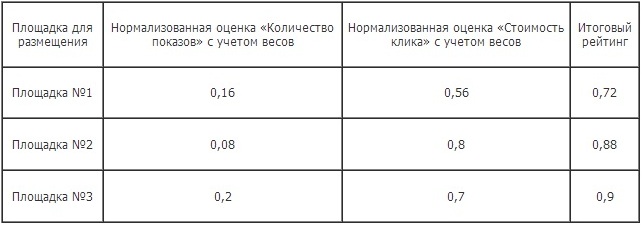
For convenience, you can multiply the rating values by 100 (or 1000) to get “beautiful” rating values:

According to the results of the rating calculation, we can clearly see that Site No. 3 was the best, Site No. 2 was quite a bit worse (only 2 points), and Site No. 1 was 20% worse.
In the example, we compared sites in two parameters, in practice we recommend taking at least four parameters.
Suppose we are faced with the task of increasing the number of calls to the offline store. We conducted a test advertising campaign and now have to compare advertising platforms and, excluding ineffective ones, continue the campaign to effective ones.
We collected the following data:

1. From the available data, select the criteria that are most relevant to the goals of our advertising campaign:

2. Normalize the data:
3. Based on the goal of the advertising campaign, we place the weights of the existing criteria:

4. We impose criteria weights on the normalized data and get the following:

5. We summarize the estimates by the criteria for each site, multiply by 100 and get the final site rating:

Thus, to solve the task set before the advertising campaign (to attract customers to the offline store), the VKontakte site is best suited with a significant margin, in second place is a banner on the women's portal, and in the third place - Odnoklassniki. And it is on the VKontakte advertising that the advertising budget should be sent first.
Of course, even a priority site can exhaust its resource by impressions / clicks. Therefore, the rest of the budget should be distributed in accordance with other tasks to reach the target audience, taking into account its socio-demographic factors, solvency and others. You can simply add the necessary (depending on the goals of the campaign) criteria for evaluation and create a new rating for secondary tasks to determine the “second wave” sites.
As a rule, before the start of the campaign, the advertiser collects a ton of site data, and after the end of the campaign he has another ton of statistics. And here the most interesting begins - what to do with it?
Of course, you can estimate by eye which area is better, but how can you really calculate how much better it is? 2 times or 3.5?
')
In fact, this can be easily assessed by making a rating of sites using an applied method based on a simple mathematical model.
So, initially for a proper assessment of the effectiveness of an advertising campaign, its goals are determined. They may sound different:
- Familiarize potential buyers with a new stock / product.
- Increase company awareness on the Internet.
- Boost sales.
- Increase traffic to the site as a whole.
- And so on and so forth ...
Of course, the whole set of goals can be reduced to two - “Sales” and “Recognizability”, but for choosing sites, the goal is to formulate more precisely - this will help you choose the data necessary for analysis. Of course, for different purposes of an advertising campaign, the weight (value) of site selection criteria will be different.
Only those indicators that can be measured can be the selection criteria for the ranking. Moreover, for the initial selection of sites, the list of such criteria is shorter, and the data for them is provided by the advertising sites themselves. Typically, this is:
- Number of hits
- The cost of the show or the cost of a click.
- CTR.
- The number of clicks.
The last two indicators should be treated with caution: first, they are forward-looking, and secondly, they largely depend on the quality of your ad.
After conducting a test advertising campaign, we will have much more criteria for the effectiveness of sites for their subsequent reorganization:
- The actual number of ad impressions.
- The number of transitions from the announcement.
- The total cost of an advertising campaign.
- The number of actions we want (views of landing pages, purchases, number of visitors with the time we spent on the site we need) is the number of conversions.
- CTR specific ad banner.
- The percentage of conversions (note that there may be several goals, respectively, and several conversions, too).
We now turn directly to the method:
Stage 1. Normalization of parameters.
At the first stage, all data (number of impressions in units, cost in rubles, CTR as a percentage, etc.) must be reduced to some single value that can be subsequently added.
Folding rubles, interest and thousands of impressions is likely to be a bad idea. :)
It is necessary to bring them to a single value through the normalization of each parameter at each site.
We will normalize either to the maximum or to the minimum, depending on the parameter. If the parameter “the more, the better” (for example, this is the number of ad impressions), then we will normalize to the maximum. In the opposite case (most often these are cost indicators: the lower the cost per click, the better in 99% of cases) we will carry out normalization to a minimum.
Normalization to the maximum , for example, for the number of hits.
Initially we have the following data:
In this parameter, the best place showed itself №3. We take it for the basis of normalization.
Further, all the data is divided by the base: the estimate for the site number 1 - 10 000/12 500 = 0.8, area number 2 - 5 000/12 500 = 0.4, area number 3 - 12 500/12 500 = 1. In A cell with a normalization base always produces 1.
Thus, we have a formula for normalizing to the maximum: IndNorm = Indus / MaxInd , where
- IndNorm - the normalized value of the criterion
- Indus - the initial value of the criterion
- MaxInd - the maximum value of the criterion for all sites
As a result, we get the following table:
Normalization at a minimum is identical.
According to the cost of the click the most profitable was the Site №2. Take it for a foundation.
It is important to note that when normalizing to a minimum, we divide the basis on the indicator values for each site using the formula IndNorm = Minind / Indus , where MinInd is the minimum value of the criterion for all sites.
Score for the site number 1 - 7/10 = 0.7, area number 2 - 7/7 = 1, area number 3 - 7/8 = 0.875. In a cage with a base - again 1.
Summary data:
Stage 2 The choice of weight parameter.
Weight is determined based on the goals of the advertising campaign. The more important the parameter, the more weight. The sum of the scales must be equal to 1.
For example, we have the cost per click, the number of conversions, the number of impressions and conversions.
The goal of the campaign: increase conversion and minimize its cost. In this case, the most weight is assigned to the number of conversions, for example, 0.4. The rest is distributed by other parameters, for example: the cost per click is 0.3, the number of transitions is 0.2, the number of impressions is 0.1. In total - 1.
If the goal of the campaign is to increase traffic to the site, then the number of transitions will be at the forefront, if recognition and branding - the number of hits, etc.
Stage 3 Summarizing.
We multiply the normalized estimates for each criterion by the weight of this criterion and summarize the estimates for all criteria / indicators. If the weight of the “Number of impressions per period” criterion was 0.2, and the “Cost per click” criterion was 0.8, then we end up with the following rating:
For convenience, you can multiply the rating values by 100 (or 1000) to get “beautiful” rating values:
According to the results of the rating calculation, we can clearly see that Site No. 3 was the best, Site No. 2 was quite a bit worse (only 2 points), and Site No. 1 was 20% worse.
In the example, we compared sites in two parameters, in practice we recommend taking at least four parameters.
How does it look in practice?
Suppose we are faced with the task of increasing the number of calls to the offline store. We conducted a test advertising campaign and now have to compare advertising platforms and, excluding ineffective ones, continue the campaign to effective ones.
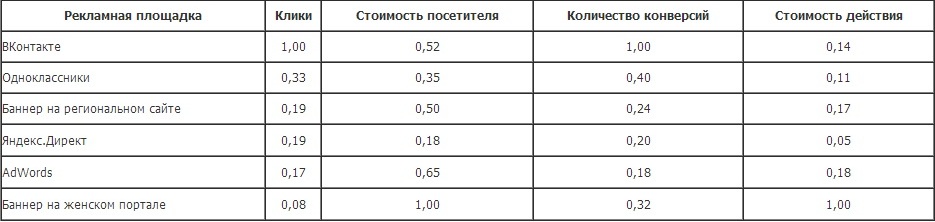
We collected the following data:
1. From the available data, select the criteria that are most relevant to the goals of our advertising campaign:
- Clicks - transitions on advertisements. The simplest criterion: the more clicks from this site, the more attractive it is to us. Data is provided by advertising platforms.
- The cost of one visitor . Advertising campaign budget is always an important criterion.
- The number of visitor actions (conversions) we need . We summarized all the visits with the necessary actions - from viewing the coupon page to viewing 3 or more pages from the catalog.
- The cost of one action . The criterion for the cost of a quality audience.
2. Normalize the data:
3. Based on the goal of the advertising campaign, we place the weights of the existing criteria:
4. We impose criteria weights on the normalized data and get the following:
5. We summarize the estimates by the criteria for each site, multiply by 100 and get the final site rating:
Thus, to solve the task set before the advertising campaign (to attract customers to the offline store), the VKontakte site is best suited with a significant margin, in second place is a banner on the women's portal, and in the third place - Odnoklassniki. And it is on the VKontakte advertising that the advertising budget should be sent first.
Of course, even a priority site can exhaust its resource by impressions / clicks. Therefore, the rest of the budget should be distributed in accordance with other tasks to reach the target audience, taking into account its socio-demographic factors, solvency and others. You can simply add the necessary (depending on the goals of the campaign) criteria for evaluation and create a new rating for secondary tasks to determine the “second wave” sites.
Source: https://habr.com/ru/post/296990/
All Articles