8 traffic analysis tips
Often, especially in small companies, it happens like this: we got a budget for attraction, bought users, saw an influx of registrations, were delighted and moved on to other tasks. And these users suddenly did not bring money, and it turns out that the marketing budget was wasted.
The reasons for the failure can be both in problems with the monetization of the product, and in the low quality of traffic. Indeed, according to various estimates, the share of fake traffic in the overall structure of paid registrations today ranges from 20% to 60%. To avoid such situations, it is necessary to analyze traffic from the youth. And we will tell you how to do it.
Use relative metrics
Metrics such as Installs Cost, Total Installs, Users Revenue are certainly important for understanding the scale of the campaign. However, they do not say anything about the quality of traffic. To assess how good traffic you have received, you need to operate with relative metrics per user (they describe the quality of traffic and allow you to compare several attraction channels):
- ARPU (Average Revenue Per User);
- CPI (Cost Per Install);
- share of paying users (Paying Share);
- percentage retention (Retention);
- return on investment (ROI).
Use cohort analysis
Record for each traffic source the dates of registration or the first visit of users, and then study the retention metrics and monetization metrics after a day, two days, a week, two weeks, a month from the date of registration.
For example, take source A, fix the weekly user registration interval, and calculate the metrics for each cohort:
- cumulative 1-day ARPU (how much one user brought on average per day of life in a project);
- cumulative 2-days ARPU;
- cumulative 7-days ARPU;
- ...
- cumulative 28-days ARPU;
- and so on.
Similarly, take a cumulative income and divide it by the cost of attracting one user to get the X-days ROI metric. Track this indicator and you will notice a payback time for traffic - your ROI will exceed 100%. When comparing multiple traffic sources, ROI is the most important indicator.
In addition, we recommend reading the following retention rates for each cohort:
- 1-day retention;
- 7-days retention;
- 28-days retention
- and so on.
These indicators are needed in order to compare sources brought to a single point - after all, it is wrong to compare the effectiveness of sources if they have worked at different times.
')
Set target events
Metrics like retention are easy to fake. If the client is focused on, say, 1-day retention, you can simply go to the application the next day or write the appropriate bot. Therefore, add other events whose execution will show you that the user is truly motivated.

screenshot taken from devtodev system
Such events can be the passage of a specific (not first) level, the entrance to the store, clicking on some not very obvious menu item, etc. Consider these events for each traffic source along with the metrics described above, and it is possible that you will find a channel through which retention is high, but target actions are not performed. If this is a common situation, then this channel should be abandoned.
Slice the data (slice & dice)
It is not excluded that bots work from under one IP, or they are registered in one hour, or come from one site. If you analyze the data in all these cuts, and better in combinations, then chances to notice strange deviations will be higher.
Not only in bots business - if you see that traffic from a particular country or from a specific site does not pay off, you have the right to ask a partner to disable such a sub-source.
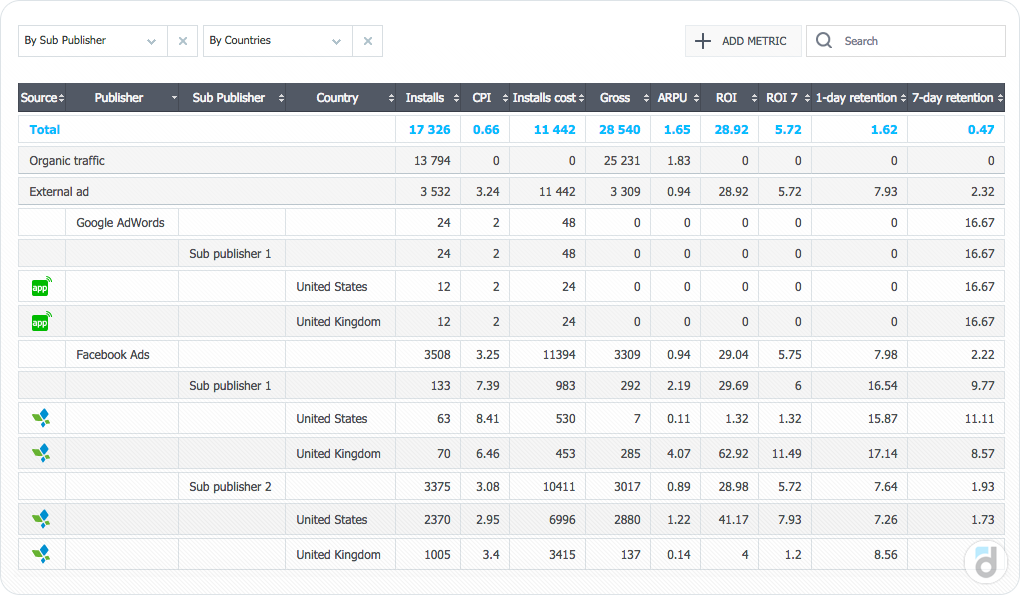
screenshot taken from devtodev system
Develop a traffic estimation procedure.
In general, traffic analysis is not a one-time task. It must be performed continuously, evaluating incoming traffic and optimizing the analysis algorithms. Set up a daily, weekly traffic estimation procedure. Let your specialist start the day not only with coffee, but also with an analysis of the quality of traffic for the last N days.
If you have collected a set of metrics for analysis, set target events and cut traffic according to several parameters, this is enough to occupy the traffic manager in the morning for half an hour. You can hang a monitoring system on each metric (using the statistical mechanisms: confidence intervals, the three-sigma rule) - this will increase the chance of finding anomalous deviations in traffic.
Work with trusted partners
But do not be afraid to experiment.
In general, attracting traffic is a task that can be compared with the formation of an investment portfolio. Both there and there are highly profitable sources and, let's say, conservative tools. Start building your traffic portfolio with trusted partners (Google, Facebook, or those with whom you already have a relationship). The moment will come when someone offers you a low CPI. If you already have a stable and predictable source of traffic, you can take a chance - what if a new partner really turns out to be better. You minimize the risk by diversifying sources.
If you regularly evaluate the quality of traffic, turn off poorly functioning sub-sources, leave stable and proven channels, add new experimental partners in batches, you will learn step by step how many users will come to you next month and how much you will have to pay for it.
Set limits
However, it will be useful to set limits for each partner. First, you get the top bar of your budget to attract. Secondly, avoid a situation where an unverified partner suddenly gives an unexpectedly large bill. Of course, these limits may vary for different partners. Install them in proportion to your level of confidence in the source of traffic.
Subtract whales from analysis
Whales are users who bring in very large sums of money. And it is possible that the entire cash desk is created by a single user to one traffic source, and the rest are converted very poorly. Better make sure that it is not.
And now let's solve the puzzle.
There are three partners: A, B, C. Each partner, we paid $ 100 for the attraction. Partner A's traffic brought $ 15; Partner B's traffic brought $ 20; Partner C's traffic brought $ 25. Which partner is better?
I would like to say that C. But the correct answer here is: “I don't know.” Before making a decision, you need to clarify a few points:
- How many users came from each source? Focusing on absolute metrics, we can not compare the quality of channels. We need relative metrics, and for this we need to know the number of users.
- What is the CPI for each source? Without knowing the cost of attraction, we will not be able to calculate ROI, namely ROI is a key indicator when comparing sources.
- How much time has passed since the registration of users for each source? Maybe the campaign with partner C started a month ago, and with others only a week has passed?
- Even if all partners had the same number of days since the beginning of the campaign, is this period enough to talk about differences? Let's say it took only 2-3 days, and partners A and B can still catch up and overtake partner C.
- Are there whales in the analyzed traffic? Suddenly, this one person paid $ 25, and all the other N-1 people did not bring a penny?
I hope this material will be useful to you, because, after all, everyone buys traffic, and it is very nice to learn how to do it without overpaying.
PS I also want to invite you to a free webinar , where we will give some more tips on how not to overpay for traffic. The webinar will take place on December 7 at 18:00 Moscow time. Sign up !
Source: https://habr.com/ru/post/296906/
All Articles