How to analyze paying users. Part 1 - RFM Analysis

With this article we open a whole cycle of articles on the analysis of paying users.
So, paying users, those guys who bring money to your product. It is very important to know all the nuances of their behavior: what they pay for, how fast, in what volume. It is important to know that they feel at the same time whether they are satisfied with the investment in your product. In fact, even in the case of f2p online game, every player's payment is his investment: he pays money at the entrance, gets some ROI at the exit, expressed in virtual or real (games with currency withdrawal, or just the black market) currency and in the emotions that he experiences. Therefore, consider paying users as investors, albeit minorities.
In order to better understand the behavior, distribution and needs of paying users, there are different analytical methods and reports. And today we will talk about RFM-analysis as one of the main methods for understanding the structure of your paying audience.
RFM stands for:
')
R - Recency - the duration of the last purchase.
F - Frequency - the frequency of purchases;
M - Monetary - the volume of purchases for all time.
For each paying user, you give three estimates corresponding to these parameters. As a rule, in theoretical materials the user is rated on a three-point system (relatively speaking, good, normal, or bad), but in practice we have met five- and even ten-points in the RFM-analysis. Consider the example of a three-point system to simplify perception:
R = 1 - the user last paid a long time ago;
R = 2 - the last user payment occurred relatively recently;
R = 3 - the user paid quite recently;
F = 1 - the user pays very rarely (or made only one payment at all);
F = 2 - the user pays with average regularity;
F = 3 - the user pays often;
M = 1 - the sum of all user payments is small;
M = 2 - the user in the amount paid the average amount of money for the project;
M = 3 - the user paid a lot of money.
Of course, the question arises, what is in this case a long time ago / recently, often / infrequently and a lot / a little. There are two ways to answer this question:
1) Expert evaluation. No one knows your project better than you. Therefore, set for yourself what is long and recently, what is a lot and a little. For example, a long time ago - this is a month or more ago, rarely - this is once a month or less, and a little - this is not more than 100 rubles in the entire history of payments.
2) Quantiles and quartiles. Remember the mathematical statistics. Sort your users by one of the parameters (for example, by the amount of payments for all the time), take, for example, the top 5% of all users and say that these users have paid a lot. Congratulations, you have just received a five percent quantile of sampling from your users. Or you can take quartiles (quartile = quantile level 25%), and evaluate the first quartile as a lot, the last one as a little, and what is between them as the average payment amount. Be that as it may, even with the use of quantiles and quartiles, you cannot do without a subjective assessment, and therefore again see clause 1.
In any case, having worked a bit in Excel (or elsewhere), you will give three estimates to each paying user: for prescription, for frequency, and for the amount of payments.
And now the fun begins.
You can see how these ratings are distributed by your paying users, which users are the most. This will allow you to segment your paying audience and plan marketing actions to increase revenue.
A simple example:
- We bought recently, but rarely (or one payment) - new paying users. What to do with them? Thank! Your task is to stimulate them for repeated purchases. Studies show that it is repeat purchases, their regularity and size, increase the chances of the application to earn a million dollars.
- Bought recently, bought often - loyal users. They do not need additional stimulation, but it makes sense to find a way to thank them for their loyalty (an unexpected bonus, a surprise, just “Thank you,” it all works).
- We bought often, but for a long time - loyal users on the verge of leaving. That is, the money that is leaking through your fingers right now. Your task is to remind them of yourself. Perhaps a simple push notification is enough. It may be worth going to them with a survey - what has changed, why are they leaving?
- We bought rarely and for a long time - the outflow of users. They did not become loyal, something prevented them then, in the past. You can offer them (and only them) a share, even a little profitable for you, that would encourage them to re-purchase and return to the product. Otherwise, you can at least try to find out what they did not like and adjust the product based on their feedback.
Suppose there is the following case.
1) Project X wants to increase its revenue.
2) RFM analysis was performed, which showed that:
3) The outflow of loyal paying users is very high;
4) Many users make only one purchase.
5) Triggers are introduced into the product, which allow you to recognize the moment when the user’s status in the 'one purchase' status was delayed, or when the user who was previously loyal, stops paying. At these moments, users are given an “offer that cannot be refused” (a special offer, a big discount, the information comes from a push notification or a pop-up window at the entrance).
6) The percentage of repeat purchases increases, the retention of loyal users increases.
7) Profit.
Both examples discussed above operate on only two dimensions: Recency, Frequency.
Adding the same measurement of Monetary in this report will allow guided by the volume of payments from each client.
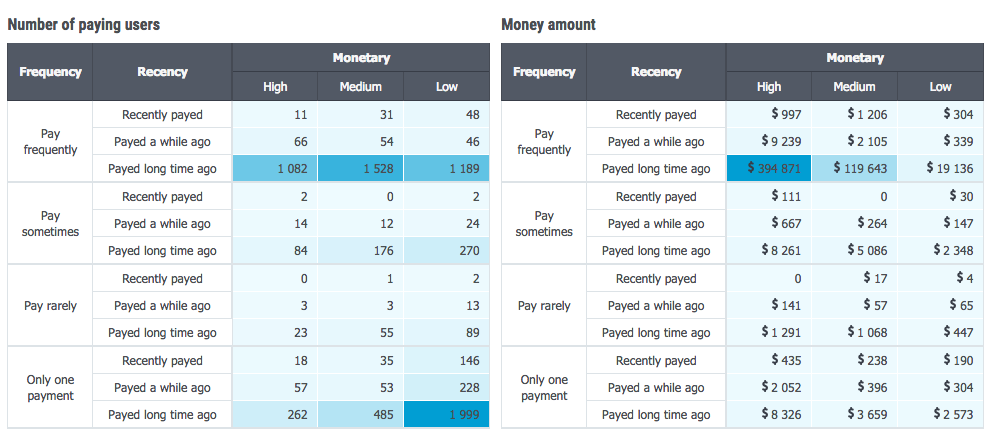
At the same time, the analysis can be performed both by the number of users and by the amounts of money received from them.

In addition, you can separately consider and combinations of Monetary-Recency (how many users pay and how long they paid), Monetary-Frequency (how many and how often users pay).
The easiest way to analyze paying users in a single dimension is to get the distribution of users and their payments by time (just recently — long ago), by frequency (often — sometimes — rarely), by size (many — moderately — small).
In particular, in f2p games, the analysis of paying users according to the size of their payments is usually described with the help of the inhabitants of the deep sea:
- Whales (Whales) - users who bring large sums;
- Dolphins (Dolphins) - users, bringing the average amount;
- Minnows are users who bring small amounts.
We are not talking about the amounts from one payment, but about the total amounts accumulated over the entire history of user payments. And the allocation to large, medium and small amounts is again made expertly.
Analyzing the number of users in each segment and the amount of money received from each segment, you will be able to understand what actions are best taken to increase revenue: lower prices? increase prices? focus on keeping whales?
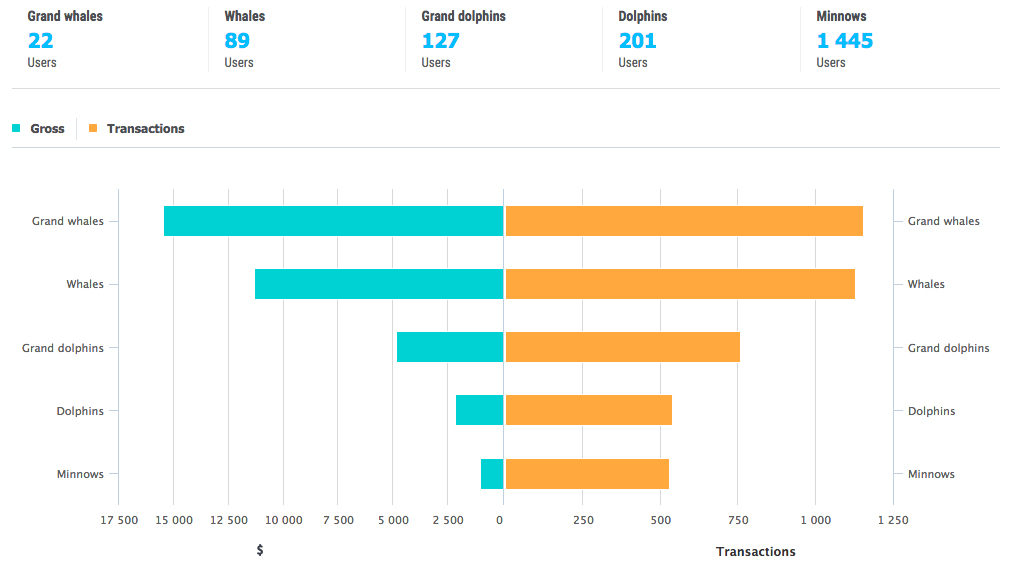
As part of the devtodev service , we divided the paying users in terms of payment volumes into five segments, separating large whales (grand whales) and large dolphins (grand doplhins) separately. In particular, on the considered example it is clear that whales and big dolphins bring the main part of the income, and therefore it is worth concentrating on the main part of marketing efforts on them.
This is only a part of the methods by which it is possible to analyze paying users. There are many more questions, the answers to which will help you to better adjust the monetization of the project. Here are just some of them:
- How quickly do your users convert to payers? First, second, tenth purchase?
- What do users pay for? Why are they generally converted to payers?
- How much money do you earn from the first payments of players, and how much from repeated ones?
- How much money do newbies bring you, and how many old people do you get?
We will tell you in detail about each of the methods of analysis in future articles.
And if you do not want to wait - we invite you to a free webinar , which will be held on October 26, 2015 at 18 o'clock Moscow time
At the webinar we will tell about all the methods of analyzing paying users, we will describe cases, how analytics of paying users helps to increase revenue. Come!
Source: https://habr.com/ru/post/295560/
All Articles