Increase website conversion. Step-by-step instruction

There are a lot of recipes and tips for increasing conversions, cases on how to simplify the registration form or change the button color increased sales on the site. Many marketers use someone else's or their past experience, no doubt that it will work. I also did this by doing internet marketing in IT companies. A couple of times they even argued with the CEO about whose version of the main page will show the best conversion.
But this approach does not work well, most often the hypotheses that I put forward and tested were a waste of time and money. Why did this happen? I did not view conversion enhancement as a process and used only part of the methodology. You need to understand one simple thing - there are no magic templates, designs, wonderful buttons that will increase the conversion on the site. For each case, which tells how the introduction of a video on a landing page increased conversion by 20%, there is a case about how the video lowered the conversion. Personal experience and hypotheses based on expert opinion are only a small part of the process.
')
Hypotheses can be put forward with a high probability of successful testing, if we consider the increase in conversion as a continuous cyclical process consisting of 4 steps:
- Collection and analysis of data.
- Making a list of hypotheses.
- Conduct A / B testing.
- Changes to the site.
This is the approach I use, working to improve the conversion of sites. Let's look at these steps and consider the tools that will be useful in each of them.
STEP 1. Data collection and analysis
All hypotheses must be confirmed by data. The diagram 5 main sources for data collection:

Technical analysis
This is the first stage of data collection, it includes:
- cross-browser and cross-platform testing,
- Estimation of conversion rate in different browsers / devices,
- site speed rating.
It is not necessary to install all browsers and ask your friends for an iPad for a couple of days. Also, it does not always make sense to raise several virtual machines. You can use special web services: paid ( saucelabs.com , crossbrowsertesting.com ) and free ( browsershots.org , IE Tester and others).
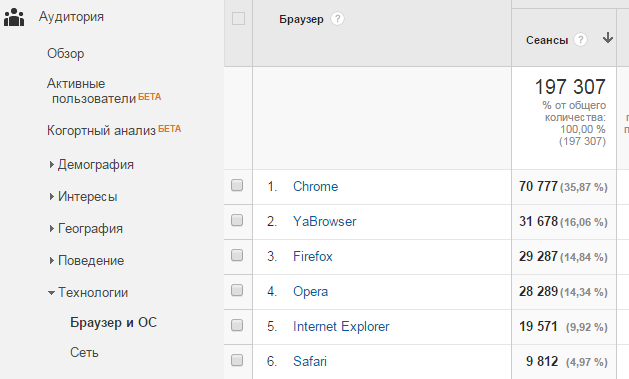
If you have Google Analytics installed, go to Audience> Technologies> Browser and OS . If you’ve set up goals, here you can see conversion rates for each browser.
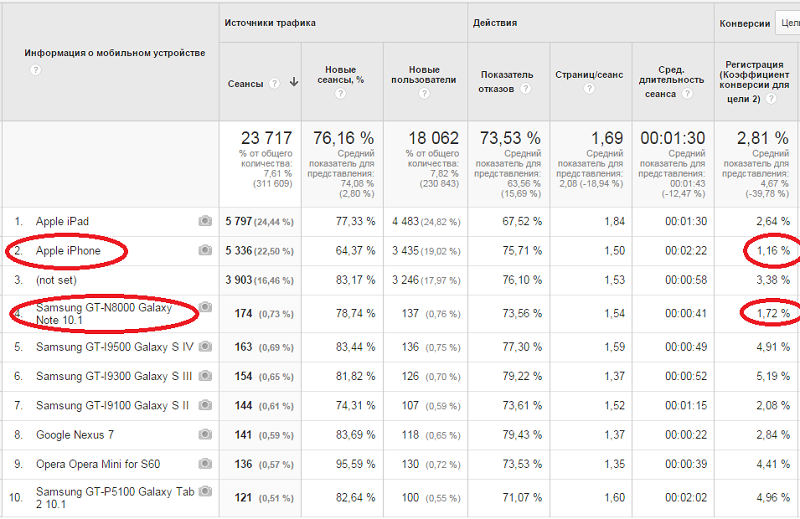
Navigate to Audience> Mobile Devices and you will see which devices your users use to open your site, and what the conversion is on each device. So you can quickly find serious problems in different browsers and on different "devices" that prevent visitors from taking a targeted action.
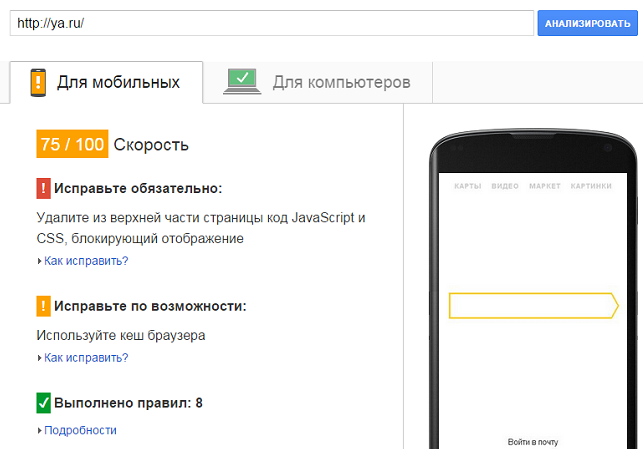
Estimate the overall speed of the site and the speed of loading individual pages using the same Google Analytics. In the Behavior> Site Download Speed section, you can identify problem pages and estimate the overall download speed. In the Accelerate Download section, you can automatically get recommendations using PageSpeed Insights .
Heuristic analysis
Eureka! Shouted Archimedes, revealing the basic law of hydrostatics. "Heuristics" comes from the Greek "to find." The essence of heuristic analysis is that the hypothesis is based on professional reasoning in the process of analyzing the site, and not on strict conclusions from the data obtained. This is where your own experience and expert opinion on increasing conversion comes in handy.
At this stage it is useful to connect designers, usability specialists who, based on professional standards, will be able to identify obvious problems and propose ideas and solutions. If it is problematic to involve experts, you can conduct such an analysis yourself - this is better than not conducting it at all.
5 stages of heuristic analysis:
1. Write out the main tasks that customers solve on the site.
Examples:
- Find information about the most popular products.
- Find the store nearest to your home.
- Place an order on the site.
- Sign up to leave a review.
- Contact technical support in online chat.
2. Imagine that you are a client, and try to solve all the problems. Record all problems and doubts in the process of completing tasks. I recommend taking screenshots with comments, this will facilitate the analysis in the following steps.

3. If you have a checklist ready for analysis, go through it and write out all the shortcomings. Dr. Pete Myers (moz.com) did an excellent checklist for conducting expert usability analysis.
4. Make a report, record all problem areas in the pivot table.
5. Arrange all the problems in order of importance. This will help at the stage of formulating hypotheses to focus on those modifications that will have a greater impact on the conversion and increase sales. After all, everyone knows the rule "20/80"?
User Testing
A study of how the target audience is using your site is one of the most effective methods for obtaining data to put forward qualitative hypotheses. The essence of the method is that you create a specific set of tasks (scenario), and real users solve them by commenting on their thoughts and actions out loud. Looks like a heuristic analysis? Yes, but the target audience will test your site.
Google Analytics shows pages where visitors fall off. The form analytics in Yandex.Metrica points to fields that make it difficult for people. The web visitor can show all the actions of a potential client on the site. Why then test the site on users? To find out the answer to the most important question - why. Why didn't the visitor perform the target action? Why did he order from a competitor?
If previously it was necessary to rent a room (laboratory), prepare special equipment, search for people to hold focus groups, control the process itself, today web services for user testing have appeared that make the process ten times cheaper and faster:
- usertesting.com , trymyui.com (Western vendors, not suitable for Russian projects),
- userpoint.ru (Russian counterpart with a base of Russian-speaking testers).
Custom testing steps:
1. Formulation of research objectives.
Ideally, for each test there should be one specific goal. You can not explore all at once on the site. Set a goal, for example, to identify problems that a customer has in the process of placing an order. A clear goal helps to make the right script and get a good result.
2. Selection of testers.
The main criterion for the selection of testers - they must represent your target audience. The web services listed above have huge user bases, among which you can choose your audience by any parameters.
How many users are enough for testing? This is still argued in scientific circles. Although the research by Jacob Nielsen (one of the pioneers of the user testing method) shows that 5 users find 85% of the problems in usability, the later works of scientists prove that at least 10 testers should be used.
3. Creating a script and tasks.
The scenario is a sequence of 4-5 tasks that the tester performs. The optimal time for passing the script is about 20 minutes. Tasks can be both broad (choose a winter jacket on the site that you like) and specific (pick up a five-star hotel in Turkey for family holidays in September at a price of 30 to 40 thousand rubles per person).
4. Pilot testing.
Creating the perfect script is almost impossible the first time. Tasks and questions need to be tested on 1-2 users, before running the test for the entire group. You can ask your friends to evaluate questions and tasks, take a test, analyze problem areas of the script, make edits.
5. Conducting user testing and fixing all the problems and difficulties of testers.
Web analytics
Analytics systems are one of the main sources of data, the holy of holies of every internet marketer. Although Google Analytics is a more functional system than Yandex.Metrica , I always recommend putting both counters on the site, first of all, because there are excellent free tools for data analysis in the Metric - heat maps, Web viewer, scrolling map .

According to Ruward reports in the Russian market, the TOP 3 most popularly included is the web analytics system from Liveinternet , but I haven't used it for a long time. If you tell me how good she is, I’m happy to read.
The use of complex analytical systems in Russia, which are deeply integrated into business processes ( KissMetrics , for example), is also gaining popularity. The functional creation of visual funnels and graphs, cohort analysis, are often useful and justify the high cost of implementation.
I will not dwell on how to look for problems with the help of each tool, dozens of books have been written about them, a lot of useful material can be found on the net. I advise to study:
- 10 Google Analytics reports that tell where you are losing money.
- 10 experts talk about the most important GA reports.
- Unusual reports that increase conversion.
The main principles of working with analytics systems that help identify problems and put forward the right hypotheses:
1. Decide on KPI, set up goals.
Of course, you can spend days exploring the wonderful world of analytical systems and look at numbers, graphs and hypnotizing heat maps with a smart look. But it’s better to focus on the most important metrics of your industry that affect conversion.
Do you have an online store? Fine. Have you seen that in the last couple of months visitors spend 10 seconds less time on the site and are sad? In fact, this metric is not very important for stores. Better configure goals and events to analyze the actions that the visitor performs. Conversion at every stage of the purchase is what matters most.
2. Explore the segments, the overall indicators are not important.
Let's say the total conversion rate to sales on your store's website is 3%. Sex and age analysis shows that the highest conversion (5%) is for women between 25 and 35 years old and they bring more than 80% of income. Maybe it is worth adding to the range of more products for this category of customers? Here it is, a valid hypothesis.
3. Make your KPI-based checklist and set up deshboards.
Create your checklist of important site metrics and customize reports. This will speed up the process of analyzing and proposing new hypotheses.
Feedback and polls
For correct hypothesis, feedback from visitors is helpful. Surveying, collecting and analyzing ideas and problems will help you understand what your users are most concerned about and focus the work on increasing website conversion in the right direction.
On the landing pages of the site, the user must perform some actions. Survey should be built around these actions. For example, in an online store on a page with a description of a product, the target action is to add a product to the cart. What question can I ask the user on this page? Why you do not add goods to the basket right now? Try different options.

Also, quite often surveys conduct online shopping some time after the purchase of goods. We are sent letters and asked if we were satisfied with the quality of service, what would advise to improve on the website of the online store.
Survey tools abound. These can be scripts and Google-forms, free plug-ins for popular CMS, as well as specialized services like surveymonkey.com and qualaroo.com .
Feedback can also be collected and analyzed using other channels:
- standard feedback forms
- online chat rooms
- forums, communities, social networks,
- call centers
- personal communication with customers.
Never trust feedback from users to 100%
Of course, people can share great ideas to improve the functionality of your project, even participate in its development. But very often the ideas of users can be misleading. It is unlikely that buyers understand the intricacies of your business, and solutions that are obvious to them may be disadvantageous to you. You will not distribute goods for free, because users want so? And they want it.
Therefore, always compare the feedback of users with data from other research methods. If the opinions of visitors coincide with analytics data, for example, users are asked to add more products for women to the shelves, and gender and age analysis shows that women aged 25 to 35 bring you 80% of income, this is an excellent reason to conduct experiments and possibly expand the range for this audience.
STEP 2. Making a list of hypotheses
So, after the first step, you found all the problem areas on the site and obtained enough data to draw the right conclusions and formulate hypotheses for the following experiments and A / B tests.
Record problems in a table and evaluate the importance of each problem.
If you find critical issues (which do not allow users to complete the purchase process, text errors, obvious bugs, etc.), you should immediately make changes to the site, bypassing the A / B testing.
Set your rating for each problem depending on its importance. Pip Lai in his book “Master the essentials of conversion optimization” describes two main criteria for assessing the importance of problems:
1. Ease of solution.
If it takes several months to solve a problem and you need to spend a lot of resources on programmers, obviously, this is not the problem that needs to be addressed first.
2. Impact on the result.
Estimate at least approximately, what benefits will you get by solving the problem, how much should the conversion increase? What percentage of income will grow?
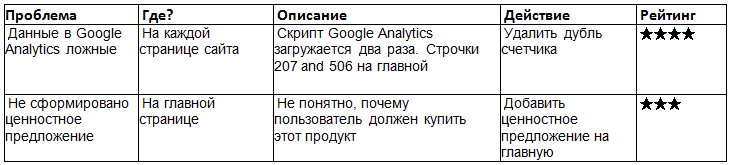
Pip uses the following table to analyze problems (I simplified it a bit):
Transform problems into hypotheses
Each hypothesis should be based on the data obtained and contain recommendations on what to do next. The better the hypothesis is formulated, the greater the likelihood of achieving a positive result.
I will give an example. When conducting user testing at the checkout stage, several people were embarrassed by the inability to contact a consultant. Google Analytics showed that at this stage a large bounce rate. Hypothesis: introducing an online chat for consultation on the checkout page will increase conversion by 20%. It's time to do A / B testing.
STEP 3. Conduct A / B Testing
A / B testing is a study that allows you to determine which version of a site page will provide the best conversion.
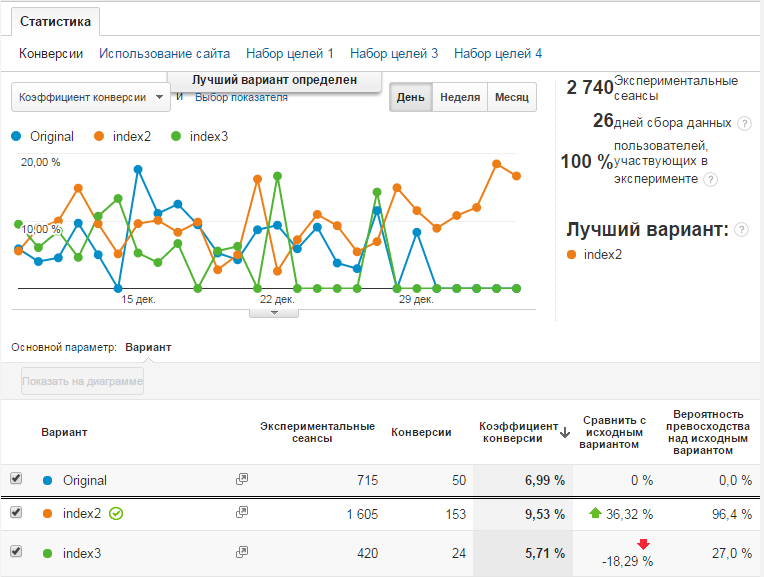
Most of the time, it’s enough for me to run a free tool that is embedded in Google Analytics: Behavior> Experiments :
Of course, there are more functional services (usually paid), which allow for complex multivariate testing, integrate with analytics systems, allow you to segment traffic and have a bunch of other useful features:
- optimizely.com is perhaps the most powerful tool of experts of the western market. Allows you to segment your results, create heat maps and integrate with everything you can imagine.
- changeagain.me - Russian-language service with a visual editor and integration with Google Analytics,
- abtest.ru - Russian service (free yet)
- convert.com ,
- vwo.com .
To calculate the time it takes to test, to determine the sample size, you can use the calculator from Optimizely. I also advise you to read the article on how to test sites with low traffic. Usually, the algorithm for determining the best result, based on the scientific approach (statistics is a whole science), works automatically and is “sewn up” inside the services for testing.
STEP 4. Changes to the site
At this step, you need to make changes to the site based on the analysis of A / B tests. If your hypothesis was confirmed and the A / B test showed that the new page increases conversion, this is great. Make a change. If the results of the A / B test are dubious or your hypothesis was not confirmed - this is normal, for this you need to test. Go to the next hypothesis.
Do not forget that changes may increase the conversion in the first stages of the sales funnel, but not bring the final result (money). I will give an unfortunate example from my experience. For the past 5 years, I've been marketing SaaS products. After the redesign, it seemed to me that the registration form is too complicated and reduces conversion. I looked at Yandex.Metrica (form analytics) and it turned out that some fields cause difficulties for users. I decided to remove them or simplify them as much as possible (removed the field “Describe your tasks” and the field for entering the phone, reformulated some fields more clearly). Testing showed that the conversion at the registration stage increased one and a half times, I was delighted, and we changed the registration page. What was the result? Indeed, the number of registrations has grown. But has there been more payment? Not. There are more non-target registrations that are not converted into sales. For those who really needed the product, there was no special value for how many fields were in the form. The change only increased the burden on support and sales.
Therefore, always analyze the final result - what economic benefit did the change on the site bring to you?
Source: https://habr.com/ru/post/295084/
All Articles