Zoho Reports. What it consists of and how to work with it
 From the point of view of managers, the main goal of any system (whether it is the accounting system or CRM) is reporting generation for decision making. And in this regard, on any project, the question arises of where and in what form to present the data accumulated in the system. In this article I will talk about one of the reporting tools - the Zoho Reports system. Just want to say that this article was written in order to introduce you to the Zoho Reports system, if you need more detailed information - please refer to the Zoho Reports help .
Zoho Reports is a powerful online business tool for creating and working with reports.
In Zoho Reports, you can upload your data, create reports using an intuitive interface, share information and assign access rights to it.
Why did I choose Zoho Reports?
On one of the projects for the implementation of Zoho CRM, the question arose in which system to form the reporting data. Zoho CRM itself has reports, but they are standard, and there is practically no data on the relationship of one indicator to another. For example: in the system there are reports on concluded deals, but there is no report on the relation between successful and lost deals.
In these standard reports at the bottom there is an inscription that these reports are formed using the Zoho Reports product. I have already addressed directly to this system, and I realized that it has practically unlimited possibilities for creating and reporting. Thus, I became acquainted with this tool, and naturally I chose this product for reporting on this project.
Now I will tell what this system consists of in more detail.
')
Tariffs Zoho Reports.
There are 5 tariffs in Zoho Reports:
- Free
- Standart
- Professional
- Professional Plus
- Enterprise
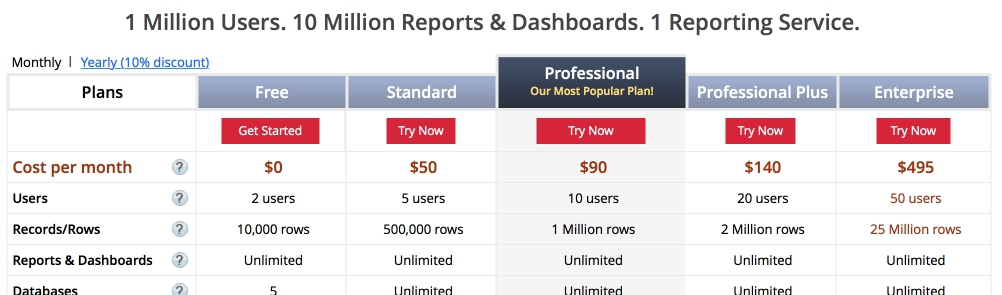
I will not dwell on each tariff in detail. In the tariff scale everything is described quite clearly. But first of all, what you should pay attention to when choosing a tariff plan:
- Integration with Zoho CRM, if you want to use Zoho Reports in conjunction with Zoho CRM. All rates, starting with the second, provide such an opportunity.
- The number of records available for storage in Zoho Reports. If you download data from different tables, you can very quickly reach the tariff limit.
Suppose you have 35 managers, they make an average of 40 outgoing and incoming calls in the system per day - it turns out:
35 x 40 x 240 (even if we assume that there are 20 working days in a month, 240 working days per year) = 336,000 call records per year.
And if you have data for 2 years, it turns out 2 x 336 000 = 672 000 records. Thus, the second Standard tariff offering 500,000 entries is not suitable for you.
And there are 2 options for further work: either move to the next tariff, or, if necessary, you can buy additional records for yourself, without switching to another tariff.
The remaining parameters of the tariff scale are almost unchanged and not significant when choosing a tariff plan.
Licensing.
Zoho Reports is a SAAS solution, that is, the work of the system is carried out exclusively through a web browser, and no programs are installed on the user's computer.
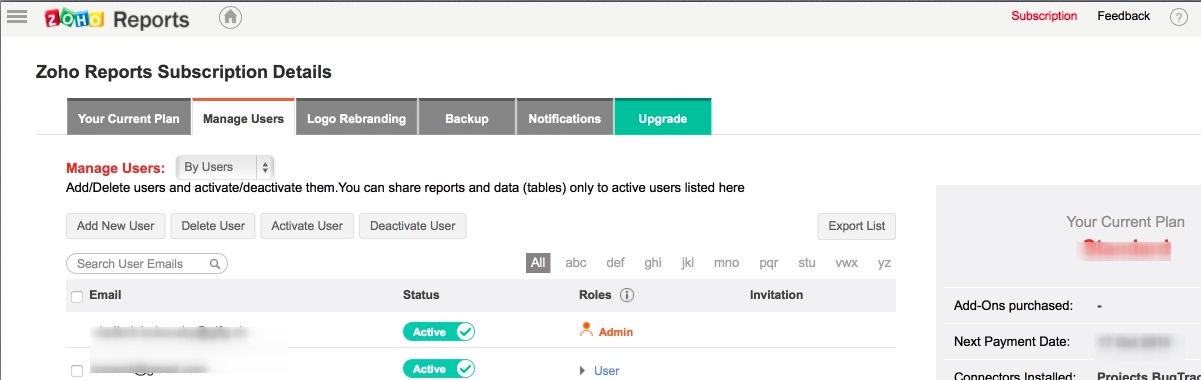
To get started with Zoho Reports you need to buy a license. A license is needed in order to have access to the system. Each license gives the right to connect to the username and password an unlimited number of times, for example, from a computer, laptop and smartphone. Licensing occurs by users, i.e. one license corresponds to one user logged on to the system. You can run as many simultaneous sessions as one user. This is important to understand in order to determine the number of licenses you need to buy. For example, if there are 3 managers in a company, you do not need to buy 3 licenses to view reports; one will be enough. But the number of users recorded in Zoho Reports can not be greater than the number of licenses, it must be understood. That is, to give access to a new user, you must either deactivate another user, or buy a new license.
It is also important to understand that you can publicly publish your reports, for example, on your site, but at the same time each site user will not be considered a Zoho Reports user.
Components Zoho Reports.
Now I will tell you what the work of the Zoho Reports system consists of:
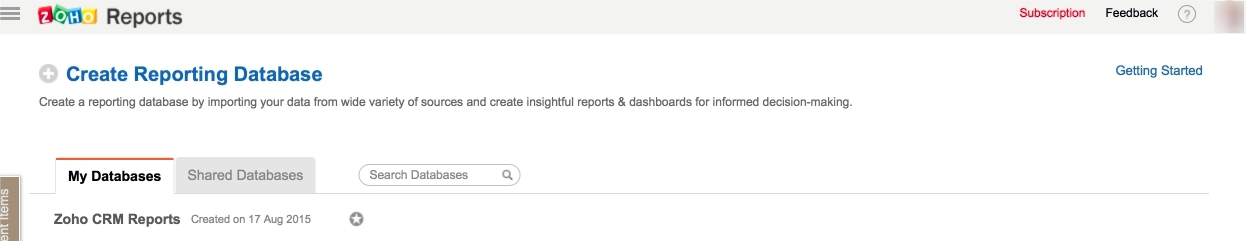
1. Databases (Databases).
Any work in the Zoho Reports system begins with a database. In order to generate reports based on some data, it is necessary to store these data somewhere and extract them from somewhere. This is what Zoho Reports databases are for.
Database access can be restricted or the database can be made available to all users.
2. Tables.
The database stores the so-called tables in the form of columns and rows. For example, we upload a table from Zoho CRM to get reports on the CRM system. To begin with, we create a database, and already in it a table, for example, “Calls”. Thus, each of the CRM-system data arrays (Transactions, Lida, Contacts, etc.) will be stored in Zoho Reports tables.
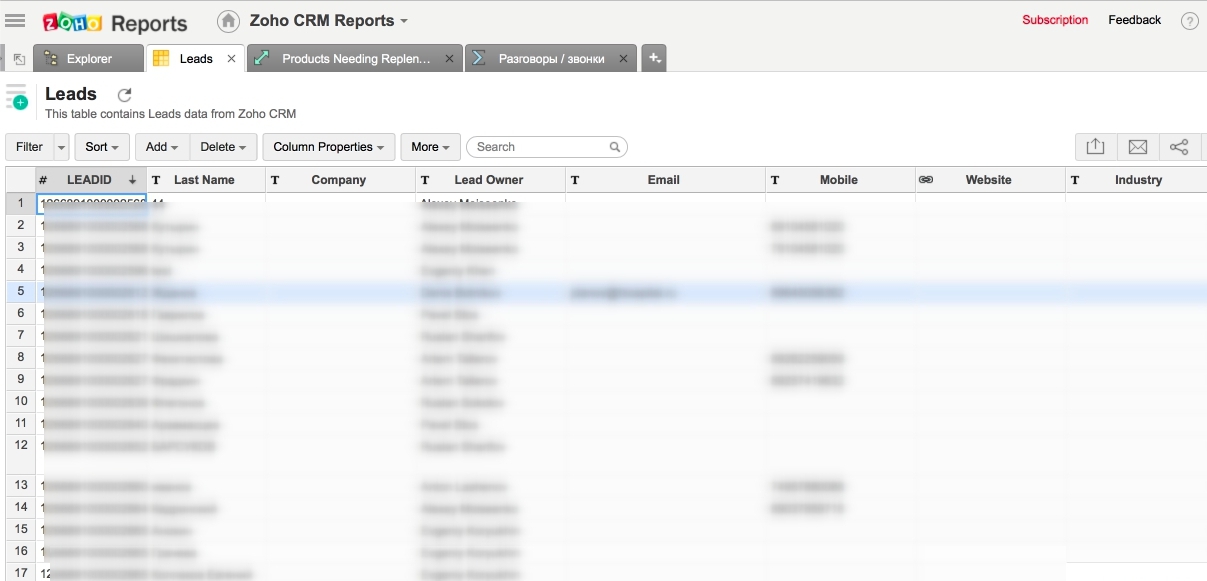
Tables are stored in a visual form, you can always enter them, view and filter the data. Zoho Reports tables resemble Excel tables, but you cannot form reports directly in Zoho Reports tables, as you can do in Excel. That is, Zoho Reports tables are intended only for data storage, for generating reports, you need Reports (Reports).
3. Query tables.
Also in the Zoho Reports system there is such a handy tool as query tables. They can not store data and this is not reporting, they are designed to store subtotals. Query tables are an intermediate option between storing and outputting data. The data in the query table appears at the time it is accessed.
For example, we want to know the relationship between the calls made by managers and the deals made by these managers. For the report, we need to divide the number of transactions by the number of calls. We cannot get this data from one table. We need data from the “Calls” and “Deals” tables, and therefore we create a query table, which we call Transactions / Calls, and which we fill in with data from these two tables.
And then we will use this data from the query table in the report. For example, on one of the KPI reporting projects, it was necessary to display data for two or more tables in one report. For this and were used tyblitsy requests.
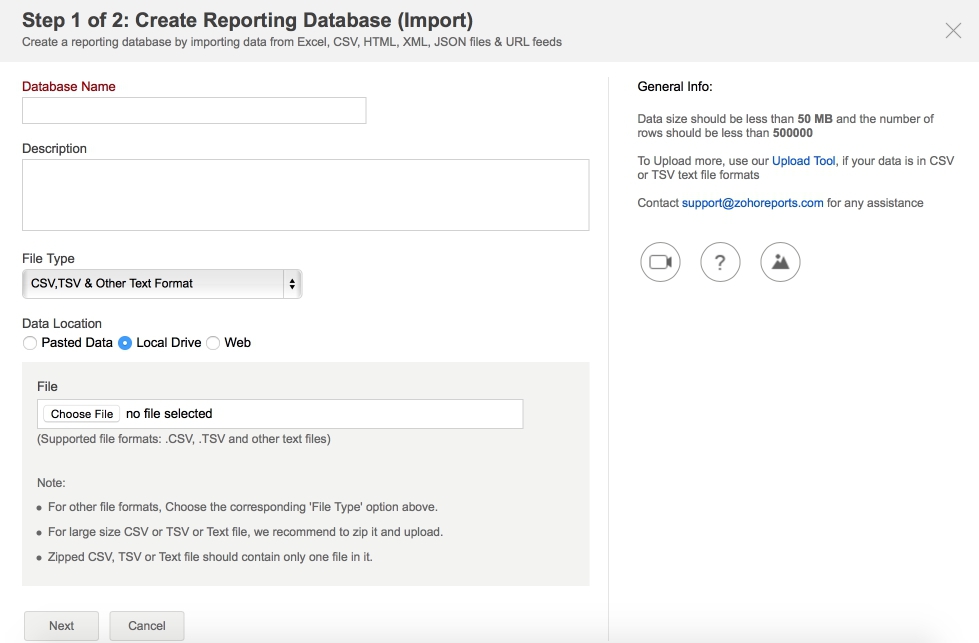
4. Data import, integration, API.
The system Zoho Reports there is a very convenient opportunity to import data. In all products, Zoho is generally a very well-developed tool - data import, but it goes to a new level in Zoho Reports. You can import data from almost anywhere, the source of your data can be csv, xls, json, html, xml files. (You can see more in the video )
Zoho Reports integration is also possible with a wide variety of systems: Zoho CRM, Salesforce, Google Analytics, etc.
You can also use the API to integrate your system with CRM. For example, I used the integration of Zoho Reports with Zoho CRM, the data was updated every 5 hours, respectively, the data was relevant every 5 hours.
5. Reports (Reports).
When you upload data and learn how to store it, you can generate reports - that is, do something for which Zoho Reports was developed.
The data in the reports can be presented in the following forms:
- Spreadsheets and pivot tables are similar to Excel with some settings.
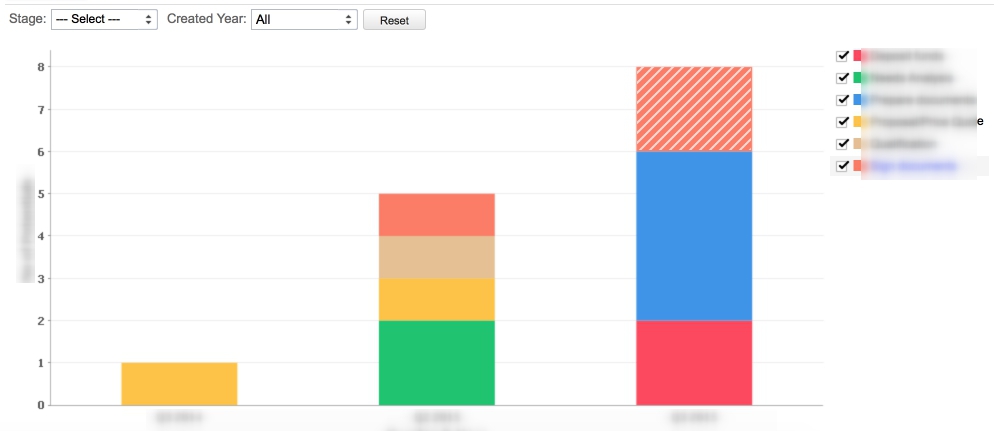
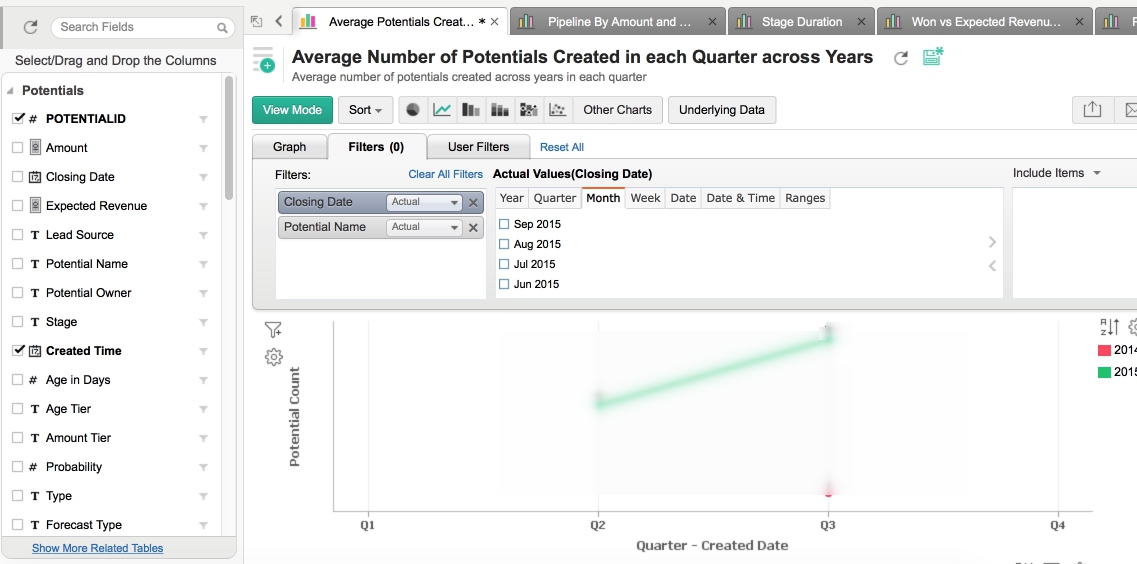
- Charts (diagrams) in various representations (funnel, line graphs, histograms, pie charts, scatter charts, spider webs, etc.)
- Dashboard (Dashboard) - you can present data from multiple reports in one place. Dashboard is a handy tool that allows you to display and group basic data and analyze them. You can combine a sales chart with a table on the performance of managers, etc.
Regardless of their appearance, be it a pivot table, a point chart, or a pie chart, all reports have the same settings:
- filtering settings
- appearance settings
- access rights settings
I will tell about all this further.
Work with data.
In this section, I will talk about what can be done with the data.
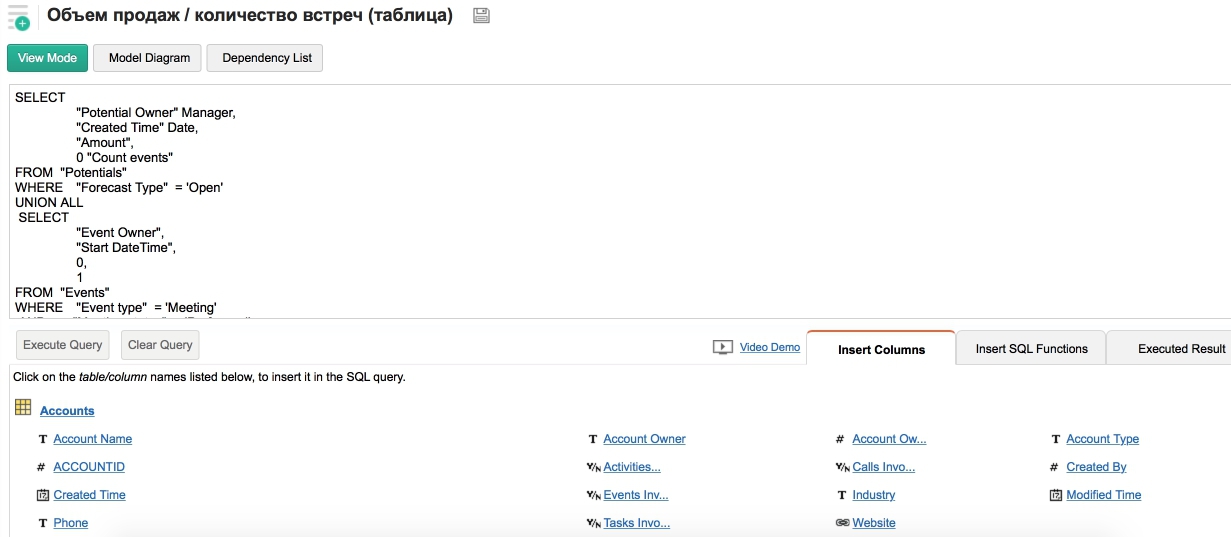
One of the things that pleasantly surprised me in the Zoho Reports system is that it is possible to use the SQL query language when creating a report. That is, when creating tables, you do not need to master a separate language, the standard knowledge of a programmer is sufficient. At the same time, it is necessary to take into account that the set of SQL functions is limited, that is, it does not have all the SQL functions.
In the system, you can use a tool such as a formula. What is the formula in Zoho Reports? The formula is used in Zoho Reports to convert already prepared data. The formula makes it possible to manipulate the data that is already in the system and formed into tables. There are 2 types of formulas:
- Custome Formula
- Aggregate Formula
Custome Formula - formula type, using which, we can add a new column to our table. The data in this column is not stored in the database, but calculated on the basis of other data, which in turn is stored in the database. This formula is necessary to form a result based on complex calculations: we can take data from one column, multiply by data from another column and put the calculated result in the third column.
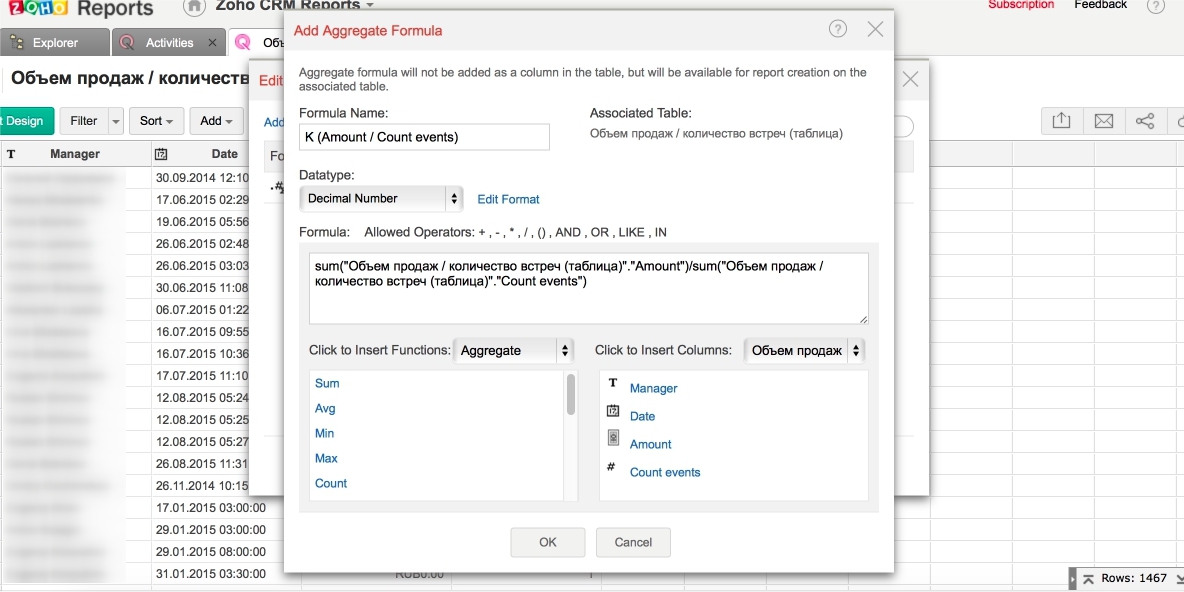
Aggregate Formula is a type of formula that does not create a new column, but which can be used to transform data. An aggregate formula added once in one table will be available in other tables.
Once again I will explain: custome is used only when creating new columns in a table, but not available elsewhere, aggregate is available everywhere, but does not create a new column, and you can use aggregate functions to create indicators in reports.
Filters.
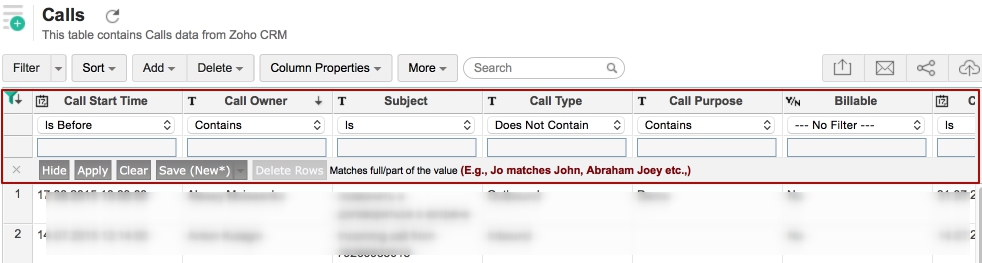
Filters are widely used in database tables. The filter can be used to quickly sort the data by specific parameters directly in the table.
In addition, there is filtering data directly in the reports. There are several options for using filters:
The first option, when we rigidly prescribe, by what value we filter the data in a specific report. For example, if we need a sales report among managers and we want the report to show data for only one sales department, we create a filter and write the required department in the filter. This example is illustrative, but not very correct.
The second type of filtering is when we create a filter for the user: for example, we can create a filter by department, and the user himself will choose the department that he needs. This is necessary for the CEO, for example.
As for the above filtering options, suppose that the company has three divisions. We can create one report for a manager with data for all departments and then we can divide this report into three for managers of various departments with filters reflecting only their department. And in the end we get 4 reports. This is how this filtering scheme works.
But in addition, you can set filters when sending data, that is, certain users are assigned rights with predefined filters at this stage. That is, this does not happen at the stage of developing a report, but at the stage of sending it. For example, so that users can see the sales of employees only their units.
Filtering data is not exactly filters in the usual sense of the word, it is rather a restriction of access rights.
Access rights.
The Zoho Reports system provides several types of users:
- Administrator - a user who has full access to the system, can create databases, reports, etc.
- The database owner is a user who has access to certain databases and can do everything with them that is necessary, except for deletion and renaming.
- The user is the one who has the ability to work with tables, databases, reports, etc. within the limits of access granted to him
Users can be public or private. Private users are those who must log in to the Zoho Reports system with a username and password in order to see and work with reports and other necessary information.
Public users - those who have access to public information, for example, see the report data presented on the site, or have access by reference. Thus, it is possible to share data not only with users of the system, but also with those who do not use Zoho Reports. It is enough to generate a web link and send it. You can also place your data in a mobile application or on the website. It is enough to place the code and set the privacy settings.
At the same time, public users do not have access to data filtering, changes in the appearance of reports.
Appearance.
Zoho Reports provides an intuitive interface for creating and maintaining reports. Just a few clicks you can create a chart. Reports are based on the principle of Drag and Drop. To create a report in editor mode, drag the desired indicators to the corresponding cells. Next, click Create Chart.
You can edit the appearance of the report at any time. You are given the opportunity to change the appearance of the diagram, edit the axis of the graph, the color of the diagrams, add captions and much more.
Also, Zoho Reports interface can be adapted to the style and color scheme of your company.
Support.
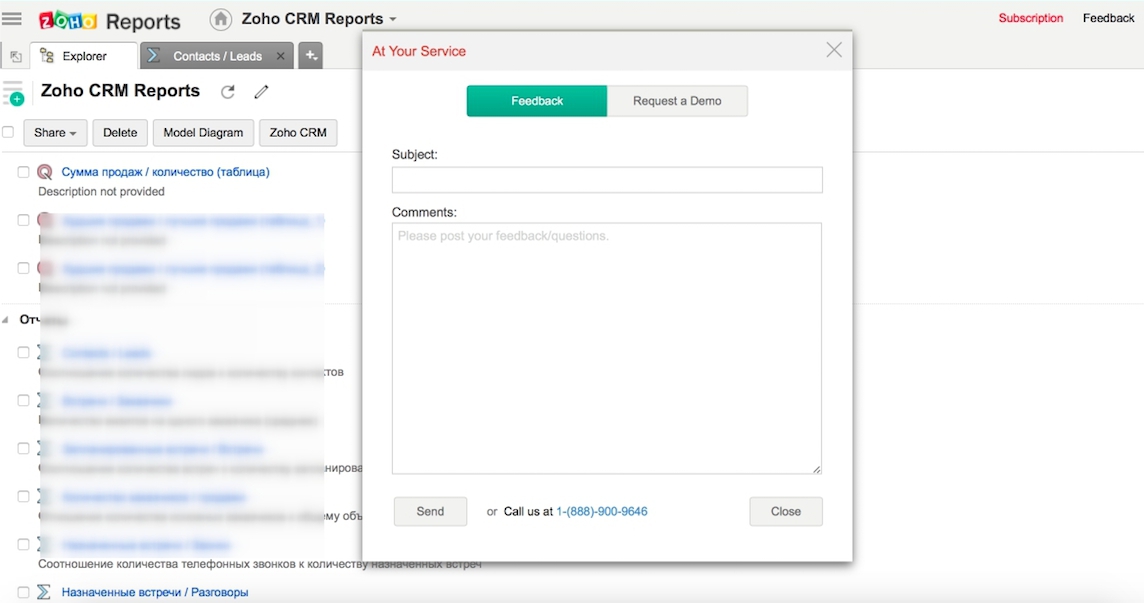
Support in the Zoho Reports system exists at the email level. There is no online chat as provided for in Zoho CRM. Here you are writing an error letter to the support service, and you are also answered via email.
Or you can call the number indicated in the request form, but they will answer you in English.
Conclusion
In conclusion, I want to summarize why I recommend Zoho Reports as a reporting system:
Pros:
- ability to import data from almost any source
- wide integration possibilities
- intuitive report designer
- multiple types of reporting
- settings of access rights to reports
- opportunity to share reports with people who are not users of Zoho Reports
And of course, the cons:
- No localization in Russian
- Mail support
- SQL limitations
I can say that I was very pleased with the Zoho Reports system and recommend it to everyone who is faced with the question of how and where to form reports. If you still need information on how Zoho Reports works, I’m sharing with you a link to a collection of small videos on Zoho Repotrs, for which I have prepared a Russian translation.
Source: https://habr.com/ru/post/294912/
All Articles