How to find an idea for a / b test: heat maps and polls

The best A / B tests are created based on data received from the users themselves. You can ask your friends what problems they see on the site. But they are not a target audience. It is much more efficient to use surveys and heatmaps to search for problems on the site and ideas for A / B tests.
This is what will be discussed in the article that we wrote together with Elena Ivanova, the creator of the site Seocyber.net, an expert in SEO, Copywriting and Internet marketing.
')
Collection of quality data from e-mail newsletters
Surely, you are collecting a database of postal addresses of your subscribers and buyers? If not, start doing it. High-quality feedback will help you answer many questions.
For example, people do what you want, but why do they do it? Or, on the contrary, they do not do what you want (for example, do not make a purchase), and you are concerned about the question - Why?
Answers to these questions can be found through the E-mail newsletter or directly on the site using embedded surveys.
Someone will say that web analytics is enough to understand their visitors. But no. Web analytics provides quantitative data. This data will show you what people have done or have not done what you need, but will not answer the question: "Why."
Therefore, quality feedback is very important. To get feedback, you have to do either E-mail newsletter, or post a survey directly on the site. And it is desirable to use only one question. The fewer questions, the higher the likelihood that someone will answer them.
Examples of questions:
- What prevented you from making a purchase in our store?
- Why you are not registered on the site?
- What prevented you from subscribing to the newsletter?
- Was it easy to make a purchase?
- What articles are the most interesting for you?
- Is it easy to navigate the site?
In general, we wrote a separate article about the issues that help you better know your target audience and find problems on the site. - Know your target audience or die: 34 vital questions
From this article you can get a lot of ideas for surveying your target audience.
Online shopping is important to know what is missing on the page for the user to make a purchase. It may be difficult for him to find a basket or in the basket itself you do not give him the choice of the method of delivery or payment. The reasons may be many. Figure them out!
Information resources need to know which topics of articles and news interest the target audience. This data will help to build a content strategy. Due to this, the bounce rates will decrease (after all, you will begin to give exactly the information that the reader needs), the session duration on the site and the number of pages viewed will increase.
It is important that you never learn about such problems and needs if you do not communicate with your target audience. Your opinion about the usability of the site, the convenience of the interface, the content is very subjective, because you use the site every day, and everything is simple and convenient for you. But for the client, everything could be completely different. This is what you need to try to find out through polls.
For example, Qualaroo, the embedded polling service directly to the site, also uses this tool to interact with the target audience.
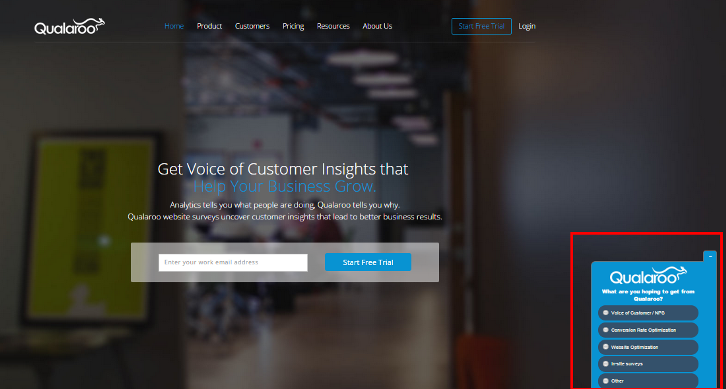
If you go to their homepage, then after a couple of seconds a poll appears in the lower right corner. With the help of this survey, they are trying to find out what visitors expect from using their service: feedback from potential customers, increasing conversions, website optimization, embedded polls or something else.
Thanks to the answers, they will find out with what needs visitors come to the site. I am 99% sure that the title “Get Voice of Customers Insights That Help Your Business Grow” is on the main page precisely because people most often choose the first option in the survey - Voice of Customer. If they want to get it, then this is exactly the way to position their product in the first sentence, which reads the largest number of visitors.
This is a confirmation that the polls are working and need to be constantly conducted . Only in this way can you create a product that meets the expectations of your target audience. The only way you learn to speak the language of customers. But this is what affects the conversion rate and the level of sales.
Article in the topic - They will help you find all the "killers" of conversion - 10 reports in Google Analytics
Survey Services
As for the tools, more details about them can be found in this review . There is a detailed description of the functionality and cost of the most convenient and popular services.
Among them is SurveyMonkey, which has a good functionality and a Russian version. And, of course, Google Forms, which is absolutely free.
Heat maps (HeatMap)

Heat maps allow you to see which elements users click on, how deeply they scroll the page, on which links they most often click.
I personally have repeatedly observed such a situation, when there is a non-clickable element on the page, on which users are constantly pressing in the hope that another page will open. And you will never know about it without the use of heatmaps.
A simple example:
We have a website that sells stoves.
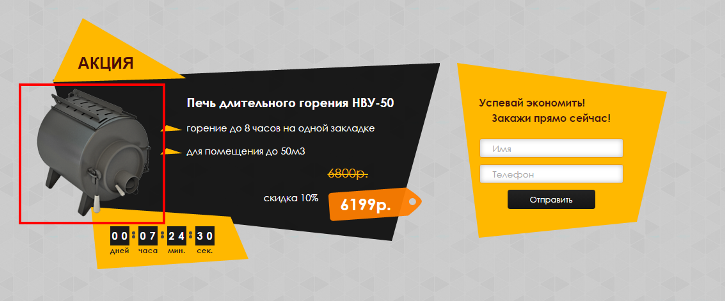
On this site there is a block with a discount on one oven. As you can see, there is a photo, a very brief description and the ability to make an order. At the same time, we know for sure that many visitors do not leave orders immediately, but first read the detailed description in the item card. But in this block there is no link through which one could go to a detailed description. And here is a confirmation that people want to learn more about the oven.

They are tight on the image, on the text, but nothing happens. Of course, some people already fill out the form. But some do not, because they are not ready yet and they need to learn more about the product. When we learned this, we immediately added links to the image and texts leading to the description of the goods and there the visitor is again invited to make an order.
In fact, with the help of heatmaps you can see which elements attract site visitors the most and based on that you can build the structure of your site and generate hypotheses for A / B testing.
North Face Case
Online shop North Face noticed that many visitors reach the basket, but very rarely place an order. Asking the question: “Why”, they conducted a study using heat maps. It turned out that the reason was in the advertising banner, which was located directly above the basket and distracted the attention of visitors.
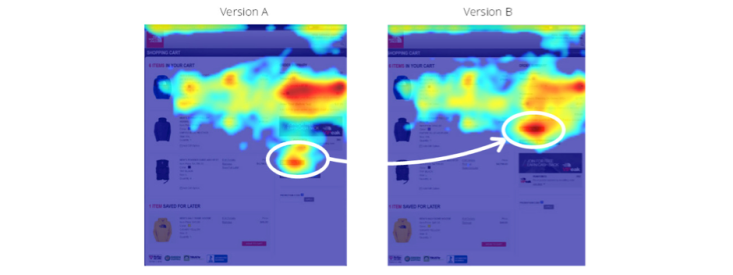
In the A / B test, the ad banner was moved down to the button. The result is an increase in sales of 21%.
It would seem a harmless trifle - an advertising banner above the basket. But without an analysis of heat maps, they would not have been able to find problems. And without A / B testing, you would not know exactly how this change affects conversion and sales.
Article in topic - 10 successful cases A / B testing
Case from Nurse.com
The nurse.com marketers decided to check how effective their resource is using heat maps. They set a goal to increase the number of registrations for the training program.
Heat maps showed that visitors were lost on the site and did not know what to do next: they clicked on non-clickable elements, the main content was ignored almost completely, and secondary links were more popular than the main STA elements.

Based on these data, the team brought out a number of ideas, which boiled down to three A / B testing options. The winning option increased sales by 15.7% with unchanged traffic levels.
Heat maps also showed a clear change: instead of the chaotic movement of the page, users began to refer to its most important elements.
In the winning version, only one CTA element was left, the color of which was yellow; extra links have been removed that distract visitors; The main content, which the visitors did not pay attention to in the previous version, was placed in the area of the site that attracted the most attention (in the upper left corner)
A click card is not the only important function of heatmaps. There are also scrolling cards, with the help of which you can find out how deeply visitors scroll through the pages of the site.
What is the use of scrolling cards?
Let's imagine the situation that you have a landing page. On the landing page you have the first screen, blocks with functions, reviews, price, work process and order form at the bottom of the page.
One day you have a question - Why are there so few orders?
To answer this question, you climb into a scrolling card, open your page and see that only 10% of all site visitors reach the order form. They just do not flip so deeply and do not see this form. They see the features, reviews, price, and are ready to take action, but do not know how, to do it. And leave the site.
It is likely that the placement of two forms for the order - on the top (on the first screen) and on the bottom of the page - can solve this problem. In this case, it remains only to run the A / B experiment, where in the test version insert two forms. And then look at the number of completed forms.
Just because?
You see, if the majority do not reach the footer, then you should not place important elements in it.
By analyzing the scrolling map you can understand which blocks attract the attention of users most of all, what information is most important to them. You will also understand which areas of the site are less interesting and important for your visitors. Based on this, you can remove something altogether, but something just needs to be changed and made more attractive.
Services for analyzing user behavior
As for services for heatmaps, there are quite a lot of them, but almost all of them are paid. And only Yandex Metrika provides completely free heatmaps, form analytics and a web viewer, which can greatly help in improving your website and generating ideas for A / B testing .
In order for you to have the opportunity to see the heat maps in Yandex Metric, you must check the corresponding boxes when installing. And then in the interface go to “Maps”.
But if you do not like NM with something, then you can view our review of the best services for analyzing user behavior . Personally, I used and use Hotjar.com , and in terms of functionality / convenience, I like it much more. There is a web viewer, and heat maps, and embedded polls. But the free version has limits on all functions.
Heat maps and surveys are the must-have tools for a conversion specialist. Their effectiveness is proven by a variety of cases. Therefore, use them when searching for ideas for A / B testing. Then the probability of success of your experiments will be much higher.
The article was prepared by: Andrey Baklinov ( Boosta.ru , Changeagain.me ) and Elena Ivanova ( Seocyber.net )
Read also our other popular articles:
1. They will help you find all the “killers” of the conversion - 10 reports in Google Analytics (5000+ views)
2. 100 ideas for A / B testing. Part One (2000+ views)
Source: https://habr.com/ru/post/294798/
All Articles